InTrans Project Reports Institute for Transportation
7-2016
Improving Striping Operations through System
Optimization - Phase 2
Ronald G. McGarvey
University of Missouri, [email protected]
Timothy Matisziw
University of Missouri, [email protected]
James S. Noble
University of Missouri, [email protected]
Charles J. Nemmers
University of Missouri, [email protected]
Gokhan Karakose
University of Missouri, [email protected]
See next page for additional authors
Follow this and additional works at:http://lib.dr.iastate.edu/intrans_reports Part of theCivil Engineering Commons
This Report is brought to you for free and open access by the Institute for Transportation at Iowa State University Digital Repository. It has been accepted for inclusion in InTrans Project Reports by an authorized administrator of Iowa State University Digital Repository. For more information, please [email protected].
Recommended Citation
Improving Striping Operations through System Optimization - Phase 2
Abstract
Striping operations generate a significant workload for MoDOT maintenance operations. The requirement for each striping crew to replenish its stock of paint and other consumable items from a bulk storage facility, along with the necessity to make several passes on most of the routes to stripe all the lines on that road, introduce the potential for inefficiencies in the form of deadhead miles that striping crew vehicles must travel while not actively applying pavement markings. These inefficiencies generate unnecessary travel, wasted time, and vehicle wear.
Phase 2 updates a 2015 project that developed a decision support tool for scheduling and routing road striping operations. The updates presented in the final report improve the optimization model, which generates more user-friendly outputs.
Keywords
Decision support tools, fleet operations, highway maintenance, striping operations, optimization models, geographic information systems
Disciplines Civil Engineering
Comments
For this and other reports, visit the Midwest Transportation Center project page:
http://www.intrans.iastate.edu/mtc/index.cfm/research/project/project/-1928248927or the Intrans websitehttp://www.intrans.iastate.edu/
Authors
Ronald G. McGarvey, Timothy Matisziw, James S. Noble, Charles J. Nemmers, Gokhan Karakose, and Christopher Krause
Improving Striping
Operations through System
Optimization – Phase 2
Final Report
July 2016
Sponsored by
Missouri Department of Transportation Midwest Transportation Center
About MTC
The Midwest Transportation Center (MTC) is a regional University Transportation Center (UTC) sponsored by the U.S. Department of Transportation Office of the Assistant Secretary for Research and Technology (USDOT/OST-R). The mission of the UTC program is to advance U.S. technology and expertise in the many disciplines comprising transportation through the mechanisms of education, research, and technology transfer at university-based centers of excellence. Iowa State University, through its Institute for Transportation (InTrans), is the MTC lead institution.
About InTrans
The mission of the Institute for Transportation (InTrans) at Iowa State University is to develop and implement innovative methods, materials, and technologies for improving transportation efficiency, safety, reliability, and sustainability while improving the learning environment of students, faculty, and staff in transportation-related fields.
ISU Non-Discrimination Statement
Iowa State University does not discriminate on the basis of race, color, age, ethnicity, religion, national origin, pregnancy, sexual orientation, gender identity, genetic information, sex, marital status, disability, or status as a U.S. veteran. Inquiries regarding non-discrimination policies may be directed to Office of Equal Opportunity, Title IX/ADA Coordinator, and Affirmative Action Officer, 3350 Beardshear Hall, Ames, Iowa 50011, 515-294-7612, email [email protected].
Notice
The contents of this report reflect the views of the authors, who are responsible for the facts and the accuracy of the information presented herein. The opinions, findings and conclusions expressed in this publication are those of the authors and not necessarily those of the
sponsors.
This document is disseminated under the sponsorship of the U.S. DOT UTC program in the interest of information exchange. The U.S. Government assumes no liability for the use of the information contained in this document. This report does not constitute a standard, specification, or regulation.
The U.S. Government does not endorse products or manufacturers. If trademarks or
manufacturers’ names appear in this report, it is only because they are considered essential to the objective of the document.
Quality Assurance Statement
Technical Report Documentation Page
1. Report No. 2. Government Accession No. 3. Recipient’s Catalog No.
MoDOT Report cmr 16-015
4. Title and Subtitle 5. Report Date
Improving Striping Operations through System Optimization – Phase 2 July 2016
6. Performing Organization Code 7. Author(s) 8. Performing Organization Report No.
Ronald G. McGarvey (orcid.org/0000-0002-8825-8553), Timothy Matisziw, James Noble, Charles Nemmers, Gokhan Karakose, and Christopher Krause
9. Performing Organization Name and Address 10. Work Unit No. (TRAIS)
Center for Excellence in Logistics and Distribution (CELDi) University of Missouri
E3437 Lafferre Hall Columbia, MO 65211
11. Contract or Grant No.
USDOT/OST-R Grant DTRT13-G-UTC37 and MoDOT Project TR201501
12. Sponsoring Organization Name and Address 13. Type of Report and Period Covered
Midwest Transportation Center 2711 S. Loop Drive, Suite 4700 Ames, IA 50010-8664
Missouri Department of Transportation Construction and Materials Division Research Section
P.O. Box 270/1617 Missouri Blvd. Jefferson City, MO 65102
U.S. Department of Transportation Office of the Assistant Secretary for Research and Technology 1200 New Jersey Avenue, SE Washington, DC 20590
Final Report
14. Sponsoring Agency Code
15. Supplementary Notes
Visit http://www.intrans.iastate.edu/ for color pdfs of this and other research reports. This report is available at
http://www.intrans.iastate.edu/mtc/index.cfm/research/project/project/-1928248927. MoDOT research reports are available in the Innovation Library at http://www.modot.org/services/or/byDate.htm. This report is also available at
http://library.modot.mo.gov/RDT/reports/TR201501/cmr16-015.pdf.
16. Abstract
Striping operations generate a significant workload for MoDOT maintenance operations. The requirement for each striping crew to replenish its stock of paint and other consumable items from a bulk storage facility, along with the necessity to make several passes on most of the routes to stripe all the lines on that road, introduce the potential for inefficiencies in the form of “deadhead miles” that striping crew vehicles must travel while not actively applying pavement markings. These inefficiencies generate unnecessary travel, wasted time, and vehicle wear.
This report updates a 2015 report that developed a decision support tool for scheduling and routing road striping operations. The updates presented in this report improve the optimization model, and generate more user-friendly outputs.
17. Key Words 18. Distribution Statement
decision support tools—fleet operations—highway maintenance—striping operations—optimization models—geographic information systems
No restrictions
19. Security Classification (of this report)
20. Security Classification (of this page)
21. No. of Pages 22. Price
Unclassified Unclassified 41 NA
I
MPROVING
S
TRIPING
O
PERATIONS
THROUGH
S
YSTEM
O
PTIMIZATION
–
P
HASE
2
Final Report July 2016
Principal Investigator
Ronald G. McGarvey, Assistant Professor University of Missouri
Co-Principal Investigators
Timothy Matisziw, Associate Professor
Charles Nemmers, Program Director, Transportation Infrastructure Center University of Missouri
Research Assistants
Gokhan Karakose and Christopher Krause
Authors
Ronald G. McGarvey, Timothy Matisziw, James Noble, Charles Nemmers, Gokhan Karakose, and Christopher Krause
Sponsored by
the Missouri Department of Transportation, the Midwest Transportation Center, and
the U.S. Department of Transportation
Office of the Assistant Secretary for Research and Technology A report from
Institute for Transportation Iowa State University
2711 South Loop Drive, Suite 4700 Ames, IA 50010-8664
Phone: 515-294-8103 / Fax: 515-294-0467
TABLE OF CONTENTS
ACKNOWLEDGMENTS ... vii
1. INTRODUCTION ...1
1.1 MoDOT Operations ...1
2. MODEL MODIFICATIONS ...3
2.1 Limiting Vehicle Turnaround Locations ...7
3. GENETIC ALGORITHM MODEL ...8
3.1 Installation Process of Required Programs and Libraries ...8
3.2 Using the Decision Support Tool Interface ...16
4. CONCLUSIONS...32
vi
LIST OF FIGURES
Figure 2.1 – Extract from MODOTRoads.xlsx ...4
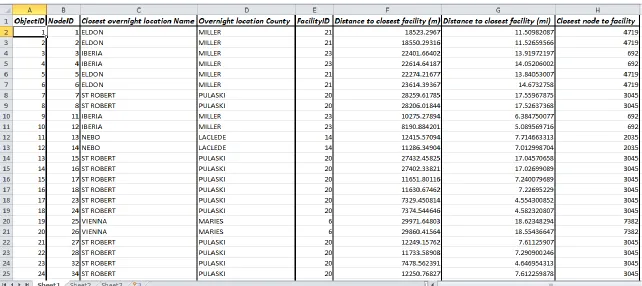
Figure 2.2 – Extract from OvernightLocationDistances.xlsx ...6
Figure 2.3 – Example of turnaround logic ...7
Figure 3.1 – Adding Python 2.7 to the path variable ...9
Figure 3.2 – Adding MoDOT model to the path variable...10
Figure 3.3 – Installing setuptools library ...11
Figure 3.4 – Downloading PIL library ...11
Figure 3.5 – Installing networkx ...11
Figure 3.6 – Installing openpyxl ...11
Figure 3.7– Downloading xlrd for pypy ...12
Figure 3.8 – Installing xlrd for pypy ...13
Figure 3.9 – Downloading networkx for pypy...13
Figure 3.10 – Installing networkx for pypy ...14
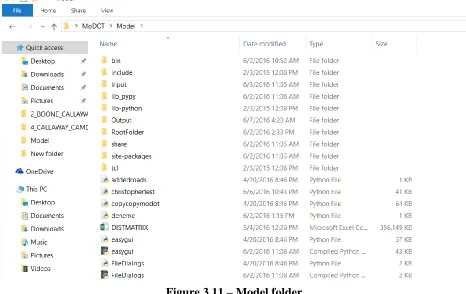
Figure 3.11 – Model folder ...15
Figure 3.12 – User interface...16
Figure 3.13 – Adding new road segments ...17
Figure 3.14 – Saving new road segments ...17
Figure 3.15 – Confirming network connectivity after adding new road segments ...18
Figure 3.16 – Calculating shortest distances table ...19
Figure 3.17 – Input Data section ...19
Figure 3.18 – Selecting counties for striping scheduling ...20
Figure 3.19 – Selecting initial location of striping crew ...20
Figure 3.20 – Selecting road types for striping scheduling ...21
Figure 3.21 – Selecting maximum-allowable computational time ...21
Figure 3.22 – Running the model ...22
Figure 3.23 – Selecting the road network ...22
Figure 3.24 – Selecting distance table for overnighting locations ...23
Figure 3.25 – Selecting the distance table ...23
Figure 3.26 – Display when model has finished running ...24
Figure 3.27 – Opening the model output ...25
Figure 3.28 – Weekly overview map ...26
Figure 3.29 – Daily overview map ...27
Figure 3.30 – Start-of-day map ...28
Figure 3.31 – Turn-by-turn directions map...29
Figure 3.32 – Performing what-if analyses ...30
ACKNOWLEDGMENTS
The authors would like to thank the Missouri Department of Transportation (MoDOT), the Midwest Transportation Center at Iowa State University, and the U.S. Department of
1. INTRODUCTION
1.1 MoDOT Operations
The Missouri Department of Transportation (MoDOT) is responsible for maintaining nearly 34,000 miles of highways and over 10,000 bridges; as a result, Missouri maintains “the nation’s seventh largest state highway system” with more miles than the combined systems of Iowa, Nebraska, and Kansas (MoDOT 2015). The annual cost to keep Missouri’s transportation system in its current condition (including road maintenance, striping, snow removal, mowing, etc.) is estimated to be $485 million (MoDOT 2015). One of the annual maintenance activities conducted by MoDOT is road striping, which involves the application of markings (primarily paint) to define lanes and other pieces of traffic-related information. According to Montebello and Schroeder (2000), most variations of paint used during striping operations have an estimated life between 9 and 36 months with variation largely dependent on traffic volume. Each year, MoDOT stripes more than 60,000 lane-miles of road on a scheduled basis. Additionally, citizens may place a request for a certain road to receive striping earlier than originally planned; such requests are generally given a high priority, with MoDOT attempting to complete the striping within a few days’ time.
Striping operations provide important information while allowing minimal diversion of attention from the roadway. Striping operations include the following:
Obliteration of pavement markings (removing existing or temporary pavement marking, which is conflicting or might mislead traffic)
Application of permanent pavement markings after construction or maintenance of roads
Removal of permanent marking
Line-striping for all major and minor roads that require it
Symbol markings, turn markings, etc.
Management of striped lines (keeping track of lines conditions, identifying which road segments will be striped each year, etc.)
For MoDOT, coordinating a plan to accommodate the striping of both major and minor
highways on an annual basis represents a significant logistical challenge. Increasing efficiency in striping operations represents a substantial opportunity to decrease annual expenses by MoDOT. Inefficient scheduling can create an excess of “deadhead miles” in which striping crews must travel while not actively striping roads. Minimizing deadhead miles is an important aspect of reducing the waste of extraneous travel, time, and vehicle wear.
2
This report addresses the scheduling of striping operations for a subset of MoDOT roads;
namely, those located in the Central District of Missouri. This report extends the work detailed in the 2015 report Improving Striping Operations through System Optimization (McGarvey et al. 2015). Three major changes have been made to the optimization model and decision support tool developed in the 2015 report:
The model has been modified to limit the locations where striping crews can turn around to be at either intersections with other MoDOT roads or at dead ends to MoDOT roads. This prevents the model from identifying a solution that requires a striping crew to turn around in the middle of a road (which was possible with the initial optimization model).
The model has been modified to add an additional what-if capability, allowing MoDOT to identify the impact of changing policies and removing the white edge line requirement for two-lane minor roads.
The model outputs have been modified, replacing the text-only outputs that were generated by the previous model with output visualization, including maps and turn-by-turn directions for striping crews.
2. MODEL MODIFICATIONS
To the best of our knowledge, the model presented in McGarvey et al. (2015) is the only optimization model that has been developed for scheduling road striping operations. A
significant amount of work is necessary to prepare the necessary input files for the model. This 2015 report contains a detailed discussion of how ArcGIS data can be prepared and integrated with MoDOT spreadsheet files, which identify the set of roads in each county that require striping in any year, to generate two spreadsheets that are needed to utilize the decision support tool.
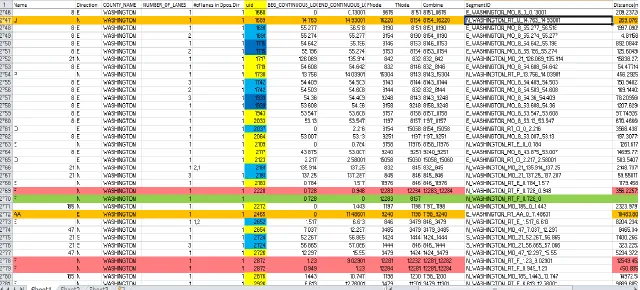
Due to concerns regarding lane width or road quality, MoDOT restricts travel by striping crews to roads on which the safe travel of striping vehicles can be ensured. With one rare exception (discussed below), our model considers only those segments for which general maintenance is the responsibility of MoDOT. The first spreadsheet (MODOTRoads.xlsx) contains details on the road network to be analyzed; an extract from this spreadsheet is presented in Figure 2.1.
The color shading in this spreadsheet can be interpreted as follows:
Blue/dark blue identifies “difficult” segments that require a different number of passes in each direction.
Orange identifies two-lane undivided roads with centerline only (receive only one pass).
Pink identifies a segment that was disconnected from the road network.
4
6
[image:18.792.75.717.69.355.2]
2.1 Limiting Vehicle Turnaround Locations
Our decision support tool uses a genetic algorithm (GA) to optimize the schedule of striping operations, thus determining the sequence of road segments to be striped (including the direction of travel) in order to minimize total deadhead miles traveled. These deadhead miles include travel between segments to be striped (when necessary), along with travel to and from an allowed vehicle overnighting location at the beginning and end of each work day. The computation logic underlying this GA optimization model was presented in an earlier report (McGarvey et al. 2015).
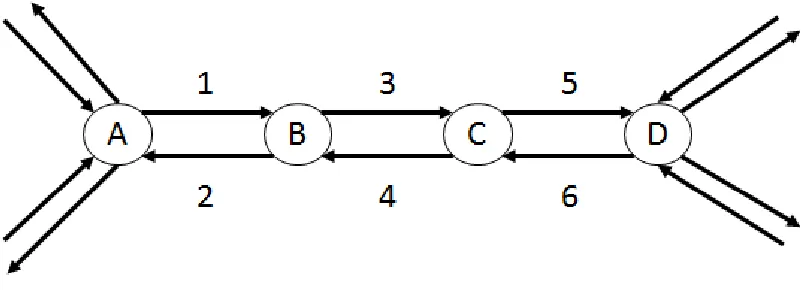
[image:19.612.104.508.319.464.2]The primary change that has been made to the model logic, as presented in this earlier report, was a modification to limit the locations where striping crews can turn around to be at either intersections with other MoDOT roads or at dead ends to MoDOT roads. This prevents the model from identifying a solution that requires a striping crew to turn around in the middle of a road (which was possible with the initial optimization model delivered in 2015). Consider the example presented below in Figure 2.3.
Figure 2.3 – Example of turnaround logic
Suppose that the striping crew is currently at node A. Road segments 1, 3, and 5 each need to be striped two times while road segments 2, 4, and 6 each need to be striped one time.
By observation, it is obvious that the minimum deadhead solution is to travel road segments 1-3-5-6-4-2-1-3-5, with no deadhead travel required. However, in the previous version of our
optimization model, a feasible solution would be to travel road segments 1-2-1-3-4-3-5-6-5. Note that this solution also requires no deadheading and performs all required striping.
8
3. GENETIC ALGORITHM MODEL
While problems such as scheduling striping operations can be formulated without much difficulty, determining an optimal solution is difficult (do Rosário Moreira and Ferreira 2010). Thus, most practical solution techniques make use of heuristic procedures such as genetic algorithms.
3.1 Installation Process of Required Programs and Libraries
First, the user needs to extract the files in MoDOT.7z to the desktop
10
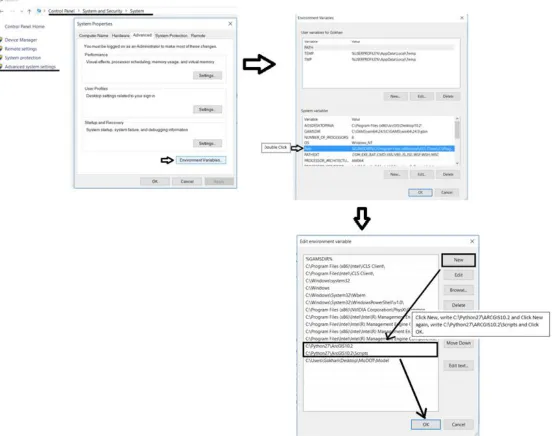
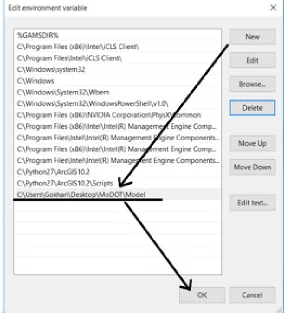
Now, do the same process for pypy. Namely, add pypy to the path variable as follows: Control Panel–System and Security–System–Advanced System Setting–Environment Variables–Path (similar to the process shown in Figure 3.1 above). Write where you save the MoDOT file as a Variable value. As we saved it to the desktop, we need to write
[image:22.612.164.451.175.488.2]C:\Users\username\Desktop\MoDOT\Model as seen in Figure 3.2. Adding it to the path is shown below.
Figure 3.2 – Adding MoDOT model to the path variable
We have installed the required programs. Now, we need to install the Python libraries. First, we will download setuptools from the following website:
https://pypi.python.org/pypi/setuptools/0.6c11.
Figure 3.3 – Installing setuptools library
Now, download PIL from http://www.pythonware.com/products/pil/ using setup’s default
[image:23.612.113.502.312.407.2]setting. The version is Python Imaging Library 1.1.7 for Python 2.7 (Windows only) as shown in Figure 3.4.
Figure 3.4 – Downloading PIL library
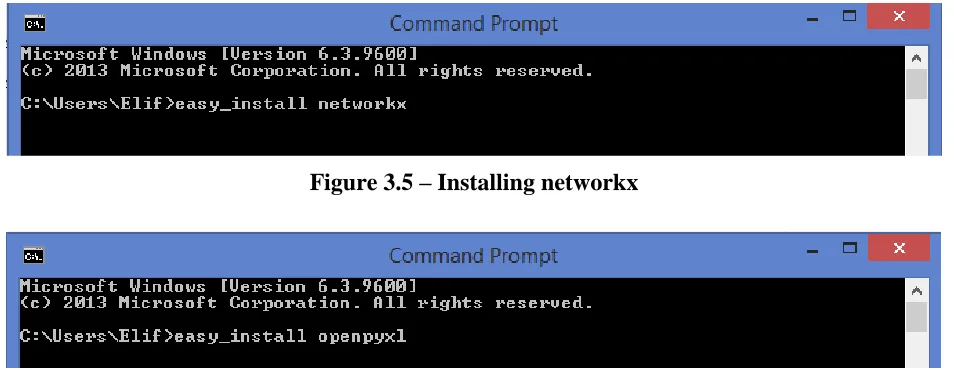
[image:23.612.69.546.513.698.2]Now, we can easily install other Python libraries by using the easy_install tool in the setuptools that we installed previously. This tool automatically downloads the appropriate version of the selected libraries for Python from the internet. Open a command line window and install the following libraries: networkx (Figure 3.5) and openpyxl (Figure 3.6).
12
For pypy, we need to install xlrd and networkx, but the installation process of this library to pypy is different from the installation to Python.
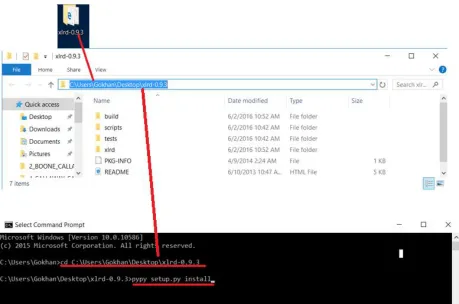
First, download xlrd from the following website: https://pypi.python.org/pypi/xlrd/0.9.3.
If you do not have WinRAR on your computer, you will also need to install the application WinRAR x86 (32 bit) 5.4 beta 2 in order to extract the files; this application can be downloaded from the following website: http://www.rarlab.com/download.htm.
[image:24.612.70.540.240.431.2]Details for downloading xlrd for pypy are included in Figure 3.7.
Figure 3.7– Downloading xlrd for pypy
Figure 3.8 – Installing xlrd for pypy
After installation is completed, both the zipped and unzipped xlrd files can be deleted from the desktop.
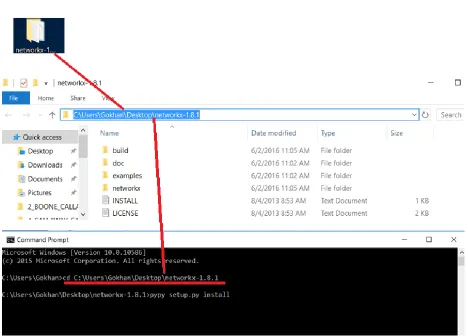
Now, download networkx to the pypy (see Figure 3.9) from the following website:
http://pkgs.fedoraproject.org/repo/pkgs/python-networkx/networkx-1.8.1.tar.gz/b4a9e68ecd1b0164446ee432d2e20bd0/.
Figure 3.9 – Downloading networkx for pypy
As we did for xlrd, open a command line window again and change the directory to reflect where you unzipped file networkx. Now, write pypy setup.py install and click enter. Details for
14
Figure 3.10 – Installing networkx for pypy
16
3.2 Using the Decision Support Tool Interface
[image:28.612.134.482.136.500.2]Double-click UserMODOT.py to open the user interface, as shown in Figure 3.12.
Figure 3.12 – User interface
3.2.1 Adding Arcs to the Network
This section may be skipped unless the user wishes to modify the underlying network by adding new road segments. By adding new road segments, we are referring to adding a new arc over which travel may occur and not simply changing the set of arcs that require (or don’t require) striping.
Figure 3.13 – Adding new road segments
Start by adding the necessary input information for the new road segment. After adding new roads, we need to make sure that the file is saved by using the button SAVE NEW EXCEL FILE. It adds the date to the name of the MODOTRoads file. For example, if the initial file name is MODOTRoads.xlsx, if you add new roads to the network the new Excel file will have a timestamp appended to the end of the file name, as shown in Figure 3.14.
Figure 3.14 – Saving new road segments
After this process, we have to make sure that we have a fully connected network again. In other words, we do not want to have a cut in the network. Therefore, the button CHECK
[image:29.612.76.523.371.527.2]18
Figure 3.15 – Confirming network connectivity after adding new road segments
Select Excel file
It creates new distance file:
Figure 3.16 – Calculating shortest distances table
3.2.2 Preparing the Model to Run
[image:31.612.108.486.69.327.2]Next, consider the Input Data section shown in Figure 3.17.
Figure 3.17 – Input Data section
20
[image:32.612.72.534.78.300.2]
Figure 3.18 – Selecting counties for striping scheduling
Second, select the starting maintenance building where the striping vehicle is parked for the beginning of the striping operations to be scheduled (see Figure 3.19).
Figure 3.19 – Selecting initial location of striping crew
Figure 3.20 – Selecting road types for striping scheduling
Finally, enter the maximum-allowable computational time (in minutes) (see Figure 3.21).
Figure 3.21 – Selecting maximum-allowable computational time
Note that computational time does not include the model’s data preparation and initialization time, nor the time required to generate output maps. It counts only the time spent by the
22 3.2.3 Running the Model
[image:34.612.119.502.133.293.2]Now, we can run the model by clicking on the RUN ALGORITHM button (see Figure 3.22).
Figure 3.22 – Running the model
We first need to select which road network we want to analyze (typically MODOTRoads.xlsx) (see Figure 3.23).
Figure 3.23 – Selecting the road network
[image:34.612.137.477.365.610.2]Figure 3.24 – Selecting distance table for overnighting locations
Finally, we need to select the distance table corresponding to our road network (typically DISTMATRIX.csv) (see Figure 3.25).
[image:35.612.127.488.400.656.2]24
[image:36.612.75.542.154.352.2]The model now runs, determining an ordered schedule (i.e., a sequence) of road segments to be striped that minimizes the total deadhead miles traveled. When the model has finished running, the PYTHON.EXE window will display the following: Weekly overview created (see Figure 3.26).
Figure 3.26 – Display when model has finished running
We can now find the output in the Output folder. The model generates three types of output files:
A text file, containing the sequence of segments to be striped
A weekly overview file that contains an ArcGIS map image of all travel to be performed by the striping crew during that week
As shown in Figure 3.27, the text output file presents overall statistics on the total striping days, total striping time, and the model run’s computational time. Then, for each day, the output lists the maintenance building where the day’s operations began, and the order in which segments should be striped for that day. Segments are identified as Direction_Highway ID_County Name_starting log mile_stopping log mile; for example, S_63C_BOONE_0.468_0.66.
Figure 3.27 – Opening the model output
The weekly overview file presents a map of all striping crew travel (both striping and
26
Figure 3.28 – Weekly overview map
The daily overview file contains three separate types of maps. First, as shown in Figure 3.29, a daily overview ArcGIS map showing all striping activity to be performed on that day, with green segments denoting segments to be striped, red segments denoting segments requiring
Figure 3.29 – Daily overview map
The second type of map contained in the daily overview file are maps showing the start-of-day and end-of-day deadheading. Figure 3.30 presents such a start-of-day map. Turn-by-turn
28
Figure 3.30 – Start-of-day map
Note that Figure 3.30 shows start-of-day deadheading for this example. The end-of-day map is not shown, but follows an identical format (showing travel between the last striped segment and the day’s ending overnighting location).
Figure 3.31 – Turn-by-turn directions map
3.2.4 Performing What-if Analysis
30
Figure 3.32 – Performing what-if analyses
Based upon discussions with MoDOT staff, one new what-if analyses that was of interest included potentially removing the edge line striping requirement for two-lane undirected road segments. These segments would receive a centerline stripe only. Because the striper can paint two lines at one time, when edge lines are included on such road segments, two passes of the striping equipment are necessary (one in each direction) to stripe the road segment. By removing the edge line striping requirement, only one pass of the striping equipment is necessary, reducing the total miles that need to be traveled by the striping crew.
Figure 3.33 – Identification of segments that have centerline only
When the user selects YES from the WHAT IF-REMOVE EDGELINE STRIPING window, all two-lane undirected road segments have the edge line striping requirement removed. The user can then run the model and see how the total striping days and total distance traveled are changed in the new solution. Note that the user would need to have saved the outputs from an identical run in which the edge line striping requirement was not removed in order to determine the extent of the savings achieved.
32
4. CONCLUSIONS
Road line striping operations generate a significant workload for MoDOT. The requirement for each road striping crew to replenish its stock of paint and other consumable items from a bulk storage facility, and the possible requirement of traveling unrequired roads to reach the roads that need striping, generate the potential for inefficiencies in the form of “deadhead miles” that road striping crew vehicles must travel while not actively applying pavement markings.
In an earlier report (McGarvey et al. 2015), we developed an optimization-based decision support tool, which implements genetic algorithm techniques to identify a minimum-distance striping schedule that satisfies the requirements of MoDOT striping operations. The research presented in this updated report describes our improvements to the model, limiting locations at which striping crews can turn around, adding new what-if capabilities to the model, and
improving the model outputs, replacing the text-only outputs that were generated by the previous model with output visualization, including maps and turn-by-turn directions for striping crews.
Despite the fact that some factors remain unrepresented in the model (e.g., highway ramps requiring striping), the current results of our model can be used to help MoDOT more quickly calculate a striping schedule and dynamically respond to unexpected conditions such as schedule disruptions that occur due to weather or construction delays like chip seal operations not
completed on the scheduled date. While MoDOT does not have records from which a comparison between the current and proposed system can be evaluated, the advantage of the genetic algorithm is apparent in the alleviation in time and effort dedicated to manually developing a striping schedule. Assuming MoDOT is able to manually calculate an optimal striping schedule to minimize the total distance traveled, the task still represents an exceedingly lengthy and laborious one. As such, this model provides an ability to significantly reduce the effort necessary to produce said striping schedule as well as test what-if scenarios examining the impact of changing resource levels, policies, etc.
REFERENCES
Eiselt, H. A., Gendreau, M., and Laporte, G. (1995). Arc routing problems, part I: The chinese postman problem. Operations Research, 43(2), 231-242. Retrieved from
http://www.jstor.org.proxy.mul.missouri.edu/stable/171832 .
McGarvey, R. G., Matisziw, T., Nemmers, C., Noble, J., Karakose, G., Materikina, M., and Page, A. (2015). Improving Striping Operations through System Optimization, Midwest Transportation Center, Institute for Transportation, Iowa State University, Ames, IA. Missouri Department of Transportation. (2015). Meet MoDOT. Retrieved from
http://www.modot.org/newsandinfo/documents/MeetMoDOT.pdf
Montebello, D., and Schroeder, J. (2000). Cost of pavement marking materials. Minnesota Local Road Research Board Synthesis Report, 2000-11. Retrieved from
http://www.lrrb.org/media/reports/200011.pdf
Monroy-Licht, I. M., Amaya, C. A., and Langevin, A. (2013). The rural postman problem with time windows. Centre interuniversitaire de recherche sur les reseaux d’entreprise, la logistique et le transport (CIRRELT), 2013-69. Retrieved from
https://www.cirrelt.ca/DocumentsTravail/CIRRELT-2013-69.pdf
do Rosário Moreira, M., and Ferreira, J.S.(2010). A Genetic Algorithm for the Undirected Rural Postman Problem. Technical Report, Instituto de Engenharia de Sistemas e de