LEABHARLANN CHOLAISTE NA TRIONOIDE, BAILE ATHA CLIATH TRINITY COLLEGE LIBRARY DUBLIN OUscoil Atha Cliath The University of Dublin
Terms and Conditions of Use of Digitised Theses from Trinity College Library Dublin
Copyright statement
All material supplied by Trinity College Library is protected by copyright (under the Copyright and Related Rights Act, 2000 as amended) and other relevant Intellectual Property Rights. By accessing and using a Digitised Thesis from Trinity College Library you acknowledge that all Intellectual Property Rights in any Works supplied are the sole and exclusive property of the copyright and/or other I PR holder. Specific copyright holders may not be explicitly identified. Use of materials from other sources within a thesis should not be construed as a claim over them.
A non-exclusive, non-transferable licence is hereby granted to those using or reproducing, in whole or in part, the material for valid purposes, providing the copyright owners are acknowledged using the normal conventions. Where specific permission to use material is required, this is identified and such permission must be sought from the copyright holder or agency cited.
Liability statement
By using a Digitised Thesis, I accept that Trinity College Dublin bears no legal responsibility for the accuracy, legality or comprehensiveness of materials contained within the thesis, and that Trinity College Dublin accepts no liability for indirect, consequential, or incidental, damages or losses arising from use of the thesis for whatever reason. Information located in a thesis may be subject to specific use constraints, details of which may not be explicitly described. It is the responsibility of potential and actual users to be aware of such constraints and to abide by them. By making use of material from a digitised thesis, you accept these copyright and disclaimer provisions. Where it is brought to the attention of Trinity College Library that there may be a breach of copyright or other restraint, it is the policy to withdraw or take down access to a thesis while the issue is being resolved.
Access Agreement
By using a Digitised Thesis from Trinity College Library you are bound by the following Terms & Conditions. Please read them carefully.
De p a r t m e n t o f E l e c t r o n i c a n d El e c t r i c a l En g i n e e r i n g
M icro p h o n e A rray P r o c e ssin g
T ech n iq u es for C la ssr o o m -B a sed
V id e o c o n fe r e n c in g
D e n is L. M c C a r th y
Subm itted for the degree of P h.D
January 2008
TRINITY C O LLE G E ^
0 8 APR 2008
Firstly, I wish to thank my supervisor Professor Frank Boland both for the op portunity to pursue a PhD and for his advice, wisdom and support throughout the course of my research. Prank, Pve truly enjoyed my years as a postgraduate and greatly appreciate all th a t you have done for me.
I would also like to thank Trinity College, Dublin and the Science Foundation of Ireland for their generous funding of this work.
Special mention should go to the staff and students in Trinity. In particular, I would like to thank Ami, Angela, Bernadette, Col, Conor, Damien, Darren, Deepti, Gavin, Robbie, Sean, and Shane for their help and friendship over th e years.
To Zoe, thank you for your love, kindness, patience and understanding. You kept me sane and happy and were the reason th a t, whatever else was going on, I always had something to look forward to.
I would like to thank my family for their love and support. I would also like to apologize for those multiple occasions on which all of you had to p u t up w ith my foul humour when things were not going well! To Orla, Aoibheann and Criona thank you.
Declaration
I, the undersigned, hereby declare th a t this thesis has not been subm itted as an exercise for a degree a t this or any other University and th a t it is entirely my own work. Furtherm ore, I agree th a t the Library may lend or copy this thesis upon request.
This thesis is concerned with the design and development of microphone-array-processing techniques for videoconferencing applications in classroom environments. We argue th a t, in such environm ents, it is advantageous in term s of both performance and prac tical im plem entation to use widely distributed arrays. A likely consequence of the use of such arrays is th a t the relative locations of the microphones will be unknown, however, most previously published microphone-array-processing techniques assume and require knowledge of the microphone locations. We propose two novel algorithms which are designed for use with widely distributed arrays of unknown geometry.
The first of these is a Leaky-LMS-based m ethod for precise beamform er steering. Beamforming is a classical array-signal-processing technique for the suppression of noise and reverberation. Traditionally, a necessary preliminary step - known as steer ing - has been the application of delays for the tim e-alignm ent of the target-signal components in each microphone output. W hen using time-sampled data, estim ates of the appropriate delays are typically limited to being integer multiples of the sam pling period. Consequently, the source locations to which we may precisely steer are also limited to a num ber of discrete locations, leading to missteering and reduced beamformer performance.
In this thesis we show th a t a leaky, multichannel, least-m ean-squares algorithm may be used to achieve steering th at is both more accurate and less com putationally complex th an traditional methods. We provide the results of experim ents using both real and sim ulated d a ta which dem onstrate the efficacy of our approach in reverberant environments.
The second algorithm is a method for determ ining the distance between a sound source and the microphones in an array in reverberant environments. Following from the results of a series of experiments in real-room environments, we show th at, in a spatially averaged sense, reverberation levels observed in a room are constant. This provides the theoretical justification for our technique, which we dub the “Range- Finder” algorithm .
Summary
This thesis opens w ith an introduction in chapter 1. In chapter 2 we discuss sound propagation in rooms, outlining relevant theory and presenting th e results of experiments which investigate the variation of the D irect-to-Reverberant ratio (DRR) with distance from a sound source. These experiments were performed in real rooms. Our results show th a t, given an omni-directional source and receiver, the reverberation levels at any point in a room are independent of the source-microphone range and are instances of a norm ally-distributed random variable with a constant mean. Following from this result, we propose a new metric for describing th e reverberant characteristics of a room - the “D R R -at-lm ” . We define this metric and dem onstrate instances in which the D R R -at-lm gives a more accurate impression of relative reverberation levels than the more commonly used measure, the “reverberation tim e” .
In chapter 3, we introduce the fundamentals of array-signal-processing and define the notation and much of the terminology to be used throughout the thesis. We develop the concept of spatial sampling and explore its implications with reference to spatial aliasing, “sidelobe” levels and wavenumber-vector resolution. The effects of frequency, direction-of-arrival and array geometry are explored. The issues arising from discrete-time sampling are also addressed.
In chapter 4, we review the literature concerning techniques for enhancing the perceptual characteristics of recorded speech. S tarting with a review of conven tional beamforming techniques, we explore the topic of “adaptive” beamformers us ing the “constrained-optim ization” paradigm. We discuss the relationships between the popular “generalized-sidelobe-canceller” algorithm, its robust variants and the multichannel-W iener-Filter. We also review the literature concerning dereverbera tion techniques.
In chapter 5, we review the literature relating to m ethods for determ ining the location of a sound source. S tarting with a review of approaches to time-delay es tim ation, we discuss time-delay-estimate-based source-locahzation. Param etric and subspace-based methods are also reviewed.
In chapter 7, we present a technique for steering-vector estim ation based upon a leaky-LMS filter. This m ethod is suitable for practical implem entation in situations in which the array geometry is unknown. The steering-vector thus obtained may be used to time-align the target-signal components of the outputs of multiple microphones - a necessary preliminary step for beamforming. While LMS-based techniques have been previously applied to the problem of obtaining time-delay estim ates (from which a steering-vector may be determined), our approach calculates the steering-vector di rectly, w ithout a requirement for intermediate time-delay estimation. Furtherm ore, we analyse our m ethod under reverberant conditions. This is in contrast w ith previ ously published techniques which assume an anechoic environment. In discussion, we highlight how, in reverberant environments, the effective performance of our approach is dependent upon the selection of an appropriate step size and leakage coefficient.
We present the results of experiments using simulated and real recorded d ata th a t dem onstrate th a t the steering-vector obtained by our method achieves accurate beam former steering under reverberant conditions. Furtherm ore, we show th a t our approach to beamformer steering is, under certain conditions, both more accurate and less com putationally complex than traditional methods.
In chapter 8, we present a m ethod for determining the distance between a sound source and the microphones in an array - the "Range-Finder" technique. The theoret ical underpinning of the Range-Finder follows from our results in chapter 2 regarding reverberation levels in rooms. As with our technique for delay-vector estim ation, the Range-Finder method is suitable for application to arrays of unknown geometry. We show th a t the distribution of the range estimates returned by the Range-Finder is related to a Cauchy distribution which is itself a function of the relative positioning of the source and microphones. Based on our analysis, we discuss the conditions necessary for accurate range estim ation and, following from this, outline possible applications for the Range-Finder technique.
Using simulated and real-room recordings, we compare the performance of our m ethod with th a t of a modification of the classical Steered-Response-Power approach and a “naive” range estim ator, which assumes an anechoic environment. To the au th o r’s knowledge, the modified-Steered-Response-Power technique has not been presented elsewhere previously.
C o n ten ts
1 I n tr o d u c t io n 1
2 R o o m A c o u s t ic E n v ir o n m e n ts 5
2.1 In tro d u c tio n ... 5
2.2 Sound Propagation in R o o m s ... 5
2.2.1 Sound Energy D e n s ity ... 6
2.2.2 Wave P h enom ena... 6
2.3 R e v e rb era tio n ... 9
2.3.1 A Linear Time-Invariant Room M o d e l ... 10
2.3.2 The Room R e s p o n s e ... 10
2.3.3 Reverberation t i m e ... 13
2.3.4 D irect-to-Reverberant R a t io ... 15
2.4 N o ise ... 17
2.4.1 Ambient N o i s e ... 17
2.4.2 Feedback ... 18
2.4.3 Sensor/Quantization Noise ... 19
2.5 Perceptual Effects of Noise and Reverberation... 20
2.5.1 In te llig ib ility ... 20
2.5.2 Q u a h t y ... 22
2.6 D iscu ssio n ... 23
3 A r r a y -P r o c e s s in g T h e o r y 25 3.1 In tro d u c tio n ... 25
3.2 Spatiotem poral S ig n a ls... 25
3.2.1 Multidimensional Fourier T r a n s f o r m ... 26
3.3 Array Signal P r o c e s s in g ... 28
3.3.1 Spatial S a m p lin g ... 28
3.3.2 Spatial A liasin g ... 30
3.3.3 Wavenumber S m o o th in g ... 30
3.3.4 W e ig h tin g ... 32
3.3.5 Sparse A r r a y s ... 33
3.4 Filter-and-Sum Array Signal P r o c e s s in g ... 33
3.4.1 S te e r in g ... 36
3.4.2 Discrete-Time Sam pling... 36
3.4.3 Angular R esolution... 37
3.4.4 I n te r p o la ti o n ... 39
3.4.5 Steering in the Frequency D o m a i n ... 40
3.4.6 Non-Ideal Sensors ... 42
3.5 Signal M o d e l ... 43
3.5.1 Anechoic Signal M o d e l... 44
3.5.2 Reverberant Signal M o d e l... 45
3.5.3 Filter-and-Sum P rocessing... 45
3.5.4 The Spatiospectral Correlation M a t r i x ... 46
3.6 D isc u ssio n ... 46
4 S p e e c h -E n h a n c e m e n t T e c h n iq u e s 49 4.1 In tro d u c tio n ... 49
4.2 Delay-and-Sum B e a m fo rm in g ... 49
4.3 D ata-D ependant Signal Enhancement ... 51
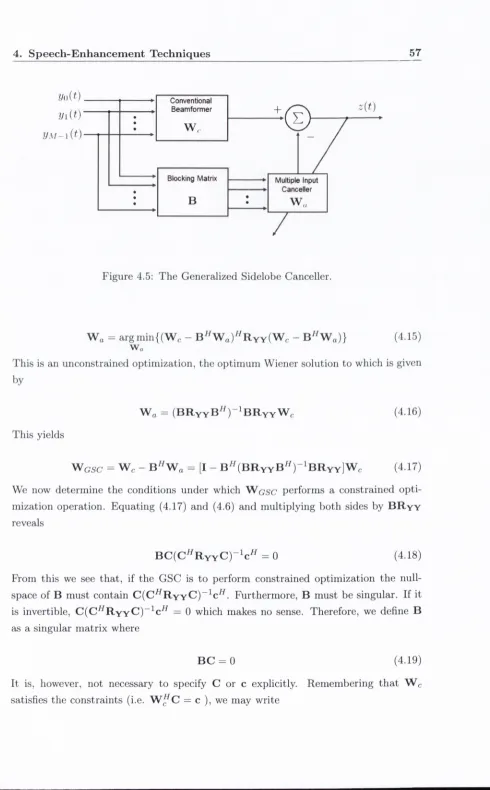
4.3.1 Constrained O p tim iz a tio n ... 51
4.3.2 Generalized Sidelobe C a n c e lle r ... 56
4.3.3 The M ultichannel Wiener Filter ... 62
4.3.4 Blind Source S e p a ra tio n ... 63
4.4 D ereverberatio n... 64
4.5 D isc u ssio n ... 65
5 T im e -D e la y E s tim a tio n a n d S o u rc e -L o c a liz a tio n 67 5.1 In tro d u c tio n ... 67
5.2 Time-Delay Estim ation T ech n iq u es... 68
5.2.1 C ross-C orrelation... 68
5.2.2 Generalized C ross-C orrelation... 68
5.2.3 Least-Mean-Squares M e th o d s ... 70
5.2.4 Adaptive Eigenvalue D e c o m p o sitio n ... 71
5.3 TDE-based Source L o c a liz atio n ... 73
5.3.1 Viete’s S o lu tio n ... 73
5.3.2 Direction-of-Arrival E s tim a tio n ... 75
5.3.3 Least-Square-Error Fitting ... 77
5.4 Param etric M e t h o d s ... 78
5.4.1 Maximum-Likehhood M e th o d ... 79
5.4.2 Steered Response Power T e c h n iq u e s ... 80
5.5 Subspace-Based T e c h n iq u e s ... 82
5.5.1 M U S I C ... 82
5.6 D iscu ssio n ... 83
6 C la s s ro o m -B a s e d V id e o c o n fe re n c in g : A P r o b le m O v e rv ie w 85 6.1 In tro d u c tio n ... 85
6.2 A Typical Videoconferencing S e tu p ... 86
6.2.1 The Far-Field A ssum ption... 86
6.2.2 Known Array G e o m e tr y ... 87
6.2.3 D isadvantages... 87
C O N T E N T S iii
6.3.1 S te e r in g ... 90
6.3.2 Source-Microphone Range E s t i m a t i o n ... 93
7 A L e a k y -L M S -B a s e d M e th o d for P r e c is e B e a m fo r m e r S te e r in g 95 7.1 In tro d u c tio n ... 95
7.2 Leaky-LMS-Based Beamformer S t e e r i n g ... 95
7.2.1 U pdating the W e ig h tv e c to r... 96
7.2.2 Decomposing the Wiener S o lu tio n ... 98
7.2.3 Flattening the Filter R esp o n se s... 98
7.2.4 Im p lem en tatio n ... 99
7.2.5 Param eter S e le c tio n ... 100
7.3 Simulations and E x p e rim e n ts ... 101
7.3.1 S im u la tio n s ... 101
7.3.2 Real-Room E x p e rim en ts... 107
7.4 Com putational C o m p le x ity ... 109
7.5 D isc u ssio n ... 113
8 R a n g e E s tim a tio n 115 8.1 In tro d u c tio n ... 115
8.2 Sound Propagation in Reverberant E n v iro n m e n ts... 115
8.3 Range E stim a tio n ... 117
8.3.1 A Naive Range E s tim a to r ... 117
8.3.2 The Steered-Response-Power Range E s t i m a t o r ... 118
8.3.3 The Range-Finder A lg o r ith m ... 118
8.4 Estim ate Distribution and A c c u r a c y ... 120
8.4.1 An Alternative Formulation of the R a n g e - F in d e r ... 121
8.4.2 Cauchy D is tr ib u tio n ... 121
8.4.3 The Effect of Array Geometry ... 123
8.5 Simulations and E x p e rim e n ts ... 125
8.5.1 S im u la tio n s ... 125
8.5.2 Experiments ... 129
8.6 D iscu ssio n ... 130
9 C o n c lu s io n 135 9.1 S u m m a r y ... 135
9.2 Future w o r k ... 137
9.2.1 Leaky-LMS-Based S t e e r i n g ... 137
9.2.2 Range E stim ation... 137
9.3 Conclusion ... 138
A T h e M u ltic h a n n e l W ie n e r F ilte r 139
2.1 D iffraction: Waves “sp read ” after passing thro u g h a gap or around an obstacle, (im age sourced from http://w w w .g csescien ce.co m /p w av 3 7 .h tm ) 7 2.2 W ave reflection from sm ooth an d rough surfaces... 8 2.3 Sound abso rp tio n w ith respect to frequency for typical surface m aterials
in room s. Source: EA SE 4.0 m aterials d atab ase, [110]... 8 2.4 Interference: soundwaves generated by th e m onochrom atic sources SI
a n d S2 interfere constructively (red lines) an d destru ctiv ely (blue lines). N ote: for visual clarity, not all points a t which constru ctiv e and d estru c tiv e interference occur are show n... 9 2.5 A n im pulse response obtained in a classroom a t a distan ce of 3.5m from
th e source... 12 2.6 Im plem enting th e tra n sie n t decay m eth o d for determ in in g R T ^q. T he
recorded acoustic signal used to generate this figure is b an d lim ited in th e range 1 — 2 k H z... 14 2.7 A p h o to g rap h of th e experim ental setu p used to o b tain D R R s a t varying
distan ces from a sound source... 15 2.8 D ire ct-to -re v erb e ran t ratios versus log2(r), w here r is th e source-m icrophone
range. R esults shown are for an office, classroom an d reception hall. . 16 2.9 A full-duplex com m unication system and th e resulting “feedback loop” . 18 2.10 A coustic echo cancellation: An adaptive filter estim ates th e
loudspeaker-m icrophone response and su b tra c ts an estiloudspeaker-m ate of th e acoustic echo from the m icrophone o u tp u t... 19 3.1 A p lan ar, n o n -a tte n tu a tin g wave w ith direction of p ro p a g atio n 1?. / ( ^ , t),
th e wavefield a t "x , m ay be expressed in term s of / ( 0 , t ) , w here 0 is th e orig in ... 27 3.2 L inear arrays; A shows a 7-elem ent LEA; B-D are “sp arse” arrays. T he
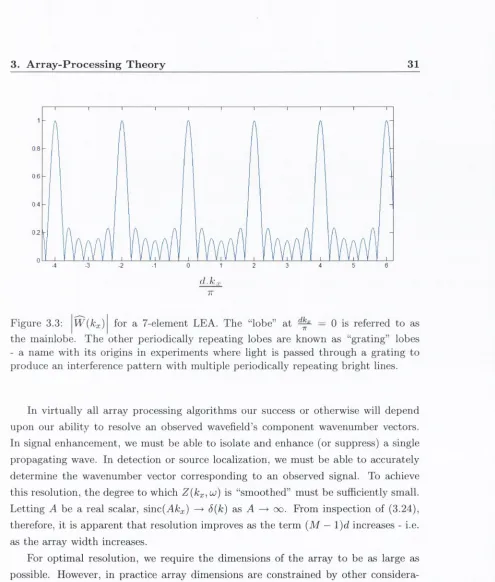
m inim um intersensor spacing is d... 30 3.3 W { k x ) for a 7-elem ent LEA. T he “lobe” a t ^ = 0 is referred to
as th e m ainlobe. T h e other periodically repeating lobes are known as “g ra tin g ” lobes - a nam e w ith its origins in experim ents where light is passed through a grating to produce an interference p a tte rn w ith m ultiple periodically repeating bright lines... 31 3.4 \ W{kx)\ for a 7-elem ent LEA corresponding to a “square” window func
LIST OF FIG U R E S V
3.5 W{kx) corresponding to the sparse array geometries in figure (3.2). Com pared to a 4-element LEA they achieve a narrower mainlobe a t the expense of larger sidelobes... 34 3.6 Filter and Sum: Sensor outputs undergo tem poral filtering before being
combined... 35 3.7 A planar wave propagating across a LEA. The angle of incidence, 0, is
commonly referred to as the direction of arrival of the wave... 37 3.8 Steerable angles for a LEA where d = 0.2m, and c = 340m s“ ^. Increas
ing the sam pling rate (reducing T) increases the density of the steerable angles... 38
4.1 \ W(w, 9) I for a seven-element D&S beamformer: Wmi^^) = V m , w. d = 0.034m. The array gain has been normalized to give unity gain in the look direction... 51 4.2 |l4^(w,0)| for a seven-element D&S beamformer: m,u). d =
0.1m. The array gain has been normalized to give unity gain in the look direction... 52 4.3 The A rray P a tte rn for a MVDR beamform er... 54 4.4 \W{uj,9)\ for a seven-element superdirective beamformer: d = 0.034m.
The array gain has been normalized to give unity gain in the look direction. 55 4.5 The Generalized Sidelobe Canceller... 57 4.6 Leaky adaptive filters (LAFs) in the blocking m atrix of a GSC... 61 5.1 Time Delay Estim ation using the LMS algorithm ... 71 5.2 Source localization as an instance of Apollonius’ problem of tangent
circles... 74 5.3 The far-field assumption: For distant sound sources, the curvature of
the incident wavefront is neglibible... 75 5.4 The direction of arrival of a far-field sound source is a function of the
intersensor time delay... 76
6.1 A videoconferencing setup as typically found in the literature... 88 6.2 A videoconferencing setup using an array of distributed microphones. 89 6.3 A videoconferencing setup using an array of distributed sub-arrays. . . 91
7.1 A block diagram of an implementation of the leaky-LMS-based method for beamformer steering. The elements shown correspond to the process ing undergone by the output of m i. Identical processing is applied to the outputs of the remaining microphones... 99 7.2 The sim ulated room and loudspeaker-microphone setup... 102 7.3 A comparisBon of the white noise gain achieved for varying DOAs. . . 103 7.4 A comparisson of the directivity index achieved for varying DOAs. . . 103 7.5 A comparison of the W hite Noise Gain achieved under reverberant con
ditions... 104 7.6 A comparison of the Directivity Index achieved under reverberant con
7.7 A com parison of th e W h ite Noise G ain achieved by th e Self-Steering beam form er u n d er different D R R s... 106 7.8 A com parison of th e D irectivity Index achieved by th e Self-Steering
beam form er u n d er different D R R s... 106 7.9 W N G over tim e for varying frequencies, a = 0 . 0 2 . 108 7.10 W N G over tim e for varying frequencies, a = 0 . 0 1 . 108 7.11 W N G over tim e for varying frequencies, a = 0.002 . 109 7.12 T h e array p a tte rn s corresponding to the self-steering beam form er, ob
ta in e d from real-room recordings... 110 8.1 P o rtio n s of th e P D F s of Also shown is ^ (dashed lin e)... 122 8.2 versus tq for [ c t i , c t2] = [Im , Sm]. R ange estim ate error increases
w ith ro ... 124 8.3 ^ respect to ^ and ^ ... 124 8.4 A diagram of th e sim ulated room and setup. For precise coordinates of
th e m icrophones an d loudspeakers, see Table 1... 126 8.5 R ange estim ates ± one stan d ard deviation, o b tain ed using th e Range-
F inder, N aive and SR P-based m ethods, for source 2... 128 8.6 R ange estim ates ± one stan d ard deviation, o b tain ed using th e Range-
F in d er and SR P -based m ethods, for source 1... 129 8.7 R ange estim ates ± one sta n d a rd deviation, o b tain ed using th e Range-
F in d er and SR P -based m ethods, for source 3 ... 130 8.8 R ange estim ates ± one stan d ard deviation, o b tain ed using th e Range-
F inder, N aive and SR P-based m ethods, using real recordings of a m axim um - length sequence... 131 8.9 R ange estim ates ± one sta n d a rd deviation, ob tain ed using th e Range-
List o f Tables
7.1 Integer multiples of the Nyquist sampling rate for which the proposed leaky-LMS-based steering approach is less com putationaly complex than steering with time-delays determined using the PHAT-GCC m ethod . 113
8.1 The coordinates of the microphone and source locations for the simu lated room. Coordinates are in m e t e r s ... 126
In trod u ction
Recent years have seen the rapid development of telecommunications technology both in term s of its advancing capabilities and in term s of its evolution towards near ubiquity in our day-to-day lives.
W hen communication technology has been its most successful, it has been when it has allowed us to interact with others across boundaries of distance, location and time. We are, perhaps, all familiar with the advantages and im pact of mobile (cellu lar) phones, text messages and E-mail. Emerging technologies promise an even more profound effect. Text-to-speech, speech-to-text and autom atic translation technologies have begun and will continue to break down the barriers of disability and language.
Some of the most exciting potential applications for telecommunications technology exist in the area of education. In this thesis, we shall be seeking to design and develop techniques th a t support and facilitate classroom-to-classroom videoconferencing.
The potential benefits of such technology are difficult to overstate. W hereas today students and educators are largely constrained by geography, in the future they could be able to interact w ith other students, lecturers, teachers, politicians and public personalities in ways th a t would enhance the quality and depth of their education. In particular, by interacting with their peers in other (perhaps distant) countries, students would broaden their experience and understanding of differing cultures and outlooks - something th a t is increasingly im portant in a shrinking world.
However, to be widely adopted, classroom-based videoconferencing must facilitate interactions th a t are natural and spontaneous, whilst at a practical level being cost- efficient, reliable and effective. In addition, we must be mindful of the fact th a t such videoconferencing systems will, in all likelihood, be set up by people (i.e. teachers) w ith minimal experience in audio and video technology. Therefore, any systems or equipm ent used should require only a minimum am ount of technical know-how for their use and maintenance. Consider the ideal. W ith no special effort on the p art of the
1. I n t r o d u c tio n 2
participants, a talker’s words are transm itted to the far-end classroom. Furtherm ore, the location of the active contributors is autom atically determined such th a t a cam era may be steered towards them. At the far-end they are heard clearly and intelligibly. In addition, the location information is used at the far-end so th a t a talk er’s speech is perceived to originate a t his/her on-screen location, thus m aintaining th e sense of presence th a t is vital for the naturalness of such interactions.
N atural and spontaneous interaction between participants will feature a certain amount of speech overlap (i.e. multiple participants talking at the same tim e). In order to facilitate this, our videoconferencing system must support “full-duplex” com m unication - i.e. the channels through which sound is transm itted from one classroom to the other must be open in each classroom at the same time. Unfortunately, when using full-duplex communication systems there exists the potential for a “feedback- loop” to become established. Sound is detected in one room and transm itted to a second where it is produced by loudspeakers. In the second room this sound is de tected by microphones and transm itted back to the first room, causing the talker to hear a delayed version of his/her own voice. This is known to be very off-putting for participants. Also, to provide the spatial audio cues required to achieve a sense of “telepresence” , each classroom must contain multiple loudspeakers. This creates multiple feedback-loops, exacerbating the problem.
Achieving ideal videoconferencing presents a number of other technical challenges. Among these, how to locate an active talker and how to faithfully capture his or her speech? This latter obstacle is most commonly overcome using head or lapel- mounted microphones. In many situations, however, purchasing and m aintaining such equipment, in quantities sufficient for a potentially large number of participants, is not cost-efficient. At the same time, sharing fewer microphones by, say, passing them around the room is not conducive to spontaneity or natural interaction.
We therefore require a system in which a moderate number of microphones would be sufficient to effectively capture speech from every potential contributor. However, in a classroom, audience members will be widely distributed and so we can expect a participant to be some distance (perhaps several meters) from a microphone. As we shall see, classrooms may be expected to be both noisy and reverberant (echoic) environments. By increasing the separation between talkers and microphones, we increase th e attenuation of a target speech signal (due to propagation losses) and thereby increase the relative power of noise and reverberation. This leads to a reduction in speech intelligibility and perceived quality.
Array-processing techniques have their origins in the Second World War, where radar and sonar processed th e outputs of multiple sensors to exploit the spatial as well as tem poral and spectral inform ation contained in the observed waves (electromagnetic and acoustic respectively). Using these techniques, the location and heading of enemy planes and subm arines etc. could be determined.
Using similar m ethods, the location of an active talker may be found using arrays of microphones. As we shall see, microphone arrays may also be used to enhance the perceived quality and intelligibility of recorded sound, by means of processing tech niques th a t atten u ate interference such as noise and reverberation while maintaining the target speech signal.
As shall become apparent from our review of the literature, previously published techniques are typically based upon the assum ptions/requirem ents th a t the micro phone array geom etry (th at is, the relative positions of each microphone) is fixed, known a priori and th a t the distance to the target talker is large with respect to the width or extent of th e array. In fact, these assumptions put us at significant practical disadvantage in situations, such as in classrooms, where it would be most advantageous to allow microphones to be moved according to the specific and changing requirements of the room or audience.
In this thesis we present two novel microphone-array-processing techniques which do not require knowledge of the array geometry and which may be applied when the target talker is close w ith respect to the array dimensions. The first of these is a method for estim ating th e distance between an active talker and multiple microphones at unknown locations. The second is a m ethod for “steering” - a necessary preliminary step for many speech enhancem ent algorithms.
Classroom-based videoconferencing is by no means the only application for such technologies. R ather, it represents one of th e most challenging scenarios th a t system designers are likely to encounter. Consequently, microphone-array-processing tech niques th a t are effective in a classroom are highly likely to be directly applicable to, for example, office-to-office videoconferencing, “hands-free” telecommunications or talker-identification for autom ated speech transcription. Therefore, while we shall con tinue to refer to the specific case of the classroom, the microphone-array-processing techniques proposed in this thesis will have applications in rooms and enclosed spaces in general.
1. In tr o d u ctio n 4
be discussed and the characteristics of these with particular implications for array processing shall be highlighted.
C hapter 2 shall conclude with a review of the literature concerning the effects of noise and reverberation upon the perceptual characteristics of speech. This shall confirm their adverse effects on speech intelligibility and quality, thus vindicating our requirement for noise/reverberation-suppression techniques.
In chapter 3, we will introduce the fundamentals of array-signal-processing and define the notation and much of the terminology to be used throughout the thesis. We shall develop the concept of spatial sampling and explore its im plications with reference to spatial aliasing, “sidelobe” levels and wavenurnber-vector resolution. The effects of frequency, direction-of-arrival and array geometry shall also be explored. Furtherm ore, the issues arising from discrete-time sampling shall be addressed.
In chapter 4, we review the literature concerning techniques for enhancing the perceptual characteristics of recorded speech. Starting with a review of conven tional beamforming techniques, we explore the topic of “adaptive” beam formers us ing the “constrained-optim ization” paradigm. We discuss the relationships between the popular “generalized-sidelobe-canceller” algorithm, its robust variants and the multichannel-W iener-Filter. We also review the literature concerning dereverberation techniques.
In chapter 5, we review the literature relating to methods for determ ining the location of a sound source. S tarting with a review of approaches to time-delay es tim ation, we discuss time-delay-estimate-based source-localization. P aram etric and subspace-based methods are also reviewed.
In chapter 6, the inadequacies of currently-available microphone-array techniques are outlined with respect to classroom-based videoconferencing. We shall address the advantages to be obtained via a widely-distributed, ad-hoc and unknown microphone deployment, while also outlining the additional problems such an array-configuration would pose. We thus define the scenario and applications for which the novel tech niques presented in this thesis are designed.
In chapter 7, we present a technique for delay-vector estim ation based upon a leaky-LMS filter. This method is suitable for practical im plem entation in situations in which the array geometry is unknown. We also present the results of simulations and experiments th a t dem onstrate the efficacy of this approach.
R o om A co u stic E nvironm ents
2.1
In tro d u ctio n
In the following chapter we discuss room acoustic environments and their influence on the success or otherwise of classroom-based videoconferencing. We start by investigat ing sound propagation in rooms and briefly discuss the effects of the so-called “wave phenomena” . The combined effects of these phenomena are jointly referred to as rever beration and we present the metrics used in this thesis to quantify the degree to which reverberation is present in a room or on a recording. Noise in rooms is also discussed and this is followed by a review of the literature concerned with the perceptual impact of noise and reverberation on listeners.
2.2
S ou n d P r o p a g a tio n in R o o m s
Sound waves are introduced to the medium (air) by vibrating objects, which cause the space between adjacent molecules to be compressed and expanded. The resulting disturbance travels from molecule to molecule transporting energy as it moves. Sound is a longitudinal wave - that is, its oscillations are parallel to the direction of travel.
At sea level in dry air, the speed of sound, c, may be approximately calculated as shown below, were Tc is the temperature in degrees Celsius.
c = (331.4 + O.erc) m s -i (2.1)
For indoor acoustic environments, we make the following assumptions. Firstly, we assume the medium to be homogenous with no significant density, temperature or pressure gradients. In addition we assume there to be no significant wind or air flow. Following from these, we therefore assume c to be known (corresponding to room temperature) and constant within the room.
2. R o o m A c o u s t ic E n v ir o n m e n ts 6
A full and rigorous analysis of soundwave propagation would be excessive in the context of this discussion. Nonetheless, we find it useful to briefly discuss the behavior of soundwaves with respect to their propagation in rooms.
2.2.1
Sound E nergy D en sity
As sound propagates through a medium the sound energy density (where sound energy density = ) reduces. This is primarily due to “geometric spreading” of sound energy as the distance between the source and the location at which the sound is detected increases. Assuming an omnidirectional point sound source, “direct-path” (i.e. non-reflected) soundwaves will propagate outwards forming an expanding sphere. Since energy is conserved, the sound energy density will be inversely proportional to the surface area of this sphere. This surface area may be given by 47rr^, where r is the radius of the sphere. Therefore we may write
sound energy density oc (2.2)
Molecular absorption (due to, for example, air viscosity) also contributes to the reduction in intensity of propagating soundwaves. However, molecular absorption reduces sound energy density by a factor th at is inversely proportional to the distance travelled, as opposed to the distance squared. In air, sound energy density losses due to molecular absorption are small and, over the short ranges typical of indoor environments, may be considered negligible in comparison with those of geometric spreading.
Note that, for simplicity, the term "sound intensity" shall be taken to mean the sound energy density in the sequel.
2.2 .2
W ave P h en o m en a
As a wave, sound will exhibit the classical wave behaviors of refraction, diffraction, interference and reflection. We briefly discuss each of these and their relevance to the indoor scenarios under investigation.
R e fr a c tio n
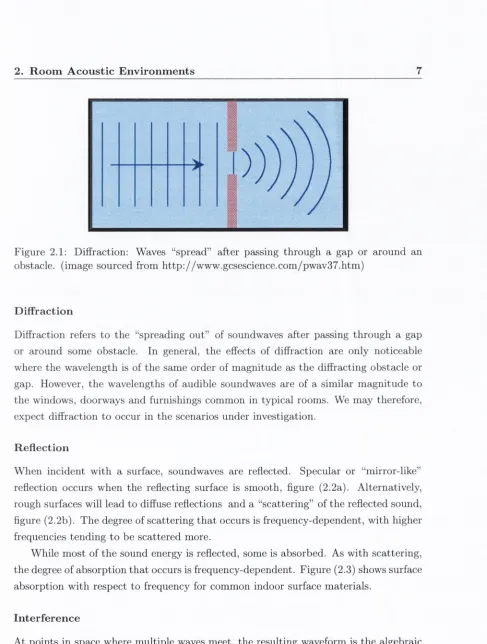
Figure 2.1: Diffraction: Waves “spread” after passing through a gap or around an obstacle, (image sourced from http://w w w .gcsescience.com /pw av37.htm )
D iffr a c tio n
Diffraction refers to the “spreading out” of soundwaves after passing through a gap or around some obstacle. In general, the effects of diffraction are only noticeable where the wavelength is of the same order of magnitude as th e diffracting obstacle or gap. However, the wavelengths of audible soundwaves are of a similar m agnitude to the windows, doorways and furnishings common in typical rooms. We may therefore, expect diffraction to occur in the scenarios under investigation.
R e fle c tio n
W hen incident with a surface, soundwaves are reflected. Specular or “mirror-like” reflection occurs when the reflecting surface is smooth, figure (2.2a). Alternatively, rough surfaces will lead to diffuse reflections and a “scattering” of the reflected sound, figure (2.2b). The degree of scattering th a t occurs is frequency-dependent, with higher frequencies tending to be scattered more.
While most of the sound energy is reflected, some is absorbed. As with scattering, the degree of absorption th a t occurs is frequency-dependent. Figure (2.3) shows surface absorption w ith respect to frequency for common indoor surface materials.
I n te r fe r e n c e
[image:22.534.36.523.26.670.2]2. R o o m A c o u stic E n v iro n m en ts 8
S p e c u la r R eflection
(a)
D iffuse R eflection
(b)
Figure 2.2; Wave reflection from smooth and rough surfaces.
A bsorption V alues 1
0 9
0,8
0 7 Heavy Carpet
0,6
0,5
“ W indow Glass
0 3
0,2
Clay Brick
0,1
0
125 Hz 250 Hz 500 Hz 1000 Hz 2000 Hz 4 0 0 0 Hz 8 0 0 0 Hz
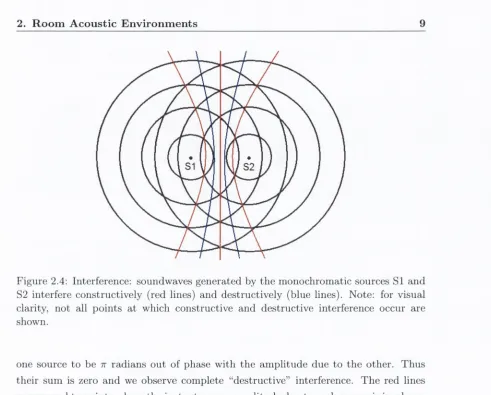
[image:23.534.16.522.44.739.2]Figure 2.4: Interference: soundwaves generated by the monochromatic sources SI and S2 interfere constructively (red lines) and destructively (blue lines). Note: for visual clarity, not all points a t which constructive and destructive interference occur are shown.
one source to be tt radians out of phase with the am plitude due to the other. Thus their sum is zero and we observe complete “destructive” interference. The red lines correspond to points where the instantaneous am plitude due to each source is in-phase, thus maximizing the am plitude of the resultant wave at those points. This is known as complete “constructive” interference. The remaining points in figure (2.4) would experience interference somewhere in between these two extremes.
In a reflective or “echoic” acoustic environment, multiple reflected copies of the source signal will meet at points throughout the room. However, for broadband signals, intensity variations due to interference are not perceptible as destructive interference at one frequency is com pensated for by constructive interference in another.
2.3
R e v e r b e ra tio n
[image:24.534.34.525.74.469.2]2. R oom A coustic Environm ents 10
2 .3 .1 A L inear T im e-In v a ria n t R o o m M o d e l
In the scenarios under investigation, a sound will be subject to source-directionality, whereby th e intensity of the direct-path soundwave is dependent upon th e orientation of the source relative to the location a t which the sound is detected. Furtherm ore, this directionality is frequency-dependent. In addition, the em itted soundwaves are subject to room effects such as reflections and diffraction etc. Finally, the microphone itself will apply a frequency-and-orientation-dependent gain to the acoustic signal. The source, room and microphone combined represent a “system” th a t filters a “clean” acoustic signal to produce a microphone output. We shall model this system as being linear and time-invariant.
We m ust, however, qualify our assumptions of linearity and time-invariance. Re garding linearity, we make the assumption th a t the soundwaves of interest have ampli tudes above the threshold of detection and below the saturation levels corresponding to the microphones being used to detect them. We also assume these microphones to have a linear response in this region. Regarding our assumption of time-invariance, a “room response” will, in practice, vary in tim e - often significantly so. Typical causes relate to changes in the room environment. Opening doors or windows and draw ing blinds or curtains will alter the room response. So too will moving furniture or, indeed, the microphones themselves. Perhaps most significantly, talkers engaged in natural conversation will alter the room response as they move their heads, gesture an d /o r walk around.
Nonetheless, as is done throughout the literature, we shall continue to make the simplifying assumption of time-invariance whilst highlighting those instances where doing so would cause us to draw false conclusions or obtain flawed results.
2 .3 .2 T h e R o o m R e sp o n se
Any linear, time-invariant (LTI) system may be wholly characterized by its impulse response (in the tim e domain) or transfer function (in the frequency domain). In a noiseless room environment, the acoustic signal observed at some point, y{t), may be expressed as the convolution of the source-microphone impulse response, h (t), and the
“clean” acoustic signal originating at the source, s {t).
x{ t ) = h (t) * s (t)
In the frequency domain
X{uj ) = H { u ) S { u j ) (2.4) = (Hdp {uj) + Hmp {ui))S ( u)
where H^p (w) and Hmp {ijj) denote the components of the frequency response corre sponding to direct-path propagation and room effects (i.e. “m ultipath” propagation) respectively. Treating the effects of molecular absorption as negligible compared to those of geometric spreading, we may consider the intensity of the direct-path compo nent of th e received sound to inversely proportional to the source-microphone range squared. Therefore we may write
\ H d p { o j f < x ^ (2.5)
from which we may determ ine th a t the direct-path component of received sound in tensity decreases by 6dB per doubling of r.
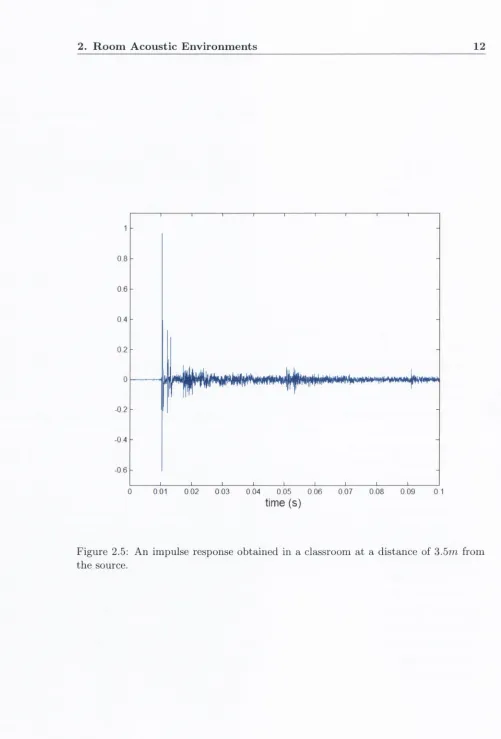
Figure (2.5) depicts a source-microphone impulse response, which was obtained in a classroom as follows. A microphone was placed directly in front of a loudspeaker at a distance of 3.5m. The loudspeaker produced a pseudorandom Maximum-Length- Sequence (MLS) of approxim ate duration 5.5s, a t a sampling rate of 48kHz . The o utput of the microphone was recorded, also at a sampling rate of 48kHz . This recording was then cross-correlated with the “clean” MLS to obtain an impulse re sponse estim ate.
The initial pulse in the impulse response is due to direct-path propagation from the source to the microphone and, as we would expect, corresponds to a scaled de lay. The rem ainder of the impulse response is prim arily due to reflections but also characterizes the effect of the other wave phenomena. This portion of the impulse response is composed of a series of delayed impulses th a t are atten u ated relative to the direct-path component. This is consistent with w hat we m ight expect in a room environment where, in addition to the direct-path component, m ultiple soundwaves reach the microphone after being reflected.
2 . R o o m A c o u s t ic E n v ir o n m e n ts 12
0 8
0 6
0.2
-0.2
-0.4
- 06
0 0 01 0 02 0 0 3 0 0 4 005 0 0 6 0 0 7 0 0 8 0 0 9 0 1 tim e (s )
[image:27.534.9.510.46.785.2]2 .3 .3 R e v e r b e r a t io n tim e
In an enclosed space the reverberant component of an observed sound will decay exponentially with time. The “Reverberation Time” , (RTqo), is the time taken for the energy of the reverberant component to decay by 60dB. Originally proposed by Sabine in the late 19th century, the RT^o remains in wide use in the field of architectural acoustics. Sabine’s reverberation equation, (2.6), describe the relationship between the RTqo and the physical characteristics of a room.
RTeo = 0 . 1 6 1 ^ (2.6)
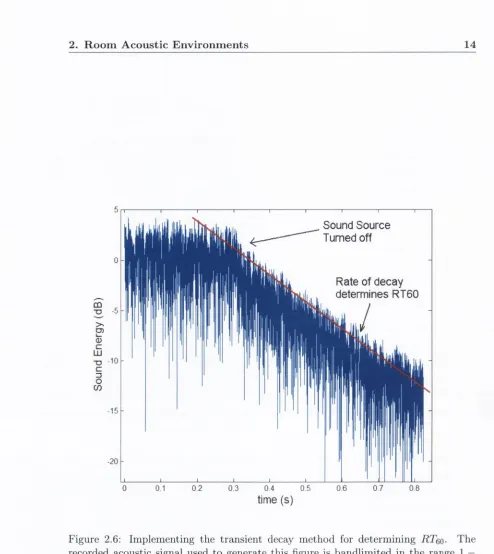
where V is the volume, S the surface area and the average surface absorption coefficient of a room. Sabine’s equation (which assumes a fully diffuse soundfield) describes a phenomena that will be intuitive to many readers, whereby large rooms with reflective surfaces will be more reverberant. However, because it characterizes the acoustic environment in terms of only its volume, surface area and average surface absorption, Sabine’s equation does not account for the effects of more subtle variations in room geometry or room contents. Several variations/improvements on (2.6) exist - most notably th at of Eyring, [1] - but these also suffer from similar deficiencies. A more satisfactory approach is to measure the RT^o directly. Using the transient decay method, [2], a spectrally white acoustic signal is interrupted and the RTqq determined from the rate of decay of the reverberant sound intensity. To investigate the variation of the RTeo with frequency, the recorded signal may be bandlimited as required. A simple illustration of this technique is shown in figure (2.6).
As previously shown in figure (2.3), surface absorption and hence RTqq, varies with frequency. Therefore, as per what has become the convention, we shall, when specifying the RTeo, be referring to the RTqo in the region of I k Hz - this being generally accepted as indicative of the relevant acoustic characteristics of a room when the sound source is human speech.
2. R o o m A co u stic E n v iro n m en ts 14
Sound Source Turned off
Rate of decay determines RT60
time (s)
[image:29.534.17.511.48.602.2]Figure 2.7: A photograph of the experimental setup used to obtain DRRs at varying distances from a sound source.
2 .3 .4 D ir e c t - t o - R e v e r b e r a n t R a t io
A more effective way of describing the degree of reverberation th at obtains on a record ing is to specify the direct-to-reverberant ratio {DRR) - that is, the ratio of the received sound energy due to the direct-path component and multipath reverberation. For a given bandwidth, the D R R for the output of a microphone, mo, may be defined as follows
= J
,2.7)D
R
R
(d
B
)
D
R
R
(d
B
)
D
R
R
(d
B
)
2. R o o m A c o u s t ic E n v ir o n m e n ts 16
O ffice 10
o Data — "Best Fir 5
0
■5
-04 -02 02 0.4
C la s s ro o m
o Data — "Best Fir 10
--0.5 0 5 2 5
R e c e p tio n Hall 20
o Data — "Best Fit" 15
10
5
-°05 05
Figure (2.8) also shows “best-fit” linear approximations of the data. The slopes of these fits are —6.12, —5.99 and —5.915 decibels per doubling of range for the office, classroom and hall respectively. Given th at we can expect \Hdpo\^ to decay at a rate of 6dB per doubling of the source-microphone range, these results suggest that, in a given room, I / \Hmpo\^ is a constant that is independent of the source-microphone range.
We note that a brief inspection of the results in figure (2.8) reveals that, although it had the greatest RTqq, the reception hall was not the most reverberant of the rooms in which we took measurements. This further illustrates the inadequacy inherent in characterizing the degree of reverberation in a room by specifying its RTqo alone. Our results do, however, suggest an alternative metric. The intercept of best-fit line with the y-axis defines the spatially-averaged “D i?i?-at-lm ” and we shall use this metric to describe acoustic conditions in the sequel.
2.4
N o ise
The term “noise” is generally taken to refer to any sound th at is, in some sense, undesirable, off-putting, containing no useful information etc. Noise that is likely to be encountered in the scenarios under investigation may be separated into three broad categories - ambient noise, quantization/sensor noise and noise due to feedback.
2 .4 .1 A m b ie n t N o is e
In addition to (probably reverberant) speech, classrooms may be expected to contain certain levels of ambient acoustic noise. This could be as the result of exterior noise sources like passing traffic. Much noise will also originate from local sources - i.e. acoustic sources in the same room as the target talker. Examples include “fan-noise” produced by computers and air conditioning units.
In [3], the authors surveyed acoustic conditions in 32 unoccupied public school classrooms across the American state of Ohio - 8 in rural, 12 in urban and 12 in suburban areas. It is worth noting that, of these, only 4 had noise levels below those recommended for effective learning, [4].
2. R o o m A c o u stic E n v iro n m en ts 18
r.
n
r
n
Room A
K
Room B
Y
l_
_l
L
J
Figure 2.9: A full-duplex communication system and the resulting “feedback loop” .
2 .4 .2 F e e d b a c k
In the scenario under investigation, natural and spontaneous interaction between par ticipants will feature a certain amount of speech overlap (i.e. m ultiple participants talking a t the same time). In order to facilitate this, our videoconferencing system m ust support full-duplex communication. Unfortunately, when using full-duplex com m unication systems there exists the potential for a “feedback-loop” to become estab lished, whereby sound is detected in one room and transm itted to a second where it is produced by loudspeakers. There, the sound is detected by microphones and tran s m itted back to the first room, figure (2.9). This gives rise to two forms of noise -
“howl” and acoustic echoes.
Howl (or acoustic feedback) is the “whistle” th a t occurs when the response of the feedback-loop has a m agnitude greater than 1 and a phase shift th a t is some integer m ultiple of 2n radians, a t some frequency. In such scenarios signal components at th a t frequency are amplified with each pass through the loop, until a point of saturation is reached. O ther sounds become unintelligible and the result is a deeply unpleasant listening experience.
in-C h a n n e l E stim atio n
Filter
_l
l_
Figure 2.10: Acoustic echo cancellation: An adaptive filter estim ates the loudspeaker- microphone response and subtracts an estim ate of the acoustic echo from the micro phone output.
creases the frequency of the signal. In this way, continuous positive feedback cannot become established at any frequency and howl is suppressed.
The term “acoustic echo” describes the phenomenon whereby the feedback loop causes a talker to hear a delayed version of h is/her own voice. Traditional acoustic echo cancellation (AEC) techniques involve the use of filters th a t estim ate the loudspeaker- microphone channel, figure (2.10). An estim ate of the acoustic echo is thus subtracted from the microphone output. Typically, the filter is updated by means of a Least- M ean-Squares-type algorithm . However, a long-recognised problem in the field of AEC is the “non-uniqueness” problem th a t arises when multiple loudspeakers emit correlated signals, [5]. In such scenarios (which include th a t which we are investigating) currently-available filter update algorithms have difficulty in accurately approxim ating the loudspeaker-microphone channel and AEC fails.
Therefore, we m ust assume the presence of acoustic echo as existing m ethods for its suppression are inadequate for the scenario being considered.
2 .4 .3 S e n s o r /Q u a n tiz a tio n N o is e
2 . R o o m A c o u s t ic E n v ir o n m e n ts 20
expected to be present in the outputs of non-ideal sensors. In general, both sensor
and quantization noise are modelled as additive, Gaussian random signals th a t are
uncorrelated across the microphone outputs.
Sensor/quantization noise may be easily controlled by our choice of quantization
levels and the use of microphones of sufficiently high quality. Hence, on its own, sen
sor/quantization noise rarely leads to audible degradation of recorded speech. How
ever, as we shall see in chapter 4, the presence of such noise does limit the degree to
which we may suppress other types of noise and so bears mention here.
2.5
P e r ce p tu a l E ffects o f N o ise and R e v e rb era tio n .
In the following section, we review the literature concerning the perceptual impact
of noise and reverberation on speech. In particular, we focus on the intelligibility
and “quality” of speech. It is, of course, difficult to assess the perceptual and hence
completely subjective characteristics of an audio signal. This difficulty is compounded
by the sheer variety of acoustic environments, types of noise etc. which it is possible
to encounter. As we shall see, however, there is certainly sufficient evidence in the
literature to verify a supposition based upon intuition and normal everyday experience
- th a t noise and reverberation degrade the intelligibility and quality of speech.
2.5.1
In tellig ib ility
Intelligibility is generally defined as being the degree to which words are correctly
heard/identified/understood by listeners. Noise and reverberation both serve to reduce
th e intelligibility of speech. Noise degrades our comprehension of speech by corrupting
its perceptually im portant physical characteristics. Our perception of the “loudness”
of noise is determined both by the intensity and frequency of the sound - th a t is
to say th a t sounds of equal intensity but different frequencies may be perceived as
having different loudness. The “A-curve” or “equal loudness curve” plots intensity
with respect to frequency for equal perceived loudness, [6]. This gives rise to the A-
weighted SNR (ASNR) by which speech and noise signal components are assigned a
weight which is inversely proportional to the A-curve, thereby placing greater emphasis
on those frequencies th a t are perceived as being louder.
Reverberation reduces intelligibility by temporally “smearing” the speech signal.
D irect-path components of recent utterances arrive at the same tim e as reflected com
ponents of previously uttered sounds. As a result, strong vowel sounds may, for ex
ample, mask consonants, making “Bad” indistinguishable from “B at” / “B ap” / “Back”
In [7], Bradley performs a series of intelligibility tests across ten classrooms chosen as representing the full spectrum of classroom acoustic environments. Each classroom contained an average of 24.3 12 — 13 year-olds who were asked to identify a series of words produced by a loudspeaker at the front of the room. Comparing intelligibility- test scores {ITS) to the acoustic conditions under which they were obtained, a regres sion equation was obtained which predicted test scores with a standard error of 9.6%. This equation illustrates the detrimental impact of noise and reverberation.
I T S = {2.26ASNR - 0.0888ASNR^ - 13.9RTeo + 95) % (2.8) However, not all reverberation is detrimental. It has been known since the work of Haas [8], th at early arriving reflections are not perceptible as reverberation but rather are perceived in such a way as they are combined with the direct-path sound, increasing its loudness. In [8] early arriving was taken to mean <40ms after the direct-path. More recent work chose cutoffs ranging between 35 — 50ms.
Haas’ work has led several authors to investigate whether, in the presence of noise, speech intelligibility is maximized by non-zero levels of reverberation - the idea be ing th at early reflections are perceived as being direct sound and thus increase some
“perceived SNR”
In [10], Bistafa and Bradley perform a theoretical investigation assuming ideal “diffuse” reverberation (i.e. propagating with equal intensity from all directions). Noise and reverberation levels were varied and analysis performed on the resulting changes in metrics previously shown to be effective predictors of mean intelligibility scores (these metrics being functions of the physical characteristics of the noisy and reverberant sound).
The results obtained revealed that in noisy environments optimal reverberation levels are non-zero (with the precise optimal level being determined by noise levels, source-microphone distances etc.). However, as pointed out in [11], the investigations in [10] contained a flaw in th at the noise levels were assumed to be independent of the reverberation levels. In fact, noise will not be absorbed by room surfaces but will be reflected. Therefore, increasing reverberation levels lead to a corresponding increase in the (reflected) noise intensity. Also, just as early reflections increase the perceived loudness of speech, so too will they increase the perceived loudness of noise. Correcting for this mistake it was found in [11] that zero reverberation is optimal when the speech source is closer to the microphone/listener than the noise source. Otherwise some non-zero reverberation level is optimal.
2. R o o m A co u stic E n v iro n m en ts 22
literature. In [12] intelligibility scores obtained in reverberant but noiseless environ
ments are shown to decrease from ~ 100% to ~ 80% as RT^q increases from 0 — 1.2s.
On the other hand, in [7], following from results obtained in noisy reverberant envi
ronments an “interaction effect” is reported whereby varying reverberation levels have
a significant effect on intelligibility scores only when th e A S N R is low. Conversely,
"If there are minimal (noise) problems the effect of room acoustics,
from very bad to near optim um changes speech intelligibility by no more
than 2.5%" [7]
For the reasons we have discussed, the separate and independent treatm ent of noise
and reverberation, as occurs in [7], leads to erroneous results. We, therefore, prefer the
results in [12] showing th a t reverberation in the absence of noise retains the potential
to significantly reduce th e intelligibility of speech.
Two further phenomena relating to the perceptual im pact of noise and reverber
ation have particular relevance for our application. The first of these is the effect on
speech intelligibility due to spatial information. In [12], intelligibility scores are ob
tained by listeners, across a range of ages, listening to reverberant recordings played
by headphones. At an R Tqq of 0.4s, these are 2 — 4% higher for binaural (stereo) sound
presentation than for the monaural case. At an R Tqq of 1.2s they are 5 — 9% higher.
In [14], it is shown th at, when noise and speech signals are generated by two spatially
separated loudspeakers at right angles to each other, an increase in intelligibility is
obtained compared to the case when both noise and speech are produced by the same
loudspeaker. This increase is equivalent to th a t achieved by a 9.6dB increase in the
SNR.
We may expect, therefore, th a t participants in a remote room, listening to a single
channel microphone recording, will perceive greater levels of signal degradation than
participants in the same room as the talker.
Secondly, we note the particularly off-putting effect of acoustic echo. This is signif
icantly greater th an th a t of other noise of similar intensity. As an illustration of this
consider th e required acoustic echo suppression specified by GSM (Global System for
Mobile communications) protocols - 46dB compared with an ASNR of 25dB described
as being “ideal” for ambient noise levels in classroom environments in [10].
2.5.2
Q uality
Perceived quality is far less well-understood than intelligibility, mainly due to the
difficulty inherent in quantifying “good” or “bad” quality. In addition individuals will
Noise, it may safely be assumed, reduces sound quality. We note th a t we are aware
of the existence of “acoustic conditioning” strategies whereby am bient noise is masked
by less irritating, deliberately injected noise. However, acoustic conditioning is in very
limited use and it may be assumed not to be present in classrooms.
Reverberation on the other hand, has long been held to improve sound quality - no
tably when referring to spaces used to host musical performances. In [8], Haas reports
early reflections as causing speech to be perceived as more “pleasant” by listeners.
O ther research, however, dem onstrates a clear preference among listeners for less
reverberant sound. In [15], listeners were presented with recordings of speech convolved
with simulated room impulse responses and asked to rank their quality using a 9-
point scale (9 being “excellent” , 1 being “unsatisfactory” ). The speech bandw idth
was AkHz. The resulting mean opinion scores were then compared with th e acoustic
conditions under which they were obtained and a predictor of speech quality derived.
This predictor is th e equation shown below
Predicted Preference = 7.94 — 0.46cr — (2-9)
where a is the stan d ard deviation of the log-am plitude of the frequency response of
the room. The average listener preference is, therefore, for less reverberant speech.
2 .6
D is c u s s io n
In chapter 1, we outlined the requirements for a classroom-based videoconferencing
application as m andated by the need to facilitate natural and spontaneous interaction
while, at the same time, using m oderate am ounts of equipment and requiring only
minimal technical know-how. Those included th e use of full-duplex com munication
protocols, multiple loudspeakers and remote microphones. This chapter will have
made apparent the significant problems th a t these requirements pose.
D irect-path sound attenuates as it travels. Therefore, in moving a microphone
farther away from a talker, we are likely to be reducing both th e SNR and DRR.
Furtherm ore, full-duplex communication is susceptible to howl and acoustic echo. The
latter is of particular concern as the traditional m ethods for its suppression fail when
multiple loudspeakers produce correlated signals. We have seen the effects of noise,
reverberation and, in particular, acoustic echo to be highly detrim ental to both the
intelligibility and perceived quality of speech. We have also noted th a t these effects
are compounded when spatial information is lost, such as occurs when noisy speech is
recorded by a single microphone.
W hat are required, therefore, are techniques by which we may suppress the noise
2. R o o m A c o u stic E n v iro n m en ts 24
signal. Traditional bandpass filtering will be of only limited use in this regard. Speech
and ambient noise are both broadband signals and, as such, will have frequency spectra
which overlap considerably. In the case of reverberation and acoustic echo, their long
term power spectra will be virtually identical to the target speech.
As we have seen, at certain levels and in certain conditions reverberation can, in
fact, improve speech quality and intelligibility. However, while it is possible th a t, in
any given scenario, the reverberation present is beneficial, it is almost certain that in
some if not most cases, the reverberation will serve to degrade speech. Therefore, we
require the means to suppress it.
In this thesis we will investigate methods by which we may enhance the perceived
quahty of recorded speech using the d ata provided by arrays of spatially distributed
microphones. In the next chapter, we develop the fundamental theory underpinning