semi-slick conditions by contour furrowing. However, the fact that furrowed and seeded slick areas remained almost barren under protection from grazing shows that slicks cannot be com- pletely elimiatned by this treat- ment.
A different kind of furrowing treatment might have beneficial- ly modified the slick soils. A contour furrowing machine that made small dams within furrows at intervals of about 40 feet was used on similar silty clay soils in the Willow Creek valley in 1955. Five years after treatment it was apparent that the small dams in furrows had prevented move- ment of water from the rela- tively impermeable slicks and provided conditions favorable for plant growth.
LITERATURE CITED ADAMS, J. E., D. KIRKHAM, AND D. R.
NIELSEN. 1957. A portable rainfall simulator infiltrometer and physi- cal measurements of soils in place. Soil Sci, Sot. Proc. 21:473-477. BARNES, 0. K. 1952. Pitting and other
treatments on native range. Wyo. Agr. Expt. Sta. Bull. 318, 23 pp. BARNES, 0. K., AND A. L. NELSON.
1945. Mechanical treatment for in- creasing the grazing capacity. Wyo. Exp. Sta. Bull. 273, 23 pp.
BROWN, A. L., AND A. C. EVERSON. 1952. Longevity of ripped furrows in southern Arizona desert grass- land. Jour. Range Mangt. 5:415- 419.
DICKSON, R. E., B. C. LANGLEY, AND C. E. FISHER. 1940. Water and soil conservation experiments at Spur, Texas. Tex. Agr. Expt. Sta. Bull. 587, 66 pp.
GARDNER, ROBERT. 1936. A method of measuring the capillary tension of
soil moisture over a wide range. Soil Science 43: 277-283.
HUBBARD, W. A., AND S. SMOLIAK. 1953. Effect of contour dikes and furrows on short-grass prairie. Jour. Range Mangt. 6: 55-62. NEWPORT, F. C. 1937. Corduroy coat
protects high plains from drought. Soil Conservation 2: 139-140. RICHARDS, L. A. (editor). 1954. Diag-
nosis and improvement of saline and alkali soils. Agr. Handbook No. 60, U. S. Dept. of Agr. Soil Conservation Service, U. S. Dept. of Agriculture.
VALENTINE, K. A. 1947. Effect of water-retaining and water-spread- ing structures in revegetating semidesert rangeland. New Mex. Agr. Expt. Sta. Bull. 341, 22 pp. WHITFIELD, C. J. AND C. L. FLY. 1939.
Vegetational changes as a result of furrowing pasture and range- lands. Jour. Am. Sot. Agron. 31: - 413-417.
Factors Affecting Fill and Consequently
Overnight Shrinkage in Range Cattle
KENNETH A. WAGNON AND W. C. ROLLINS
Specialist in Animal Husbandry and Associate Projes- sor of Animal Husbandry, University of California, Davis, California.
Fill in cattle has long been recognized as a factor influenc- ing animal weight. The four stomach compartments of a full- grown range cow may have a capacity of over 250 quarts, the small intestine 70 quarts, the large intestine 40 quarts (Morri-
son, 1956) and the bladder about a quart. It is obvious, therefore, that the amount of unassimilated feed and water in the animal can materially affect its body weight.
In the studies reported here the first method of handling ex- perimental range cattle was to gather in the morning, drift to- ward the corrals, allow the ani- mals to drink and then weigh them individually. Pasture size, topography, and brush and tree cover made it difficult at times, to find all animals. These fac- tors and the varying distances to the corrals sometimes necessi-
tated an entire day to weigh all the animals.
The effects of fill in the cattle soon became evident. Time of watering at the corral varied be- tween individuals and the lapse of time since the last drink in the pasture in each case was sel- dom, if ever, known. If the ani- mals were allowed to drink in the pasture at the start of gath- ering, differences in the amounts of water taken were noticed. When they were not allowed to water until reaching the corrals, nervousness and excitement with confinement interfered with water intake. Amounts of for- age available and its condition at different seasons of the year also affected fill.
Under California conditions the various species of annual for- age plants continually change from germination and seedling
establishment, through winter retardation, flush spring growth, maturing, drying and weather- ing. There are also marked dif- f erences in herbage abundance between the unfavorable winter and the lush spring periods, be- tween drought and wet years, and with various systems of grazing management. In heavy rainfall years some green forage usually is available well into June, but with low rainfall prac- tically all the forage becomes dry early in May. These factors may also be expected to influ- ence cattle fill. Lush et al. (1928) previously noted that environ- mental circumstances affect fill and shrinkage in cattle.
To study the factors that influ- ence fill, various classes of ex- perimental cattle were weighed before and after 12-to-14 hour shrink at different seasons dur- ing several years.
Procedure
The studies were conducted at the San Joaquin Experimental Range,l located in the Sierra
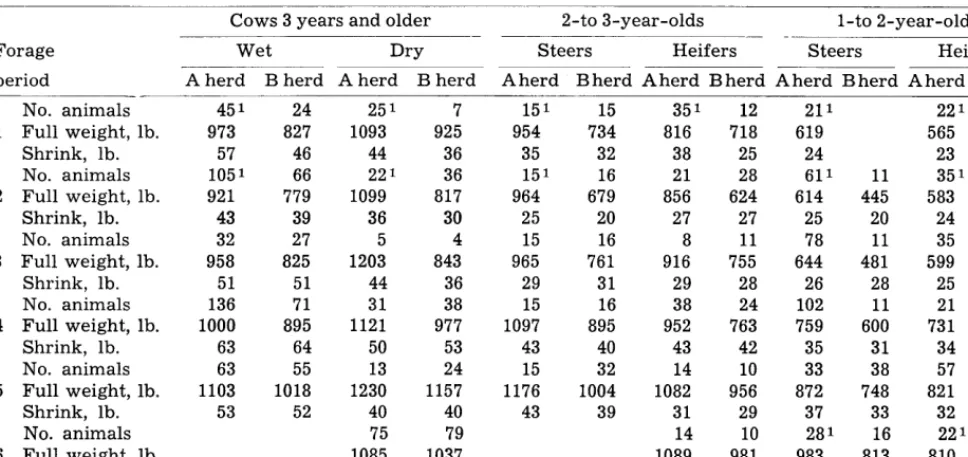
Table 1. Amount development.
Forage period
No. animals - 1 Full weight, lb.
Shrink, lb. No. animals 2 Full weight, lb.
Shrink, lb. No. animals 3 Full weight, lb.
Shrink, lb. No. animals 4 Full weight, lb.
Shrink, lb. No. animals 5 Full weight, lb.
Shrink, lb. No. animals 6 Full weight, lb.
Shrink, lb.
of overnight shrink of various classes of range cattle at six different periods of forage
Cows 3 years and older 2-to 3-year-olds l-to 2-year-olds
-.__
Wet Dry Steers Heifers Steers Heifers
A herd B herd A herd B herd Aherd B herd Aherd B herd Aherd B herd Aherd B herd
451 24 251 7 151 15 351 12
973 827 1093 925 954 734 816 718
57 46 44 36 35 32 38 25
1051 66 221 36 151 16 21 28
921 779 1099 817 964 679 856 624
43 39 36 30 25 20 27 27
32 27 5 4 15 16 8 11
958 825 1203 843 965 761 916 755
51 51 44 36 29 31 29 28
136 71 31 38 15 16 38 24
1000 895 1121 977 1097 895 952 763
63 64 50 53 43 40 43 42
63 55 13 24 15 32 14 10
1103 1018 1230 1157 1176 1004 1082 956
53 52 40 40 43 39 31 29
75 79 14 10
1085 1037 1089 981
39 36 35 29
211 221 10
619 565 357
24 23 18
611 11 351 30
614 445 583 430
25 20 24 21
78 11 35 20
644 481 599 442
26 28 25 22
102 11 21 11
759 600 731 594
35 31 34 33
33 38 57 56
872 748 821 712
37 33 32 30
281 16 221 10
983 813 810 688
42 32 39 31
1A herd cattle received range supplements in fall 8~ winter.
Nevada foothills near the geo- graphical center of California at elevations between 700 and 1700 feet. The Mediterranean type climate is accompanied by an av- erage annual rainfall of about 18 inches. The woodland-grass veg- etation type predominates with about 97 percent of the cover comprised of annual plants. About 87 percent of the area is in slopes with sandy soils de- rived from underlying granitic bedrock. Average soil depth is less than two feet and rock out- croppings are numerous. Some drainages contain swale areas with soils of a heavier texture, deeper and more productive than those of adjacent slopes (Hutchi- son and Kotok, 1942).
Two range herds of grade Hereford cows and their off- spring maintained under two systems of management (Wag- non et al., 1959) were involved in the studies.
From about August 1 to Feb- uary 1, breeding herd A was on native range with a cottonseed cake supplement. When the rains began, usually in October, rolled barley was added to the supple- ment. Herd B was carried on natural range without supple-
ments. All winter ranges were moderately stocked. For the re- mainder of the year the two herds were involved in a graz- ing intensity study (Bentley and Talbot, 1951). Range supplements were not provided during this period.
At the start weights were taken to the nearest five pounds but refined later to the nearest one or two pounds, depending on the scales in use. Frequent rebalancing of the scale helped correct for mud and other fac- tors.
Six general range stages or sit- uations were recognized as af- fecting the cattle and, therefore, fill and their weights.
Period 1. Late fall and early winter following the start of new forage growth. Amount of new growth available moderately re- stricted and taken with mature, leached forage.
Period 2. Mid-winter with small amount of new forage available and cattle forced to take a large percentage of old, leached forage. Total forage in- take at lowest point for entire year.
Period 3. Late winter with in-
creasing amount of new forage available. Cattle feeding entirely on new forage.
Period 5. Spring with abun- dant forage available. Plants growing rapidly and early spe- cies starting to mature.
Period 5. Late spring and early summer with abundant forage available. Most of plants mature and drying.
Period 6. Summer and early fall with abundant forage avail- able. Practically all mature and dry.
These periods differed in length from year to year with climatic conditions. Quality of the forage varied also for the same period between years, de- pending on rainfall.
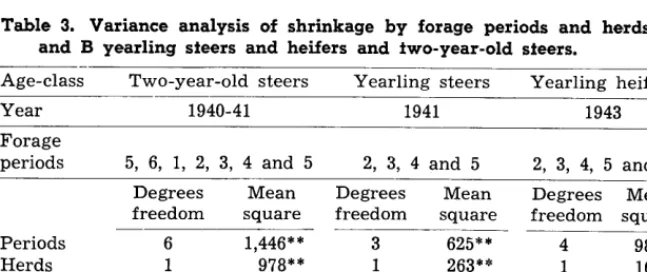
Table 2. Variance analysis of shrinkage by forage periods and herds; A and B wef cows.
Year 1941 1941-42 1943 1944
Forage
periods 4 and 5 1, 2 and 3 2 and 4 ~- 2 and 4 Degrees Mean Degrees Mean Degrees Mean Degrees Mean freedom square freedom square freedom square freedom square Periods 1 3,584** 2 1,520** 1 6,643** 1 5,271””
Herds 1 25 1 116 1 46 1 28
Periods
x herds 1 230 2 433” 1 94 1 89
Error 68 201 84 100 80 131 44 88
*Significant at 5%. **Significant at 1% .
Effects of Forage Growth Stage All cattle except the l-to-2 year olds showed the lowest shrinkage during period 2, win- ter, when forage was scant. The highest shrink occurred in pe- riod 4 when forage was abun- dant and very succulent. Over- night shrink dropped off in pe- riod 6, summer and early fall, when forage was abundant but mature and dry. Differences (P < .Ol) in fill, one period to the other, is perhaps best illustrated by the data for wet cows in herd B. The smallest average change in shrink between 2 periods was 7 pounds and the greatest 13 pounds. The greatest change in shrink over the year was 25 pounds between periods 2 and 4. Similar data for the B herd dry cows are 6, 17 and 23 pounds, re- spectively.
Period differences for the wet cows (Table 2) were significant at the 1 percent level in every case but herd differences were
not significant. This may be be- cause the animals were at, or approaching, maturity. In one case, 1941-42, period-herd inter- action was significant. Here the fact that the A herd cows re- ceived supplements in two out of three periods seems pertinent.
Similar analyses were made for yearling steers and heifers and two-year-old steers (Table 3). Again, in every case differences between forage periods were sig- nificant at the 1 percent level. Herd differences were signif i- cant for steers but not for the heifers. No reason for this sex difference was apparent to the authors. Differential growth rate was considered mainly respon- sible for the herd differences in these younger cattle.
Wet Cows
Wet cows showed the largest overnight shrink of all classes of cattle. In period 4 it averaged 64 pounds with some cows shrinking more than 100 pounds.
Table 3. Variance analysis of shrinkage by forage periods and herds; A and B yearling steers and heifers and two-year-old steers.
Age-class Two-year-old steers Yearling steers Yearling heifers
Year 1940-41 1941 1943
Forage
periods 5, 6, 1, 2, 3, 4 and 5 2, 3, 4 and 5 2, 3, 4, 5 and 6 Degrees Mean Degrees Mean Degrees Mean freedom square freedom square ~___ freedom square
Periods 6 1,446** 3 625** 4 988**
Herds 1 978** 1 263”” 1 166
Periods
x herds 6 106 3 26 4 86
Error 196 50 108 34 140 57
**Significant at 1% .
Wet cows have a greater need for feed and water than drys and as expected, they carry greater fills. This is substantiated by Table 1. Overnight shrink of wet cows averaged from 7 to 15 pounds greater within forage pe- riods than for dry cows.
Cows were not separated from their calves during the shrinking period, thus their weight loss was greater, compared to dry cows of similar size, by the amount of milk taken by the calves during the period of con- f inement . Measurement of this loss was not attempted because calves lose weight when con- fined, even with their mothers. If the cows and calves were sep- arated during their overnight confinement, it would eliminate cow weight changes caused by nursing. However, the resulting excitement and fretting would probably increase weight losses in both cows and calves.
Overnight weight changes in calves were observed twice, both instances in period 5. Grazing in- tensity had little effect on shrink in 1939 when the averages varied from 7 to 11 pounds. The follow- ing year average shrink values ranged from about 15 pounds in one pasture to a 4-pound gain in another.
Range Supplements
Supplemental feeding also in- fluenced fill and overnight shrinkage in cattle (Table 1). In every case the A herd, which re- ceived range supplements, shrunk more than the B herd which was on range without a supplement. Differences in shrink between groups on sup- plemented and unsupplemented range, within forage periods, varied from 3 to 13 pounds.
Effects of Growth
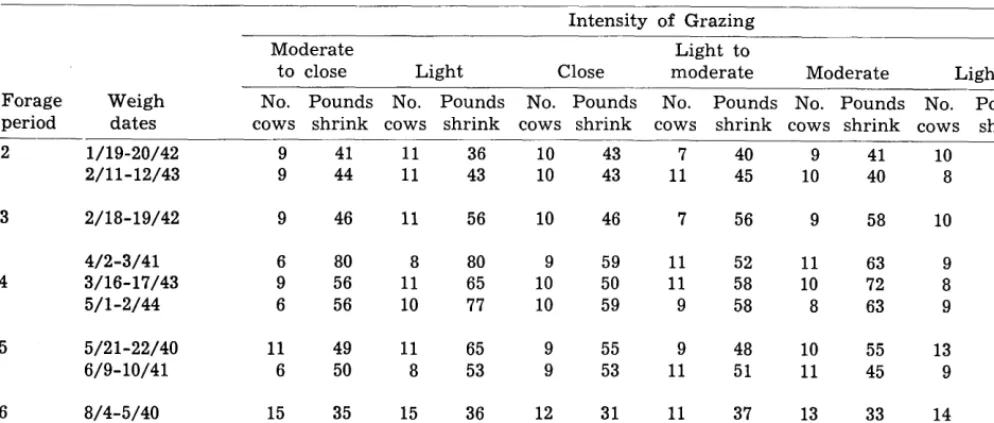
Table 4. Average overnight shrink of wet cows as affected by grazing intensify.1 Intensity of Grazing Moderate
to close Light Close
Light to
moderate Moderate Light Forage
period
Weigh dates
No. Pounds No. Pounds No. Pounds No. Pounds No. Pounds No. Pounds cows shrink cows shrink cows shrink cows shrink cows shrink cows shrink
2 l/19-20/42 9 41 11 36 10 43 7 40 9 41 10 40
2/11-12/43 9 44 11 43 10 43 11 45 10 40 8 42
3 2/18-19/42 9 46 11 56 10 46 7 56 9 58 10 45
4/2-3/41 6 80 8 80 9 59 11 52 11 63 9 61
4 3/16-17/43 9 56 11 65 10 50 11 58 10 72 8 57
5/l-2/44 6 56 10 77 10 59 9 58 8 63 9 62
5 5/21-22/40 11 49 11 65 9 55 9 48 10 55 13 49
6/g-10/41 6 50 8 53 9 53 11 51 11 45 9 54
6 8/4-5/40 15 35 15 36 12 31 11 37 13 33 14 39
8/12-13/41 11 42 10 41 14 40 12 35 14 40 12 43
1 Cows placed in pastures at period 2 weighing and all dry (calves weaned about July 1) before final weighing in period 6. Standard deviation of shrink for wet cows is approximately 11 pounds.
dry cows in the B herd changed markedly with forage conditions. Two- to three-year-old heifers in the B herd showed similar but 3 to 12 pounds smaller changes. One- to two-year-old heifers in the B herd were likewise lower (6 to 10 pounds) than the two- to three-year-old heifers for the first four periods. In the fifth and sixth periods the differences were small. The average shrink in the youngest heifers and steers did not follow the same trend as in the older animals. Instead there was a progressive increase in shrink with increas- ing age. This indicates that in younger animals the increase in shrinkage is mainly due to rapid growth and this tends to mask differences caused by changing forage conditions.
The effects of increasing age on fill and overnight shrink was also demonstrated by the dry cows of the B herd for period 4. Shrink averaged 33, 42, 47, 51, 56, and 55 pounds for dry cow groups 16, 28, 40, 52, 64, and 76 months of age.
Effects of Grazing Intensify The effect of extreme differ- ences in grazing intensity on ani- mal fill is shown by the shrink- age data from cattle on lightly
grazed pasture 2 and closely grazed pasture 3 (Table 4). For forage periods 3, 4, and 5, the pasture 2 cows shrunk 10 to 21 pounds more than those from pasture 3. There was no differ- ence between the groups in the sixth period.
Each year when the animals were first placed in these pas- tures the new forage growth was more abundant in pasture 2 than in pasture 3. Average animal weight changes from the second to the third forage period were indicative of this differential in available forage, traceable pos- sibly to the two rates of stock- ing. However, differences in fill markedly affected this relation- ship in 1942. Differences in shrink between periods 2 and 3 showed that pasture 2 cows gained 20 pounds more before shrinking than on a shrunk weight basis. The corresponding difference for the pasture 3 cows was 3 pounds. Similar results are shown by the 1943 data for periods 2 and 4. Differences in average shrinkage values be- tween these periods show that the pastures 2 and 3 cows made 23 and 7 pounds greater gain, re- spectively on weights before shrinkage than with shrunk weights.
Effects of Oiher Factors Variation in watering habits also influences fill. Excess water is rather rapidly eliminated and shrinking cattle overnight tends to equalize water-fill variations caused by differences in amounts and time of watering. However, it is felt that the animal diges- tive tract, during periods of for- age abundance, still contains more unassimilated feed and water than in periods of forage scarcity, even though in both in- stances the animals are without feed or water from a 12- to 14- hour period.
Summary
Data were presented showing that variation in abundance and stage of forage development, lactating condition (wet or dry), supplemental feeding, growth, and grazing intensity cause sig- nificant differences in fill and consequently in overnight shrinkage of range cattle. Thus, animal weights obtained after a 12- to 14-hour period without food and water will be more pre- cise than those taken without a shrink.
LITERATURE CITED
foothills. U. S. Dept. Agr. Cir. 870, LUSH, J. L., F. W. CHRISTENSEN, C. V. Co. New York. pp. 21-22.
52 PP. WILSON AND W. H. BLACK. 1928. WAGNON, K. A., H. R. GUIL,BERT AND HUTCHISON, C. B. AND E. I. KOTOK. The accuracy of cattle weights. G. H. HART. 1959. Beef cattle in-
1942. The San Joaquin Experi- Jour. Agr. Res. 36:551-580. vestigations on the San Joaquin mental Range. Calif. Agr. Exp. MORRISON, FRANK B. 1956. Feeds and Experimental Range. Calif. Agr. Sta. Bul. 665, 143 pp. Feeding. The Morrison Publishing Exp. Sta. Bul. 765. 71 pp.
Application of Soil-Climate-Vegetation Relations
to Soil Survey Interpretations for Rangelands
I-L
B. PASSEY AND V. K. HUGIERange Conservationist and Soil Scientist, Soil Conserva- tion Service, Salt Lake City, Utah.
Perspectives, objectives, meth- ods and techniques employed in the appraisal and interpreta- tion of rangeland resources dur- ing the present century reflect the gradually evolving demand for more basic knowledge. The needs of an increased population can result only in more intensive use and treatment of agricultural lands, including those devoted to production of forage for live- stock and game animals. Intel- ligent intensification of the use and management of any resource must be based upon extensive knowledge of that resource and it-s wise interpretation.
Early range inventory meth- ods were concerned primarily with the classification and inter- pretation of the vegetation. Little attention was given to soil and climatic influences or to the ecological aspects of range re- source inventory (Dyksterhuis, 1958). The gradual shift toward recognition of the ecological as- pects of range inventories and the increasing interest of soil science in the use and manage- ment of rangelands has been re- viewed by Renner (1948)) Dyk- sterhuis (1949) and, more re- cently, by Poulton and Tisdale
(1961).
Although inventories b as e d primarily upon present vegeta- tion undeniably have be en of considerable value to range man- agers, they have not provided the basis or information required for optimum management. It is not
enough to know only the kinds and amounts of plants presently growing on ranges. If manage- ment is to be directed toward the realization of sustained high pro- duction consistent with protec- tion of the resource the range manager must know the capabil- ities of the different kinds of rangeland. He needs to know how much and what kinds of plants his lands can produce and must evaluate the present plant cover in relation to the potential for each kind of range. The pre- sent condition of the range pro- vides a starting point for man- agement. The potential plant cover represents a goal toward which management for improve- ment of ranges in unsatisfactory condition can be directed.
The concept of the “range site” has been developed to express differences in the inherent pro- ductive capacity of different kinds of rangelands. Simply de- fined, range sites are kinds of rangeland with different poten- tials for producing native plants. Each range site has its own com- bination of environmental condi- tions, the ultimate expression of which is a distinctive plant com- munity. Furthermore, the range site retains its capacity to repro- duce this potential plant com- munity unless altered by phys- ical deterioration. The range site is comparable to the capability unit for cultivated land (Hocken- smith and Steele, 1943).
Several methods of determin-
ing range condition based upon comparison of the present plant cover with the normal potential for the site have been extensive- ly reviewed by Dyksterhuis
(1949). If we accept the propo- sal that knowledge of the nature of potential native plant commu- nities is prerequisite to evalua- tion of range condition, and to providing information to guide range users in making more in- telligent decisions in the use and treatment of their lands, then the question arises as to how that potential can be determined.
If all or many rangelands were presently supporting their po- tential native plant communities, this potential could be deter- mined on the basis of the vegeta- tion alone. This becomes increas- ingly difficult and finally im- possible as the condition of the range declines. In the absence of the original or potential plant cover, a range site must be rec- ognized on the basis of the rela- tively permanent (and map- pable) features which are con- sistently associated with the po- tential plant cover of that site. These features normally are soil and climate.