EFFECTS OF GEOGRID SHEET ON
STRENGTH AND STIFFNESS OF LOOSE
SAND
H. P. Singh
1Associate Professor, Department of Civil Engineering, NERIST, Itanagar, A.P., India 1
Abstract: Reinforced soil is a composite material which is formed by the association of frictional soil and tension resisting elements in the form of sheets, strips, nets, or mats of metal, synthetic fabrics or fiber reinforced plastics and arranged in the soil mass in such a way as to reduce or suppress the tensile strain which might develop under gravity and boundary forces. It is well-known facts that most granular soils are strong in compression and shear but weak in tension. The performance of such soils can be substantially improved by introducing reinforcing elements in the direction of tensile strains in the same way as in reinforced concrete. Keeping this in view the present study was taken up. In this study triaxial compression tests were conducted on a medium dense granular soil (RD = 40 %) reinforced with synthetic geogrid sheet. The geogrid sheets equal to plan dimension of split mould were placed within the triaxial test samples in different combinations such as 3 layers, 4 layers and 5 layers at equal vertical spacing. The stiffness
modulus (σd/ϵ) and shear strength parameters (c and ϕ) of reinforced sand corresponding to each combination of geogrid sheet were determined in the laboratory. Tests results indicate that the stiffness modulus and the shear strength parameters of soil increase on the inclusion of geogrid sheet. It was also observed that on increasing the number of geogrid sheet these strength parameters further improve and the improvement is substantial corresponding to 5 layers of geogrid sheet.
Thus there is a significant improvement in stiffness modulus and shear strength parameters of reinforced soil due to geogrid sheet and the load carrying capacity of reinforced soil will be improved and immediate settlement will be reduced.
Keywords: Keywords: Sand, Geogrid, Triaxial compression test, Stiffness modulus, Shear Strength parameters.
I. INTRODUCTION
and shear strength envelopes for fiber-reinforced sand clearly shows the existence of a threshold confining stress below which the fiber tries to slip or pull out. A number of researchers have studied the strength behaviour of soil reinforced with various types of randomly distributed elements. Andrews et.al.(1986) used the randomly distributed polymeric mesh elements, Gray and Al Refeai (1986), Mahar and Gray (1990), Ranjan et al.(1996), Consoli et al. (2002), Michalowski and Cermak, (2002), Rao et al. (2006), and Chandra et al. (2008) used synthetic fiber, Fatani et al.(1999) used metallic fiber and Lawton et.al.(1993) used discontinuous multioriented polypropylene elements to needed construction material on the other. Both these problems are becoming acute in the urban environment beca reinforce soil and it has been shown that the addition of randomly distributed elements to contributes to the increase in strength and stiffness of soil. Lekha (2004) and Vishnudas et al. (2006) have presented a few case studies of construction and performance monitoring of coir geotextile reinforced bunds and suggested that the use of coir is a cost effective eco-hydrological measure compared to stone-pitching and other stabilization measures used in the protection of slopes and bunds in rural areas. Sivakumar Babu and Vasudevan (2008) and Singh et.al (2011) studied the strength and stiffness response of soil reinforced with coir-fiber. Singh and Bagra (2013) studied the effects of Jute fiber on shear strength parameters and stiffness modulus of soil. Based on the experimental results they found that stress-strain behaviour of soil is improved by inclusion of fiber. They also observed that stiffness modulus of reinforced soil increases considerably which will reduce the immediate settlement of soil significantly.
This paper presents the influence of synthetic geogrid sheet on the shear strength parameters (c and ϕ) and stiffness
modulus (σd/ϵ) of loose sand. A number of triaxial compression tests have been conducted on sand and sand reinforced
with different combinations (i.e. 3 layers, 4 layers and 5 layers) of geogrid sheet. The effects of number of geogrid sheets on shear strength parameters and stiffness modulus of reinforced soil have also been investigated and results were compared with that of unreinforced soil.
II.MATERIALS AND TEST PROCEDURE
A. Sand
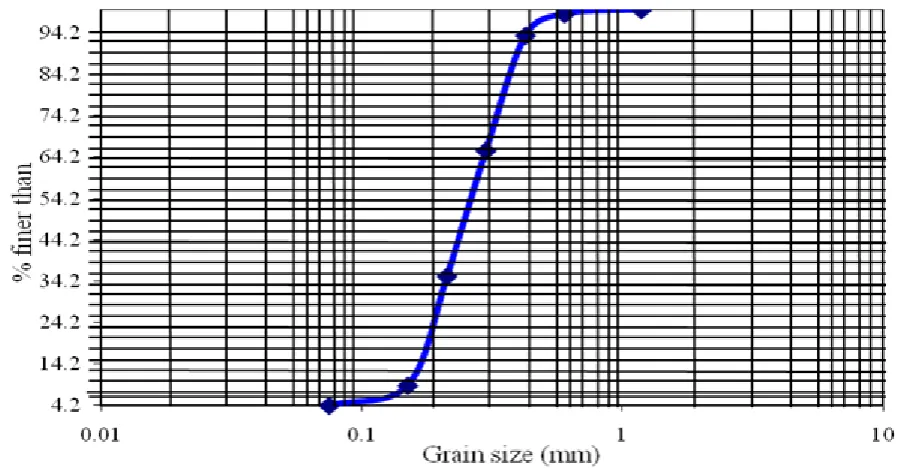
The sand used in present investigation was taken from the bed of Solani River (Roorkee, India). The index properties and particle size distribution curve of sand are shown in Table 1 and Fig. 1 respectively. According to the Indian Standard on Soil Classification for general engineering purposes (IS.: 1498-1992), it has been classified as poorly graded sand (SP) with little fines. The maximum and minimum void ratios were determined in accordance with the procedure laid down in Indian Standard IS.: 2720 (Part-15-1992) and are found to be 0.87 and 0.55 respectively.
B. Geogrid Sheet
Fig.1: Particle Size Distribution Curve of Sand
Table 1: Index and Compaction Properties of Fly ash
S.N0 .
Particulars Notations Specific Gravity (G)
Value
1 Soil Type Plasticity Index (PI)
2
3
4
5
6
7
8
9
Specific Gravity of grains
Uniformity Co-efficient
Co-efficient of Curvature
Grain Size
Maximum Void Ratio
Minimum Void Ratio
Void Ratio
Dry Unit Weight
G
Cu
Cc
D50
D10
emax
emin
e for Dr = 25%
γd for Dr =
25%
2.68
1.80
1.0
0.25
0.15 0.87
0.55
0.79
14.9 kN/m3
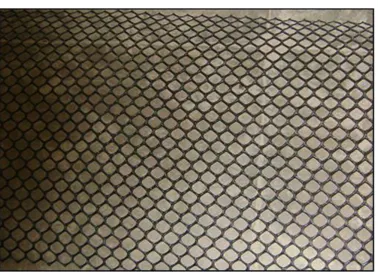
Table 2:Properties of Netlon geogrid (CE-121)
S. No. Property Description
1
2
3
Physical
Chemical
Mechanical
Colour-Black, Roll width-2m, Roll length- 25m, Mesh aperature-20 mm x 20 mm, Mesh Thickness – 4 mm
Structural weight – 730 gm/m2
100% High density polyethylene, excellent resistance to chemical and microbiological agents, poor resistance to
oxidizing agents and ultraviolet light
Rupture strength - 7.68 kN/m
C. Test Procedure
The air-dried sand specimens for triaxial compression tests were prepared in a standard cylindrical split mould of 100 mm diameter and 200 mm height. All specimens were prepared at relative density of 25 %. Dry sand of specified weight was compacted to make the samples at relative density of 25 % (Dry density of 14.90 kN/m3) using tamping rod made up of solid aluminium material having diameter 8 mm and length 250 mm. In case of geogrid reinforced sand, geogrid sheet was placed in the sand sample of split mould at equal vertical spacing. All the specimens were tested in a conventional triaxial apparatus under three different confining pressures (ranging from 50 kPa to 150 kPa) in undrained condition. Load was applied at a controlled strain rate of 1.58% per minute until the specimen failed/strain of 20% whichever was reached earlier.
Load was applied at a controlled strain rate of 1.58% per minute until the specimen failed/strain of 20% whichever was reached earlier. Some tests were repeated to check the reproducibility of tests results and it was found that variation is within 10 %. A total number of 20 triaxial compression tests were carried out for various combinations of geogrid sheetss under different confining pressures.
III. TEST RESULTS AND DISCUSSIONS
Stress versus strain curves for different confining pressures from 50 KPa to 150 kPa were plotted from the tests results of triaxial compression test performed on the sand and sand reinforced with different combinations of geogrid sheets. These plots are shown in Figs.3 (a-c). Because preparation of identical samples of geogrid reinforced sand at 20 % relative density beyond 5 layers of geogrid sheets was not possible hence the present investigation was restricted to 5 layers of geogrid sheets only. The improvement in strength parameters (stiffness modulus and shear strength parameters) of sand reinforced with 1 layer and 2 layers of geogrid sheets was not significant and hence it is not included in this report for discussions. The values of stiffness modulus (σd/ϵ) for geogrid reinforced sand having
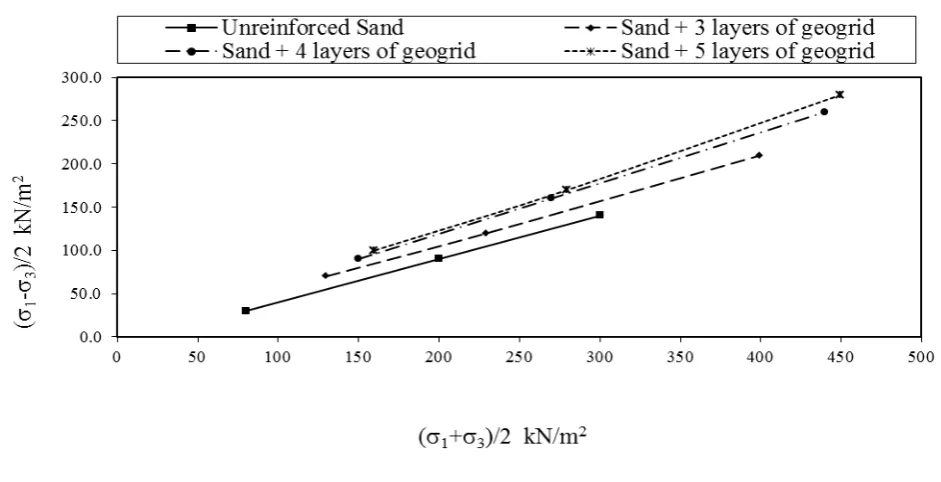
different combinations of geogrid sheets were computed from stress-strain curves and are shown in Table 3. The modified failure envelopes of sand reinforced with different combinations (3 layers, 4 layers and 5 layers) of geogrid sheets were drawn which are shown in Fig.4. The shear strength parameters (c and ϕ) of reinforced sand were measured from the modified failure envelopes and are shown in Table 4
Fig. 3(a): Stress versus Strain Curves of Geogrid Reinforced Sand under Confining Pressure of 50 kPa
Fig. 3(c):Stress versus Strain Curves of Geogrid Reinforced Sand under Confining Pressure of 150 kPa
Table 3: Stiffness Modulus of Sand Reinforced with Different Combinations of Geogrid sheets
Number of layers of Geogrid Sheet
Confining Pressure (ϭ3)
(kN/m2)
Deviator Stress
(σd )
(kN/m2)
Strain (ϵ)
Stiffness Modulus
(σd /ϵ)
(kN/m2)
Average Stiffness Modulus Increase in Average Stiffness Modulus Percentage Increase in Average Stiffness Modulus 0 50 100 150 62.1 170 334.3 0.04 0.047 0.067 0.184 1552.5 3617 4990
3387 - -
3 50 100 150 166.3 270.42 505.8 0.083 0.0475 0.0625 2004 5693 8093
5263 1876 55
4 50 100 150 194 334 572 0.085 0.055 0.055 2282 6073 10400
6252 2865 85
5 50 100 150 220.5 355.3 700.13 0.095 0.055 0.065 2321 6460 10771
6517 2153 92
Table 4: Shear Strength Parameters (c and ϕ) of Reinforced Sand withDifferent Combinations of Geogrid Sheets
Number of layers of Geogrid Sheet
c (kN/m2)
ϕ
(Degree)
Percentage Increase in (c)
Percentage Increase in
(ϕ)
0 0 28 - -
3 0 32 - 14
4 0 36 - 29
5 25 38 - 36
A. Effect of Geogrid Sheet
improvement in average stiffness modulus of sand is 92 % over plain sand for 5 layers of geogrid sheet. The significant increase in average stiffness modulus of reinforced sand due to addition of geogrid sheet improves the load-settlement characteristics of sand and the amount of immediate settlement will be reduced significantly. It is observed from Table 4 that the shear strength parameters (c and ϕ) of reinforced sand increases with the increase in number of layers of geogrid sheets and this aspect is observed for all the combinations of geogrid sheet. Column 2 and Column 3 of Table 4 show the values of angle of internal friction (ϕ) and cohesion (c) of reinforced sand. Column 4 and Column 5 of Table 4 presents the percentage increase in (ϕ) and (c) values of sand due to inclusion of geogrid sheets. Because the cohesion (c) of unreinforced and reinforced sand for 3 layers and 4 layers is zero, hence improvement in cohesion (c) component of shear strength of sand has not been shown. The cohesion component of shear strength of reinforced sand for 5 layers of geogrid sheets is observed to be 25 kPa which indicates that there is a substantial improvement in shear strength parameters of reinforced sand for 5 layers of geogrid sheets. The results of Column 5 of Table 4 clearly show that the percentage increase in (ϕ) values of reinforced sand are 14, 29 and 36 over plain sand for 3 layers, 4 layers and 5 layers of geogrid sheet respectively. The significant increase in shear strength parameters of sand due to addition of geogrid sheet improves the load carrying capacity of sand and geogrid reinforced sand can be used for supporting the heavier loads of civil engineering structures. The increase in stiffness modulus and shear strength parameters of reinforced sand is due to the fact that inclusion of geogrid sheet into sand improves its load deformation behaviour by interacting with the sand particles mechanically through surface friction and also by interlocking. The function of bond or interlock is to transfer the stress from sand to the geogrid sheet by mobilizing its tensile strength. Thus, geogrid sheet works as frictional and tension resisting element. Further, addition of geogrid sheet makes the sand a composite material whose strength and stiffness is greater than that of unreinforced sand.
IV. CONCLUSIONS
Based on the present investigation it is concluded that preparation of identical samples of geogrid reinforced sand beyond 5 layers of geogrid sheets is not possible and hence optimum number of layers of geogrid sheet is 5. There is no significant improvement in stiffness modulus and shear strength parameters of sand reinforced with 1 layer and 2 layers of geogrid sheet. The value of stiffness modulus of geogrid reinforced sand increases with the increase in number of layers of geogrid sheets and the maximum percentage increase in stiffness modulus is 50 % over the plain sand for 5 layers of geogrid sheet. The shear strength parameters (c and ϕ) of sand increases with the increase in number of geogrid sheets. The maximum increase in the value of (ϕ) is 36 % over the plain sand for 5 layers of geogrid sheet. The stiffness modulus of reinforced sand increases with the increase in confining pressure.
ACKNOWLEDGMENT
The author expresses his deep sense of gratitude to Professor Swami Saran and Dr. B.K. Maheshwari of Earthquake Engineering Department, IIT Roorkee, for their valuable technical advice and encouragement to complete this investigation. The help and support provided by Professor Parveen Kumar, Professor. M. Parida, Sri Pradip Kumar Singh and Sri Rakesh kumar Singh and his colleagues of Civil Engineering Department, IIT Roorkee are gratefully acknowledged. This investigation was conducted at IIT Roorkee, Roorkee, India.
REFERENCES
[1] Andrews, K. Z, McGown, A., Hytiris, N., Mercer, F. B. and Swetland, D. B, (1986). “The use of mesh elements to alter the stress strain behavior of granular Soils”, Proc. of the third International Conference on Geotextiles, Vienna, 839-844
[2] Chandra S., Viladkar, M.N. and Nagrrale P.P, (2008). “Mechanistic Apporoach for fibre reinforced flexible pavements”
Journals of Transportation Engineering ,Vol. 134,15-23.
[3] Consoli, N.C., Montardo, J.P., Prietto, P.D.M., and Pasa, G.S, (2002). "Engineering behavior of sand reinforced with plastic waste." J. Geotech Geoenviron. Eng., ASCE, 128(6), 462-472.
[4] Fatani, N.M., Bauer, G.H., and Al-Joulani, N, (1999). “ Reinforcing soil with aligned and randomly oriented metallic”,
Journal of ASTM Geotech Testing (1), pp 78-87.
[5] Gray, D.H., and Ohashi, H,(1983). “Mechanics of fibre reinforcing in sand, Journal of Geotechnical Engineering” ,ASCE
112(8):335-353..
[6] Gray, D.H., and Al-Refeai, T, (1986).” Behaviour of fabric- versus fibre-reinforcd sand,” Journal of Geotechnical Engineering,
ASCE, 112(8): 804-820.with randomly oriented fiber inclusions”. Geotextiles and Geomembranes 21 (2003) 123-149.
[7] Lawton E.C., Khire, M.V. and Fox, N.S, (1993). “Reinforcement of soils by multioriented geosynthetic inclusion,” Journal of
[8] Lekha, K. R, (2004).” Field instrumentation and monitoring of soil erosion in coir geotextiles stabilized slopes-A case study”, Journal of geotextiles and geomembranes; 22(5), 399-413.
[9] Maher, M.H. and Gray, D.H. (1990). "Static response of sands reinforced with randomly distributed fibres.”]oumal of Geotechnical Engineering, ASCE. 716 (11), 1661-1677
[10] Michalowski, R.L. and Cerma'k, J, (2002). "Strength anisotropy of fibre reinforced sand", Computer Geotech. 29, No. 4,279-
299.
[11]
Ranjan, G., Vasan, R.M. and Charan, H.D. (1996), Probabilistic analysis of randomly distributed fibre-reinforced soil, Joumal of Geotechnical Engineering, ASCE, 122(6): 419-426.
[12] Rao, A.S. Rao, K.V.N., Sabitha, G. and SurestL K. (2006). Load deformation behaviour of fibre-reinforced gravel beds overlying soft clay, A National Conference on Corrective Engineering Practices in Troublesome Soils (CONCEPTS), Kakinad4 8-9 luly, 2006, 187 -190.
[12] Saran, S. (2010). “Reinforced soil and its engineering applications”, I.K. International Publishing House Pvt . Ltd., New Delhi. [13] Singh, V.K. (1991), Strength and deformation characteristics of sand reinforced with geotextiles, M.E. dissertation, IIT, Roorkee, India.
[14] Singh, H.P. (2009), Liquefaction studies of composite materials, Ph.D. thesis, IIT, Roorkee, India.
[15] Singh, H.P.,Sharma, A.,and Chanda, N.(2011), “Study Of Strength Characteristics of Coir Fiber- Reinforced Soil” International Conference on Advances in Material and Techniques for Infrastructure Development(AMTID 2011), held at NIT Calicut Kerala ,India, Paper No.: G002, 28-30 September.
[16] Singh, H.P. (2012), Improvement in CBR value of soil reinforced with Jute Geotextile layers, International Journal of Earth Sciences and Engineerin, 05(02), 1438 -1442.
[17] Singh, H.P. and Bagra, M. (2013). “Improvement in CBR Value of Itanagar Soil Reinforcement with Jute Fiber”, International Journal of Innovative Research in Science, Engineering and Technology, 2 (8), 3447-3452.
[18] Sivakumar Babu, G.L., and Vasudevan, A.K. (2008), Strength and Stiffness Response of Coir -Reinforced Tropical Soil, Journal of Materials in Civil Engineering, ASCE/September2008/571-578.
[19] Talwar, D.V. (1981), Behaviour of reinforced earth in retaining structures and shallow foundations, Ph.D. thesis, IIT, Roorkee, India.