Automatic Red Blood Cell Counting using
Watershed Segmentation
Sumeet Chourasiya
M. Tech. Scholar, Department of Electronics and Communication Engineering
Jagadguru Dattatray College of Technology, Indore (M.P.), India
G Usha Rani
Asst. Prof.,Department of Electronics and Communication Engineering
Jagadguru Dattatray College of Technology, Indore (M.P.), India
Abstract— The major issue in clinical laboratory is to produce
a precise result for every test especially in the area of Red Blood Cell (RBC) count. The number of red blood cell is very important to detect as well as to follow the treatment of many diseases like anaemia, leukaemia etc. Red blood cell count gives the vital information that help diagnosis many of the patient’s sickness. The old conventional method of RBC counting under microscope gives an unreliable and inaccurate result depends on clinical laboratory technician skill. This method puts a lot of strain on the technician. Another method for RBC counting uses the automatic hematology analyzer, this machine is very costlier. So it is not possible all the hospital’s clinical laboratory implement such an expensive machine to count the blood cell in their laboratory. This paper introduces an efficient and cost effective computer vision system for automatic red blood cell counting using image based analysis.
Keywords— Health care applications, Red Blood Cell count, MATLAB, Morphological operations, Hough Transform.
I. INTRODUCTION
Content-based image indexing and retrieval has been an important research area in computer science for the last few decades. Many digital images are being captured and stored such as medical images, architectural, advertising , design and fashion images, etc. As a result large image databases are being created and being used in many applications. In this work, the focus of our study is on medical images. A large number of medical images in digital format are generated by hospitals and medical institutions every day. Consequently, how to make use of this huge amount of images effectively becomes a challenging problem [1]. In the field of biomedicine, because of cell’s complex nature, it still remains a challenging task to segment cells from its background and count them automatically [2-5].Among all of the body’s tissues, blood is unique due toits existence as the only fluid tissue. A blood cell can be anytype of cell normally found in blood which falls into fourcategories which are red blood cell (RBC), white blood cell(WBC), platelet and plasma [6]. The differences betweenthese groups lie on the texture, color, size and morphologyof nucleus and cytoplasm. In blood smear, number of redcells is many more than white blood cells. For example animage may contain up to 100 red cells and only 1 to 3 whitecells. Platelets are small particles and are not clinicallyimportant [7]. Blood cells form in the bone marrow, the softmaterial
in the center of most bones. Leukocytes or WBCare cells involved in defending the body against infectiveorganisms and foreign substances. Leukocytes cells containinggranules are called granulocytes (composed by neutrophil,basophil, eosiphil). Cells without granules are calledagranulocytes (lymphocyte and monocyte) [6].These cellsprovide major defense against infections in organisms andtheir specific concentrations can help specialists to discriminatethe presence or the absence of very importantfamilies of pathologies [8]. When infection occurs, the productionof WBCs increases [6]. Abnormal high or lowcounts may indicate the presence of many form of disease,since blood counts are amongst the most commonly performedblood test in medicine.
Table 1: Normal Blood Count Differentiate by Gender
Blood Cell Types
Gender
Men Women
RBX Million/micro liter 5.4-6.0 Million/micro liter 4.0-5.0
WBC Thousand/micro liter 4.5-11 Thousand/micro liter 4.5-11
Platelet Thousand/micro liter 150-450 Thousand/micro liter 15.0-45
Hematocrit 42%-50% 36%-45%
Hemoglobin Grams/100 milli liters 14-17 Grams/100 milli liters 12-15
II. IMAGE SEGMENTATION
In the segmentation process, morphological technique is major used because the mathematicalmorphology offers a powerful tool for segmenting images and useful to describe the region shape,such as boundaries, skeletons and texture. The first method in this process divides saturation, Simage into two images output by applying the thresholding process. Thresholding is one of themethods to extract and segment the object from the background by selecting any point, T [15].
Any point for which is called an object point, otherwise the point is calledbackground point. Thresholding normally results in binary image and the mathematically; the operation can be expressed as;
T y x f if
T y x f if y
x g
) , ( ... ... 0
) , ( ... ... 1 ) ,
(
where the pixels labeled 1 is corresponded to object whereas the pixels labeled 0 arecorresponding to the background.
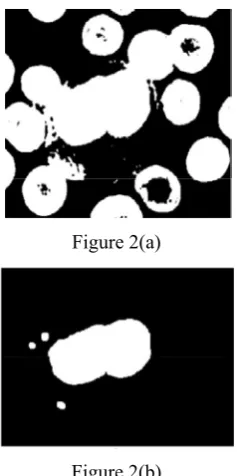
Figure 2(a)
Figure 2(b)
(a) Morphological area closing on lower pixel value image. (b) Morphological dilationand area closing on higher pixel
value image.
Jianhua et al. [21] stated that in the case of cell segmentationfor blood, edge detection performs poorly on cell imagesbecause not all boundaries are sharp and it is difficultto get all edge information and locate cells accurately. Theydeveloped an iterative Otsu’s approach based on circularhistogram for the leukocyte segmentation. Otsu’s approachis generalized on the base of least square method.R. Sukesh Kumar et al. [22] discussed about an approachfor color image segmentation using higher order entropy asa textural feature for determination of thresholds over a twodimensional image histogram. Two basic models for colorimages are the RGB (Red, Green, Blue) color model and theHIS (Hue, intensity, saturation) color model. Two methodsof color image segmentation used RGB space as the standardprocessing space. These techniques might be used inblood cell image segmentation. Color images are very richsource of information, because they provide a better descriptionof a scene as compared to grayscale images.Hence, color segmentation becomes a very important issue[22].Khoo Boon et al. [23] performed comparisons betweennine image segmentation which is gray level thresholding,pattern matching, morphological operators, filtering operators,gradient-in method, edge detection operators, RGBcolor thresholding, color matching and HSL (hue, saturation,lightness) and color thresholding techniques on RBCand concluded that there is no single method can be consideredgood for RBC segmentation [23].
In image enhancement process, there are two common image processing techniques used in orderto reduce the noise and at the same time to enhance the image. Figure 3 shows the flow process inenhancement processing which are analyses in hue-saturation value color space (HSV) and thegreen component image. For HSV, we proceed with analyses in saturation component, S, becausethis S image show clearly the bright objects such as white blood cell and parasites, therefore, it'seasy to distinguish the red blood cells with another cell.
Figure 3: Image Enhancement III. COUNTING METHODS
of each pixel on an edge from the center. Heidi Berge [10] has purposed thesegmentation red blood cells in a thin blood smear image which is based on the Zack’s Method[11]. This method is one of the approached to determine the red blood cells tresholding where aline is drawn between the two peaks and between these two peaks, they used the point which isfurthest from the drawn line as a threshold for red blood cell. In the conclusion for this technique,the segmentation result is better to the blood smear which in case red blood cells is sparse and inthe image. However, in images with high Red blood cell concentrations, large clumps may resultand this method is less accurate. Guitao et. al [12] purposed the Hough transform in detecting andextracting the red blood cells in the urine micrograph. Based on Hough transform, Guitao hasused the geometrical feature to detect the circle center in the image.
Haider Adnan Khan et al. presented a framework for cell segmentation and counting by detection of cell centroidsin microscopic images [16]. Preprocessing is done with Contrast-Limited Adaptive Histogram Equalization to getenhanced image. Next, cells are separated from background using global thresholding. Then, distance transform ofbinary image is computed which converts binary image into distance map indicating distance of every cell pixelfrom its nearest background pixel. In order to perform template matching, the template image is generated from thedistance transform of circular disk. Distance map is used to identify the cell centroids. The template matching isdone using normalized cross-correlation between template and distance map. Finally, the similarity matrix iscomplemented and all background pixels are set to -∞. The watershed transform is then applied on thiscomplemented similarity matrix. This splits the similarity matrix into separate disjoint regions. Each region islabeled and counted to get the count. The experimental results show excellent accuracy of 92 % for cell countingeven at very high 60 % probability.
Watcharin et al. proposed an algorithm to count blood cells in urine sediment using ANN and hough transform [17].First step of algorithm is the segmentation between background and blood cells by using feedforwardbackpropagation algorithm. For training neural network, the input is Hue, Saturation, Value and standarddeviation. After deriving output from feedforward backpropagation, salt and pepper noise is eliminated by usingmorphological opening and closing method. Last step is blood cell counting using circular hough transform.Experimental results show the average percentage of error of RBCs and WBCs detection 5.28 and 8.35respectively.
6. J. G. A. Barbedo presented a method for counting of microorganisms that use a series of morphological operationsto create a representation in which objects of interest are easily isolated and counted [18]. First step of this method isRGB to gray conversion. After that, two-dimensional median filter is applied, in order to eliminate noise and otherartifacts. Ideal size of the neighborhood over which filter should be applied depends on three main
factors: size ofobjects of interest, size of spurious artifacts and resolution of the image. The program has two approaches fordeciding neighborhood. In the first approach, user enters estimate of diameter of objects and artifacts. In the secondapproach, estimation using multiple counts is done. Then, contrast is adjusted in such a way the brightest pixelassumes the full-scale value 255 and darkest pixel equal to zero. In following, the algorithm verifies if thebackground is brighter or darker than the objects. If the background is brighter, a complement operation isperformed. The image is then submitted to top-hat morphological filtering. Image is binarized with threshold in128. After that object counting becomes trivial. By observing results, it can be seen that, except for the case ofmerged objects, the method identifies the objects correctly in more than 90 % of the cases, and the number of falsepositives is always low. The overall deviation was 8 %; such a number falls to 2.5 % if the images with mergedobjects are not taken into account.
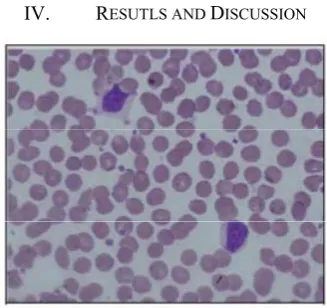
IV. RESUTLS AND DISCUSSION
Figure 4: Original Image of Blood for 40X object When the operation of masking is applied, the maskedimage has diminished the WBC nucleus morphological view.After morphological operation involving binary erosion andfilling holes, the RBC can be viewed accordingly. In thisstudy, masking has been used to remove WBC and platelet issubstracted by morphological operators. The left one will beRBC which represent the RBC segmentation. Figure 5 showsthe result of the RBC segmentation from the elimination ofWBC nucleus and small particles including platelets.
Figure 5: a) Segmented WBC nucleus b) RBC segmentation from theelimination of WBC nucleus and
small particles.
operation,gradient magnitude and marker controlled watershedalgorithm. The result from erosion on RBC segmentationresult and gradient magnitude has being used together as maskwith watershed algorithm to form marker controlled watershedalgorithm. This could avoid oversegmentation which oftenoccurs for watershed algorithm. After dilation, it being usedtogether with LoG edge detection on the Ycbcr secondcomponent of the image as mask and segmented RBC asmarker. Lastly, it being superimpose to the original image. The result of [19] is given in figure 6.
Figure 6: a) Separation of overlapping cell b) Superimpose on originalimage.
The circular hough transform is applied to the contrast adjustedimage by some of researchers.
Figure 7(a) Microscopic Image and (b) Green Plane Extraction – I
Figure 7(c) Contrast adjustment-1 and (d) Accumulation array-1
Figure 7(e) Detected blood cells-1 and (f) Binary image-1
Figure (g) Holes filled-1 and (h) Borders cleared-1
Figure 7(i) Labelled Image
The results of the image can be used as good input in determining the number of red blood cellsby using Hough transform technique. By using the MATLAB, all the importance’s aspects likecorrect algorithm and system has been successfully produced. With correct algorithm, the redblood cells can be detected and segmented as well as estimated the number of the red blood cells.Through system created using MATLAB, it also enable the study of the morphological featuresof the red blood cells image, thus, can determine whether the person is normal or otherwise byreferring amount of red blood cells in human blood [15].
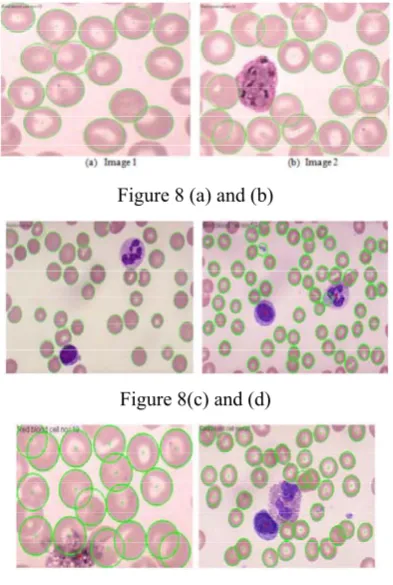
Figure 8 (a) and (b)
Figure 8(c) and (d)
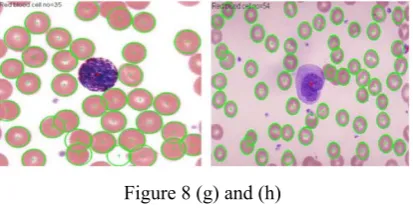
Figure 8 (g) and (h)
Figure 8: results of 8 samples of red blood cells after performing Hough transformtechnique.
Object counting using image processing has huge applications where automation is to be introduced and time ofcounting is to be reduced. Some of the main applications of object counting in industrial systems are packaging, qualitycontrol, and so on. It is helpful in the research areas where objects are of very small size. Object counting algorithm canbe also used to track and identify objects. The present methods can be extended to have counting system based on userselectedattributes.
V. CONCLUSION
Image processing techniques are helpful for object counting and reduce the time of counting effectively. Properrecognition of the object is important for object counting. The accuracy of the algorithm depends on camera used, sizeof objects, whether or not objects touching and illumination conditions.
REFERENCES
[1] Lehmann T.M., Wein B., Dahmen J., Bredno J., Vogelsang F. & Kohnen M. : Content based image retrieval in medical applications : a novel multi step approach. International Society for Optical Engineering (SPIE), 3972, pp.312-320.(2000)
[2] Dwi Anoragaingrum : Cell segmentation with median filter and mathematical morphology operation, proceeding of the IEEE 10th International Conference on Image Analysis and Processing (ICIAP), pp. 1043-1046 (1999).
[3] Keng Wu et al.: Live cell image segmentation, IEEE Trans on Biomedical Engineering, 42(1), pp.1-12.(1995).
[4] Mark B. Jeacocke, Brian C. Lovell : A Multi-resolution algorithm for Cytological image segmentation, The second Australian and New Zealand conference on intelligent information systems, 322-326 (1994).
[5] Choi H, Baraniuk R., Multiscale : Image segmentation using wavelet-domain hidden Markov models, IEEE Transaction on image processing, 10(9), pp.1309-1321 (2001).
[6] H Elaine N. Marieb (2006): Essentials of Human Anatomy & Physiology, 8th ed. Pearson Benjamin Cummings
[7] Fatemeh Zamani, Reza Safabakhhsh: “An Unsupervised GVF Snake Approach for White Blood Cell Segmentation Based on Nucleus”, Signal Processing, The 8th International Conference on Volume 2, 2006.
[8] Vincenzo Piuri, Fabio Scotti: “Morphology Classification of Blood Leucocytes by Microscope Images”, IEEE International Conference on Computitional Intelligence for Measurement Systems and Applications, Boston, MA, USA, 14-16 July 2004.
[9] Ramin Soltanzadeh. “Classification of Three Types of Red Blood Cells in Peripheral Blood Smear Based on Morphology. Proceedings of ICSP, 2010.
[10] Heidi Berge, Dale Taylor, Sriram Krishnan, and Tania S. Douglas. Improved Red Blood Cell Counting in thin Blood Smears. Proceedings of ISBI, 2011. pp.204-207.
[11] Zack G.W., Rogers W.E. and Latt S.A. “Automatic-measurement of sister chromatid exchange frequency.” Journal of Histochemistry & Cytochemistry 25, 1977, 741-753.
[12] Guitao Cao, Cai Zhong,Ling Li and Jun Dong. “Detection of Red Blood Cell in Urine Micrograph”. The 3rd International Conference on Bioinformatics and Biomedical Engineering (ICBBE). 2009. [13] Roy A. Dimayuga, Gerwin T. Ong, Rainier Carlo S. Perez,
Gefferson O. Siy, Saman C. Sohrabi Langroudi and Miguel O.Gutierrez. “Leukemia Detection Using Digital Image Processing in Matlab”. ECE Student Forum, De La Salle University, Manila. March 26, 2010.
[14] Miswan, M. F., et al. "An Overview: Segmentation Method for Blood Cell Disorders" 5th Kuala Lumpur International Conference on Biomedical Engineering 2011 Springer Berlin Heidelberg, 2011 [15] Mahmood, Nasrul Humaimi, and Muhammad Asraf Mansor. "Red
blood cells estimation using Hough transform technique." Signal & Image Processing: An International Journal (SIPIJ) 3.2 (2012): 53-64.
[16] Haider Adnan Khan and Golam Morshed Maruf, “Counting Clustered Cells using Distance Mapping,” 2013 International Conference on Informatics, Electronics and Vision (ICIEV), May 2013. pp. 1-6.
[17] Watcharin Tangsuksant, Chuchart Pintavirooj, Somchart Taertulakarn, Somsri Daochai, “Development Algorithm to Count Blood Cells in Urine Sediment using ANN and Hough Transform,” The 2013 Biomedical Engineering International conference, Oct. 2013. pp. 1-4
[18] Jayme Garcia Arnal Barbedo, “Method for Counting Microorganisms and Colonies in Microscopic Images,” 12th Int. Conf. Computer Science and Its Applications, June 2012. pp. 84-87. [19] Sharif, J. MISWAN, et al. "Red blood cell segmentation using