Statistical Optimization of Biosorption of
Hexavalent Chromium Using Water Hyacinth
Ashwin Shenoy
1, Jagadish H Patil
2, M A L Antony Raj
3, Sudhanva M Desai
4M Tech Student, Department of Chemical Engineering, R V College of Engineering, Bengaluru, Karnataka, India1
Associate Professor, Department of Chemical Engineering, R V College of Engineering, Bengaluru, Karnataka, India2
Professor, Department of Chemical Engineering, R V College of Engineering, Bengaluru, Karnataka, India3 Associate Professor, Department of Biotechnology, D S College of Engineering, Bengaluru, Karnataka, India4
ABSTRACT:Several industrial operations release Hexavalent Chromium as a leading toxin. In this study aquatic weed Water hyacinth in crude and completely pyrolysed forms were used for the reduction of hexavalent chromium concentration from synthetic waste water. The biosorption experiments were performed in batch operation. Response Surface Methodology is used to optimize process parameters. A quadratic model was developed to correlate the variables to the response based on central composite design. Statistical tools were used to identify the most significant factor for all the adsorbents. Through Analysis of Variance (ANOVA) it was found that pH and biomass loading are significant for water hyacinth powder and concentration is significant for pyrolysed adsorbent. Between both the adsorbents, pyrolysed water hyacinth adsorbed maximum chromium of 99.24% at optimized conditions pH 1.924, temperature of 400C, initial concentration 133.607 mg/l and biomass loading of 8.041g/ 100ml.
KEYWORDS: Biosorption, Water Hyacinth, Hexavalent chromium, Pyrolysis
I. INTRODUCTION
Waste water from industries containing heavy metals causes danger to human beings and other forms of fauna. Conventional methods used for removal of heavy metals from waste water are often too expensive and have poor efficiencies at low metal concentrations. In the recent years the biosorption of metal ions has received considerable attention for the development of an efficient, clean, cheap and sustainable technology for waste water treatment at low metal concentrations. Chromium in aqueous system occurs in two forms, trivalent chromium (Cr (III)) and hexavalent chromium (Cr (VI)). Chemical, biological and environmental characters exhibited by both the forms of chromium are diverse and distinct [1]. Cr (III) is essential trace metal nutrient required for microorganisms in minute quantities [2], whereas Cr (VI) is all types of fauna and flora [3-5]. Huge quantities of chromium is discharged into the water bodies from various industries such as electroplating, leather tanning, mining, paints and pigments [6-8]. Due to threat caused by chromium to environment and mankind, permissible limits of chromium have been closely monitored and regulated by most industrial countries. Industrial effluents generally contain chromium concentration in the range 0.5 to 270 mg/l [7]. The maximum value for chromium into inland surface water and potable water is 0.1 and 0.05 mg/l respectively [9, 10].
of the effects of parameters and optimizing the parameters for maximum removal of chromium. The research work aims to quantify the biosorption of chromium by water hyacinth and use RSM to optimize the variables for maximum uptake of chromium.
II. MATERIALSANDMETHODS
A. Preparation of Biosorbent
1) Water Hyacinth Collection
Natural agro waste biosorbent Eichhornia crassipes collected from Kengeri Lake situated in Bengaluru district, Karnataka were used for removal of chromium. Natural biosorbent along with pyrolysis process were employed for comparative metal removal efficiency.
2) Crude Water Hyacinth (WH)
Water hyacinth was washed, sun dried then dried in oven at 600C, powdered, sieved using 90/120 mesh BSS Standard sieve to get uniform sized particles. The fraction that was retained on 120 meshes were collected, washed gently with distilled water and dried in the hot oven for 2 hours at 80 ºC.
3) Preparation of Activated Carbon by Pyrolysis (WHP)
The activated carbon was prepared by complete pyrolysis using crude Water hyacinth in a muffle furnace. The complete pyrolysis Water hyacinth (WHP) adsorbent is obtained by just keeping the crucible in the muffle furnace.
B. Preparation of Chromium Stock Solution
Preparation of Synthetic chromium solution includes dissolving 2.828g of potassium dichromate (K2Cr2O7) in 1000ml double distilled water. 1000 ppm of stock chromium solution was prepared. The stock solution was diluted to prepare other required concentrations. Thenadjustment of pH of the solution was done to the required value.
C. Preparation of Diphenylcarbazide (DPC) Solution
Preparation ofDiphenylcarbazide (DPC) solution includes dissolving of 250mg of DPC in 50ml of acetone.
D. Analysis of Chromium
0.25ml of phosphoric acid was added to 1ml of standard sample containing known concentration of chromium, pH was adjusted to 1.0±0.3 using 0.2N sulphuric acid. The solution was mixed well and then diluted to 100ml in a volumetric flask using double distilled water. Further 2ml of DPC solution was added and mixed well. After full colour development for 10min, 4ml of this solution was used in an absorption cell and the concentrations were measured spectrometrically at 540nm in UV-double beam spectrophotometer. By measuring the absorbance,the calibration curve was drawnfor different known concentrations of chromium solutions and plotting a graph between concentrations versus absorbance. A straight line is obtained with R2 of 0.9965.
E. Initial Experiments
The initial experiments were conducted to fix limits of the parameters to be varied. Maximum chromium removal is observed with the range of initial metal ion concentrations of 10 – 250 ppm, pH 1-7, temperature 30-50oC and biosorbent dosage of 1 - 10 g/100 ml. These ranges of variables were employed for further study.
F. Design of Experiments using Central Composite Design (CCD)
how the removal efficiency is influenced by independent variables, pH (X1), temperature (X2), Initial metal ion concentration (X3) and biosorbent dosage (X4). The maximum removal efficiency (Z) is the dependent output variable [25].
G. Response Surface Methodology (RSM)
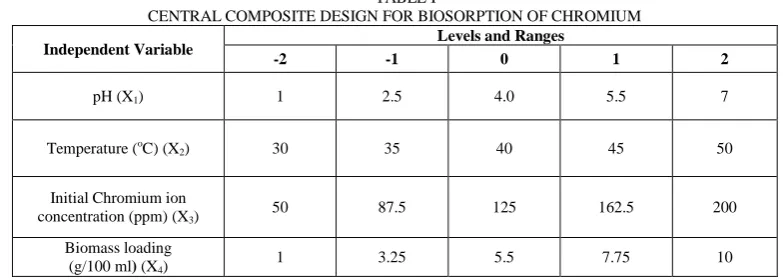
Response surface methodology is a statistical toolwhich is used for multiparameter regression analysis by using quantitative information obtained from well-designed experiments to solve multivariate equations at the same time. The independent variables pH, metal ion concentration, temperature and adsorbent dosage were considered for the removal of chromium in CCD.
TABLE I
CENTRAL COMPOSITE DESIGN FOR BIOSORPTION OF CHROMIUM
Independent Variable Levels and Ranges
-2 -1 0 1 2
pH (X1) 1 2.5 4.0 5.5 7
Temperature (oC) (X
2) 30 35 40 45 50
Initial Chromium ion
concentration (ppm) (X3) 50 87.5 125 162.5 200
Biomass loading (g/100 ml) (X4)
1 3.25 5.5 7.75 10
A second order polynomial equation is shown inequation 1. The regression analysis of the polynomial equation was performed to estimate the response function.
Z=δ0+δ1X1+δ2X2+δ3X3+δ4X4+δ11X12+δ22X22+δ33X32+δ44X42+δ12X1X2+δ13X1X3+δ14X1X4+δ23X2X3+δ24X2X4
+δ34X3X4 ……… (1)
Where,X1, X2, X3, X4are linear effects,
X12, X22, X32, X42are squared effects,
X1X2, X1X3, X1X4, X2X3, X2X4, and X3X4 are interaction effects and Z is the predicted response.
δ0 is constant coefficient, δ1, δ2, δ3, δ4 are linear coefficients, δ11, δ22, δ33, δ44are squared coefficients, and δ12, δ13, δ14,
δ23, δ24, δ34 are interactive coefficients, respectively.
Estimation of the coefficients of the regression equation and obtaining regression analysis was performed using a statistical software package Minitab 16. The statistical test called Analysis of Variance (ANOVA) was used to validate the equations. In each case estimating the goodness of fit was the importance of each term in the equation. Response surface was used to understand the linear, square and interactive effects of test variables on percentage removal of chromium.
H. Batch Experiments
Batch adsorption studies were performed by shaking 100 ml of different solutions in 250 ml conical flasks with cork lid in constant temperature shaker at the conditioned mentioned by central composite design to obtain the equilibrium data. The experiments were conducted in triplicate and the values obtained were averaged. After specified time interval, the samples were analysed by the spectrophotometric method.
I. Optimization of Parameters
III.RESULTSANDDISCUSSION
A. Central Composite Design Analysis[CCD]
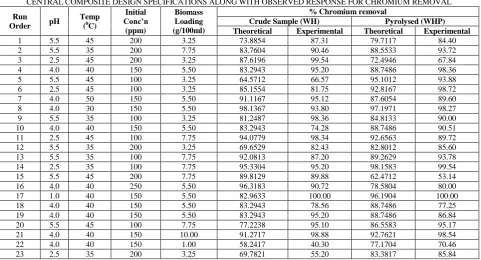
According to the CCD analysis, the results of experiments executed are tabulated in Table II. Table II gives the experimental results along with the expected values for two adsorbents WH and WHP. It may be observed from Table 2 that the percentage removal is higher at lower pH. In acidic pH, the biosorbent surface may be protonated and hence the positively charged biosorbent removes higher amounts of Chromium in the anionic form HCrO4-. Further, the effect of temperature is significant on pyrolysed type of adsorbent suggests that the biosorption between chromium and pyrolysed water hyacinth is because of chemical interaction and physical adsorption. With the temperature increment, more surface area obtained for diffusion and adsorption by enlargement of the pores in the adsorbent [26].
B. Response Surface Methodology (RSM)
Analysis of regression was done to fit the response function as per the equation 1 and the results are reported as eq.2 and eq. 3 for WH, WHP respectively.
Y=83.294-6.746X1-0.745X2-1.464X3+8.275X4-3.455X12- 4.083X22+3.988X32-2.134X42 -3.104X1X2+1.712X1X3
-1.567X1X4+5.227X2X3+0.455X2X4 +0.819X3X4
..…. (2)
Y=88.748-4.169X1-3.398X2-5.258X3+3.898X4—2.724X12+1.413X22+ 0.087X32-0.946X42-0.551X1X2-1.267X1X3-4.597X1X4
-5.844X2X3-3.248X2X4 +0.326X3X4 ……(3)
These above equations explain the effect of individual variable (linear and squared) and interactive effects on Chromium adsorption onto different adsorbent. The chromium removal was predicted using eq.2 & eq.3 at experimental parameters and the obtained values are also reported in Table II.
TABLE II.
CENTRAL COMPOSITE DESIGN SPECIFICATIONS ALONG WITH OBSERVED RESPONSE FOR CHROMIUM REMOVAL
Run
Order pH
Temp (0C)
Initial Conc’n
(ppm)
Biomass Loading (g/100ml)
% Chromium removal
Crude Sample (WH) Pyrolysed (WHP)
Theoretical Experimental Theoretical Experimental
1 5.5 45 200 3.25 73.8854 87.31 79.7117 84.40
2 5.5 35 200 7.75 83.7604 90.46 88.5533 93.72
3 2.5 45 200 3.25 87.6196 99.54 72.4946 67.84
4 4.0 40 150 5.50 83.2943 95.20 88.7486 98.36
5 5.5 45 100 3.25 64.5712 66.57 95.1012 93.88
6 2.5 45 100 3.25 85.1554 81.75 92.8167 98.72
7 4.0 50 150 5.50 91.1167 95.12 87.6054 89.60
8 4.0 30 150 5.50 98.1367 93.80 97.1971 98.27
9 5.5 35 100 3.25 81.2487 98.36 84.8133 90.00
10 4.0 40 150 5.50 83.2943 74.28 88.7486 90.51
11 2.5 45 100 7.75 94.0779 98.34 92.6563 89.72
12 5.5 35 200 3.25 69.6529 82.43 82.8012 85.60
13 5.5 35 100 7.75 92.0813 87.20 89.2629 93.78
14 2.5 35 100 7.75 95.3304 95.20 98.1583 99.54
15 5.5 45 200 7.75 89.8129 89.88 62.4712 53.14
16 4.0 40 250 5.50 96.3183 90.72 78.5804 80.00
17 1.0 40 150 5.50 82.9633 100.00 96.1904 100.00
18 4.0 40 150 5.50 83.2943 78.56 88.7486 77.25
19 4.0 40 150 5.50 83.2943 95.20 88.7486 86.84
20 5.5 45 100 7.75 77.2238 95.10 86.5583 95.17
21 4.0 40 150 10.00 91.2717 98.88 92.7621 98.54
22 4.0 40 150 1.00 58.2417 40.30 77.1704 70.46
24 4.0 40 150 5.50 83.2943 87.84 88.7486 89.52
25 4.0 40 50 5.50 92.1750 97.44 99.6121 97.26
26 7.0 40 150 5.50 55.9800 28.61 69.5121 54.77
27 2.5 35 200 7.75 90.1596 95.20 97.5162 98.60
28 4.0 40 150 5.50 83.2943 70.46 88.7486 89.24
29 4.0 40 150 5.50 83.2943 81.52 88.7486 89.52
30 2.5 35 100 3.25 88.2279 95.20 80.3262 79.52
31 2.5 45 200 7.75 95.8171 96.00 83.6367 89.52
Multiple regression coefficient R2 is calculated from the second degree polynomial equation (equation 2 and 3), is R2=0.8410 for WH and R2=0.8872 for WHP indicates that the predicted values are closer to experimental data as shown in Table II. If R2 value is closer to 1, then it is a good statistical model. The R2 value is 0.8410 indicates that 84.10% of experimental data was well-suited with the model and the variations of 15.90% are not described by the model [27].
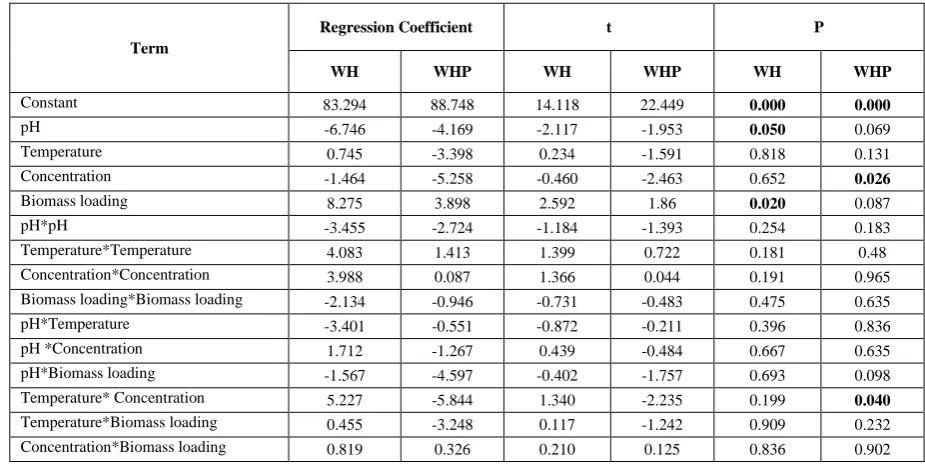
The experimental results were analysed and”t” test was conducted to find the importance of individual parameters, squared parameters and interactive parameters combination. Table III summarises the regression coefficients, „t„ test results and probability values.Lesser the probability value more weightage is the effect. The results show that pH and biomass loading are significant for crude water hyacinth (probability value, p=0.000) whereas concentration and temperature*concentration interactive effect becomes significant for pyrolysed water hyacinth.
TABLE III.
STUDENT “T” TEST ANALYSIS FOR BIO SORPTION OF CHROMIUM
Term
Regression Coefficient t P
WH WHP WH WHP WH WHP
Constant 83.294 88.748 14.118 22.449 0.000 0.000
pH -6.746 -4.169 -2.117 -1.953 0.050 0.069
Temperature 0.745 -3.398 0.234 -1.591 0.818 0.131
Concentration -1.464 -5.258 -0.460 -2.463 0.652 0.026
Biomass loading 8.275 3.898 2.592 1.86 0.020 0.087
pH*pH -3.455 -2.724 -1.184 -1.393 0.254 0.183
Temperature*Temperature 4.083 1.413 1.399 0.722 0.181 0.48
Concentration*Concentration 3.988 0.087 1.366 0.044 0.191 0.965
Biomass loading*Biomass loading -2.134 -0.946 -0.731 -0.483 0.475 0.635
pH*Temperature -3.401 -0.551 -0.872 -0.211 0.396 0.836
pH *Concentration 1.712 -1.267 0.439 -0.484 0.667 0.635
pH*Biomass loading -1.567 -4.597 -0.402 -1.757 0.693 0.098
Temperature* Concentration 5.227 -5.844 1.340 -2.235 0.199 0.040
Temperature*Biomass loading 0.455 -3.248 0.117 -1.242 0.909 0.232
Concentration*Biomass loading 0.819 0.326 0.210 0.125 0.836 0.902
C. Analysis of Variance (ANOVA)
TABLE IV.
ANALYSIS OF VARIANCE (ANOVA) FOR THE SELECTED QUADRATIC MODEL FOR THE REMOVAL OF CHROMIUM
Source DF Sum of Squares F Prob>F
WH WHP WH WHP WH WHP WH WHP
Regression 14 14 5070.47 3126.07 1.49 2.04 0.222 0.086
Linear 4 4 2793.39 1722.50 2.87 3.94 0.005 0.002
Square 4 4 1554.48 318.11 1.59 0.73 0.224 0.586
Interaction 6 6 722.60 1085.46 0.49 1.65 0.803 0.197
Residual
error 16 16 3898.72 1750.47
Total 30 30 8969.19 4876.54
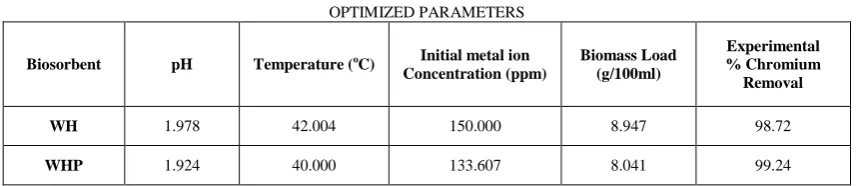
D. Optimization of Response
The optimization of process variables are done to get maximum % removal using response optimizer in Minitab 16. In this regard second degree polynomial equations (eq.2 and eq.3) were used to get the optimum values for the variables. Table V gives the optimum values for all adsorbents. Maximum chromium removal of 99.24% was achieved with water hyacinth activated carbon at initial metal concentration of 133.607 ppm, pH of 1.924, temperature of 40 °C and lowest biomass loading of 8.041 g/100 ml
.
TABLE V. OPTIMIZED PARAMETERS
Biosorbent pH Temperature (oC) Initial metal ion
Concentration (ppm)
Biomass Load (g/100ml)
Experimental % Chromium
Removal
WH 1.978 42.004 150.000 8.947 98.72
WHP 1.924 40.000 133.607 8.041 99.24
IV.CONCLUSION
In the present work biosorption of chromium was studied in batch experiments using three types of biosorbent derived from tamarind fruit shell. To study the effect of parameters variation like pH, temperature, initial chromium concentration and adsorbent dosage was studied using Central composite design. For all the adsorbents, it is observed from the student “t” test that for non- pyrolysed type of adsorbents, pH was significant and the temperature becomes significant for pyrolysed samples. ANOVA analysis reveals that for all the adsorbents linear effect was significant and for crude tamarind square effect is also significant. A regression coefficient of 0.8612 from ANOVA shows that the regression model with second order satisfactorily fits with the experimental data. The optimization of process variables indicates that crude tamarind removed maximum chromium of 99.24% with initial metal concentration of 133.607 ppm, pH of 1.924, temperature of 40 °C and lowest biomass loading of 8.041 g/100 ml. The study clearly demonstrating the use of water hyacinth activated carbon may be used to treat a chemical waste containing chromium.
REFERENCES
[1] “Chromium, Environmental Health Criteria 61”, World Health Organization, WHO, Geneva, 1988. [2] Saner. G, “Chromium in Nutrition and Disease”, Alan R Liss Inc., New York, 1980.
[3] “Toxicological Profile for Chromium”, Public Health Services Agency for Toxic Substances and Diseases Registry, US. Department of Health and Human Services,Washington.DC, 1991.
[5] Raji.C, Anirudhan. T.S, “Batch Cr (VI) removal by polyacrylamide-grafted sawdust Kinetics and Thermodynamics”, Water Res., 32, pp.3772– 3780, 1998.
[6] Udy. M.J, “Chromium”, Reinhold Publishing Corporation, New York, 1956.
[7] Casarett. L.J,and Doul. J., Toxicology, the basic science of poisons, Macmillan, New York, 1980. [8] Nriagu. J.O and Nieboer. E., Chromium in the Natural and Human Environment, Wiley, New York, 1988.
[9] Environmental Pollution Control Alternatives. Environmental Protection Agency, EPA/625/5–90/025, EPA/625/4-89/023, Cincinnati, US, 1990.
[10] Drinking water - specification (first revision), Indian Standard, IS 10500, 1991.
[11] Zhou. X, Korenaga. T, Takahashi. T, Moriwake. T, and Shinoda.S,”A process monitoring/controlling system for the treatment of wastewater containing chromium (VI)”, WaterRes, 27, pp. 1049–1054, 1993,
[12] Tiravanti. G, Petruzzelli. D, and Passiono. R., “Pretreatment of tannery wastewaters by an ion exchange process for Cr(III) removal and recovery”, Water Sci. Technol., 36, pp. 197–207, 1997.
[13] Kongsricharoern. N, Polprasert. C., “Chromium removal by a bipolar electrochemical Precipitation process”, Water Sci. Technol., 34, pp. 109–116, 1996.
[14] Seaman .J.C, Bertsch.P.Mand Schwallie. L., “In situ Cr(VI) reduction within coarse-textured,oxide-coated soil and aquifer systems using Fe(II) solutions”, Environ. Sci. Technol., 33, pp. 938–944, 1999.
[15] Calace.N, Muro.D.A, Nardi. E, Petronio. B.M, and Pietroletti.M., “Adsorption isotherms for describing heavy metal retention in paper mill sludges”, Ind. Eng. Chem. Res., 41, pp. 5491-5497, 2002.
[16] Pagilla.K, Canter. L.W., “Laboratory studies on remediation of chromium contaminated Soils”, J. Environ. Eng., 125, pp. 243–248, 1999. [17] Chakravarti. A.K, Chowdhury. S.B, Chakrabarty. S, Chakrabarty. T and Mukherjee. D.C.,”Liquid membrane multiple emulsion process of
chromium (VI) separation from waste Waters”, Colloids Surf. A. Physicochem. Eng. Aspects, 103, pp. 59–71, 1995. [18] Lin.C.F, Rou. W, and Lo. K.S., “Treatment strategy for Cr(VI) bearing wastes”, Water Sci.Technol., 26, pp. 2301–2304, 1992.
[19] Aksu. Z, and Kutsal.T. A., “Comparative study for biosorption characteristics of heavy metal Ions with C. vulgaris”, Environ. Technol., 11, pp. 979–987, 1990.
[20] Aksu. Z, Ozer.D, Ekiz. H, Kutsal.T,andCalar.A.,” Investigation of biosorption of chromium(VI) on C. crispate in two staged batch reactor”, Environ. Technol., 17, pp. 215–220, 1996.
[21] Bailey. S.E, Olin.T.J, Bricka,R.M, and Adrian. D.D., “A review of potentially low cost Sorbents for heavy metals”, Water Res., 33, pp. 2469– 2479, 1999.
[22] Ravikumar.K, Pakshirajan.K, Swaminathan.T, Balu.K, “Optimization of batch process parameters using response surface methodology for dye removal by a novel adsorbent”, Chem.Eng.J., 105,131-138, 2005.
[23] Korbathi.B.K, “Response surface optimization of electrochemical treatment of textile dye wastewater” .J. Hazard. Mater,145, pp. 277-286, 2007.
[24] Aleboyeh.A, Daneshvar,N, and asiri.M.B.,”Optimization of C.I.Acid Red 14 azo dye removal by electrocoagulation batch process with response surface methodology” Chem.Eng.Process.,47, pp.827-832, 2008.
[25] Hala. Y.E,andEman. M.E., “Optimization of Batch Process Parameters by Response Surface Methodology for Mico remediation of Chrome-VI by a Chromium Resistant Strain of Marine TrichodermaViride”, American-Eurasian Journal of Agriculture & Environmental Science, Vol. 5, (5), pp. 676 – 681, 2009.
[26] Saleem.M,Pirzada.T, and Qadeer.R. “Sorption of acid violet 17 and direct red 80 dyes on cotton fibre from aqueous solution Collides Surf.A”, PhysicochemEngg.Asp., 292, pp. 246-250, 2007.
[27] Rajasimman.M and Murugaiyan.K,”Optimization of process variables for the biosorption of chromium using Hypneavalentiae”, Nova biotechnological, vol. 10, issue 2, pp. 107-115, 2010.
BIOGRAPHY
Mr. Ashwin Shenoy. Heobtained BE in Chemical Engineering from R.V. College of Engineering (Autonomous institution under Visvesvaraya Technological University, Belgaum), Bangalore, India in 2013. He is pursuing Master‟s degree in Chemical Engineering in R.V. College of Engineering. His areas of research include Environment and Energy sustainability. He has 2 International journal publications and 2 National conference presentations
Dr. MALourduAntonyRaj. Born in Murugathuranpatty, Tamilnadu, India on Nov. 03, 1956. Obtained Bachelor degree in Chemical Engineering from Annamalai University, Chidambaram, India in 1979. Completed M.Tech in Chemical Reaction Engineering from IIT Madras in 1981. Completed PhD from Bangalore University in 2003. Major research areas include Reaction Engineering, Transfer operations and Modelling. He later joined R V College of Engineering, Bangalore and worked in various capacities of as Professor and HOD of Chemical Engineering from 2004 to 2010 and Dean, Students affairs from 2013 to 2015. Currently he is HOD of Chemical at R V College of Engineering. He has 32 years of teaching and 16 years research experience. He has more than 20 National and International journal publications and has 18 National and International conference publications.