Australian ICT
Trade Update 2009
www.acs.org.au/09icttradeupdate
The ACS (Australian Computer Society) is the recognised professional association for those working in Information and Communications Technology, seeking to raise the standing of TT ICT professionals and represent their views to government, industry and the community.
A member of the Australian Council of Professions, the ACS is the guardian of professional ethics and VWDQGDUGVLQWKH,&7VHFWRUFRPPLWWHGWRHQVXULQJWKHEHQHÀFLDOXVHRI,&7IRUDOO$XVWUDOLDQV
It provides both members and non-members with opportunities for professional development, QHWZRUNLQJDQGFHUWLÀFDWLRQDVZHOODVHQDEOLQJWKHPWRFRQWULEXWHWRWKHJURZWKRIWKHLUSURIHVVLRQ Visit www.acs.org.au for more information.
About the Australian
Computer Society
AUSTRALIAN
COMPUTER
SOCIETY
Level 3, 160 Clarence Street Sydney NSW 2000
Much of this decade has been one of a steady recovery from the ‘Dot Com’ downturn, but the last year has brought a global ÀQDQFLDOFULVLV
The ‘Dot Com’ downturn triggered a new wave of globalisation in the information and communication technology (ICT) industries, which featured increasing specialisation along the value chain and the emergence of developing economies as both new production locations and new growth markets (e.g. China and India). In the early years of this decade, international investment ÁRZVIRFXVHGRQGHYHORSLQJHFRQRPLHVRQVHUYLFHVUDWKHUWKDQ manufacturing and, in particular, on a range of IT and IT-enabledTT business services. As a result, a new international division of labour emerged, with the globalisation of services following a similar path to that previously seen in manufacturing.
To date, T
T WKHJOREDOÀQDQFLDOFULVLV has had surprisingly little effect on Australia’s ICT trade, with strong growth in imports and exports throughout 2008. Preliminary analysis of ICT equipment WUDGHGDWDIRUWKHÀUVWTXDUWHURIUHYHDOVVRPHHYLGHQFH of slowing, but it is not suggestive of a sharp contraction. TradeTT LQ,&7VHUYLFHVDOVRFRQWLQXHGWRJURZLQWKHÀUVWTXDUWHU ZLWK ERWK LPSRUWV DQG H[SRUWV XS RQ ÀUVW TXDUWHU LQ current prices).
+RZHYHU WKH JOREDO ÀQDQFLDO FULVLV KDV EURXJKW D PDUNHG slowing of risk-oriented seed and venture capital investment that may well have a negative impact on innovation. 1 Major multi-QDWLRQDOÀUPVPD\EHDEOHWRGUDZRQLQWHUQDOIXQGVWRFRQWLQXH to invest in bringing innovative new products and services to PDUNHWEXWVPDOOHUÀUPVWKDWKDYHWUDGLWLRQDOO\UHOLHGRQVHHG and venture investments may be more severely affected. Hence, an immediate challenge for the Australian ICT industry is to ÀQGZD\VWRPLQLPLVHWKHLPSDFWRIWKHJOREDOÀQDQFLDOFULVLVRQ innovation and, thereby, on the future competitiveness of local ÀUPV
Placing recent developments in this context, this report presents a detailed statistical update on Australia’s ICT trade over the decade 1998 to 2008 (inclusive). It explores the composition of ICT services, software, content and equipment WUDGHDQGLGHQWLÀHVPDMRUH[SRUWPDUNHWVDQGLPSRUWVRXUFHV,W also examines ICT trade State-by-State.
0 5,000 10,000 15,000 20,000 25,000 30,000 35,000
1998 1999 2000 2001 2002 2003 2004 2005 2006 2007 2008
ICT Equipment Software (royalties & fees) ICT Services
ICT goods and services H[SRUWV from Australia were worth almost $6.6 billion during 2008, only slightly below the peak of $6.9 billion reached during the boom in 2000 (Figure 1).
However, with increased spending ICTLPSRUWV cost more than ELOOLRQ)LJXUH&RQVHTXHQWO\$XVWUDOLD·V,&7WUDGHGHÀFLW reached $28 billion during 2008 – increasing by almost $5 billion during the year and exceeding the previous peak reached during the height of the ‘Dot Com’ boom.
Figure 1 Australia’s ICT Exports, 1998 to 2008 (AUDm)
Figure 2 Australia’s ICT Imports, 1998 to 2008 (AUDm)
0 1,000 2,000 3,000 4,000 5,000 6,000 7,000
1998 1999 2000 2001 2002 2003 2004 2005 2006 2007 2008
ICT Equipment Software (royalties & fees) ICT Services
1RWH'XHWRDFXVWRPV UHFODVVLÀFDWLRQWKHUHLVDEUHDNLQ WKHWLPHVHULHVDQGGDWDIRU RQZDUGVDUHQRWVWULFWO\FRPSDUDEOH ZLWKHDUOLHU\HDUV
6RXUFHV$%6DQG7UDGH'DWDZZZ WUDGHGDWDQHW&6(6$QDO\VLV
1RWH&RPSXWHUDQGLQIRUPDWLRQ VHUYLFHVLPSRUWVSULRUWRDUH OLNHO\WREHXQGHUVWDWHG 6RXUFHV$%6DQG7UDGH'DWDZZZ WUDGHGDWDQHW&6(6$QDO\VLV
ICT Trade
(Chapter 1)
Despite the global economic downturn, 2008 saw a marked upturn in spending on ICT equipment and services imports.
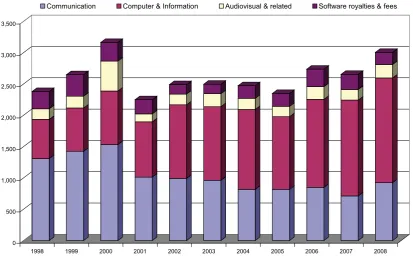
Figure 3 Australia’s ICT Services Exports, 1998 to 2008 (AUDm)
0 500 1,000 1,500 2,000 2,500 3,000 3,500
1998 1999 2000 2001 2002 2003 2004 2005 2006 2007 2008
Communication Computer & Information Audiovisual & related Software royalties & fees
6RXUFHV$%6&6(6$QDO\VLV
Australia’s ICTVHUYLFHVH[SRUWV were worth $3 billion in 2008, and accounted for around 6% of total services exports. Computer and information services were the standout, being the largest and
fastest growing category of ICT services exports – having increased nearly three-fold over the last decade and now accounting for more than 50% of all ICT services exports (Figure 3).
Australia’s ICT VHUYLFHV LPSRUWV cost $4.9 billion in 2008, and accounted for around 9% of Australia’s total services imports. Computer and information services accounted for 32%, audiovisual accounted for 26%, communication services accounted for 24%, and software royalties and license fees
IRU DURXQG 7KHUH ZDV D GHÀFLW RQ WUDGH LQ ,&7 VHUYLFHV approaching $2 billion during 2008, but computer and information services standout, having traded in surplus since 2000 and being the only category of ICT goods or services to be in surplus (Figure 4).
ICT Services Trade
(Chapter 2)
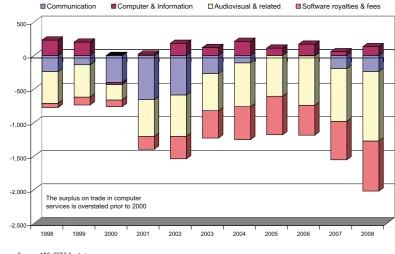
Figure 4 Australia’s ICT Services Trade Balance, 1998 to 2008 (AUDm)
-2,500 -2,000 -1,500 -1,000 -500 0 500
1998 1999 2000 2001 2002 2003 2004 2005 2006 2007 2008
The surplus on trade in computer services is overstated prior to 2000
Communication Computer & Information Audiovisual & related Software royalties & fees
Figure 5 Locally Produced ICT Equipment Exports, 1998 to 2008 (AUDm)
Figure 6 ICT Equipment Imports for Domestic Consumption, 1998 to 2008 (AUDm)
0 500 1,000 1,500 2,000 2,500
1998 1999 2000 2001 2002 2003 2004 2005 2006 2007 2008
Communications Computer AudioVisual Components Other ICT-related Software Products
0 2,000 4,000 6,000 8,000 10,000 12,000 14,000 16,000 18,000 20,000 22,000 24,000 26,000 28,000 30,000
1998 1999 2000 2001 2002 2003 2004 2005 2006 2007 2008
Communications Computer AudioVisual Components Other ICT-related Software Products
1RWH'XHWRDFXVWRPV UHFODVVLÀFDWLRQWKHUHLVDEUHDNLQ WKHWLPHVHULHVDQGGDWDIRU RQZDUGVDUHQRWVWULFWO\FRPSDUDEOH ZLWKHDUOLHU\HDUVDQGLWLVQRORQJHU SRVVLEOHWRWUDFNWUDGHLQVRIWZDUH SURGXFWV
6RXUFH7UDGH'DWD
ZZZWUDGHGDWDQHW&6(6$QDO\VLV
1RWH'XHWRDFXVWRPV UHFODVVLÀFDWLRQWKHUHLVDEUHDNLQ WKHWLPHVHULHVDQGGDWDIRU RQZDUGVDUHQRWVWULFWO\FRPSDUDEOH ZLWKHDUOLHU\HDUVDQGLWLVQRORQJHU SRVVLEOHWRWUDFNWUDGHLQVRIWZDUH SURGXFWV
6RXUFH7UDGH'DWD
ZZZWUDGHGDWDQHW&6(6$QDO\VLV
:KLOHWKHUHDUHVLJQLÀFDQWDUHDVRIH[SRUWVWUHQJWK$XVWUDOLD continues to source much of its ICT equipment from overseas, and increasingly from sources in Asia.
In 2008, ICTHTXLSPHQWH[SRUWV from Australia were worth $3.6 billion – 1.3% of Australia’s total goods exports. By comparison,
Australia’s gold exports accounted for around 5% of total goods exports and coal for 17%.
During 2008, re-exports (i.e. things brought into Australia and re-exported with little or no value added) accounted for just over $1.5 billion, or 43% of Australia’s ICT equipment exports.
ICT Equipment Trade
ICT Services Export Markets
and Import Sources
(Chapter 4)
Figure 7 Australia’s ICT Services Export Markets, 2008 (per cent) Locally produced equipment exports were worth $2 billion.
Locally produced exports of audiovisual equipment, components and other ICT-related equipment have increased over the lastTT decade, while locally produced computer and communications equipment exports have declined (Figure 5).
In the mid 1990s, locally produced exports of computer equipment were worth $790 million. By 2008, they had fallen to $375 million (in current prices).
ICT HTXLSPHQW LPSRUWV into Australia cost almost $30 billion during 2008 – up from $15 billion a decade earlier and higher than the previous peak reached during the ‘Dot Com’ boom (in current prices). ICT equipment accounted for around 13%
of Australia’s total goods imports during 2008. In comparison, passenger motor vehicles accounted for 6.5%.
As noted, re-exports were worth more than $1.5 billion in 2008. Hence, imports of ICT equipment for domestic consumption cost around $28 billion during 2008, up from less than $14 billion a decade earlier. Computer equipment accounted for 28%, audiovisual equipment for 20% and communications equipment for 19% (Figure 6).
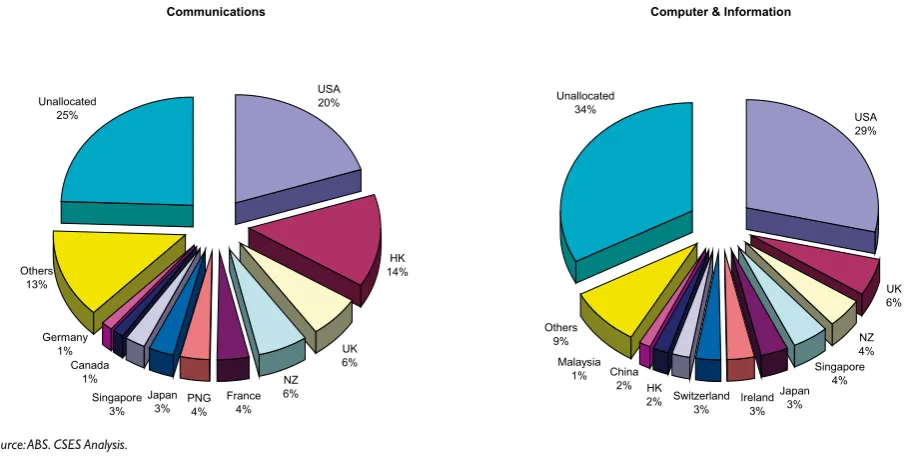
Bilateral services trade data are limited, but among reporting countries major markets for Australia’s ICT VHUYLFHV H[SRUWV
during 2008 included the United States, the United Kingdom, New Zealand, Japan, Singapore, Hong Kong and China (Figure 7).
Communications USA 20% HK 14% UK 6% Unallocated 25% Others 13% PNG 4% NZ 6% Japan 3% France 4% Singapore 3% Canada 1% Germany 1%
Computer & Information
Among reporting countries, the major export growth market for FRPPXQLFDWLRQVVHUYLFHV exports between 2000 and 2008 were France and Hong Kong, while for FRPSXWHU DQG LQIRUPDWLRQ services the major export growth markets were India, Switzerland, China, Ireland and Malaysia.
Of the reporting countries, the United States was by far our largest single source for ICT services imports during 2008 at $784 million. The United Kingdom was the source of $256 million, Singapore $109 million, France $95 million, New Zealand $64 million and Germany $48 million.
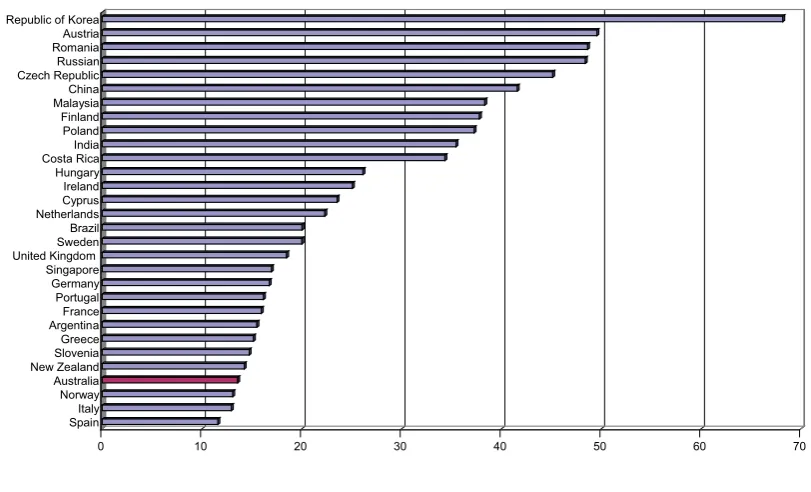
Offshoring and trade in off-shored services involve both computer and information services (i.e. IT services) and a range of IT-enabled business services. TT In only four countries did computer and information services account for more than 10% of total services exports during 2006 – India, where they accounted for almost 40% (down from 50% in 2004), Ireland 31% (down from 39% in 2004), Israel 27% and Costa Rica 12% (Figure 8).
0 5 10 15 20 25 30 35 40
India Ireland Israel Costa Rica Finland Sweden Canada Romania Czech Republic Germany United Kingdom Belgium Netherlands Argentina Luxembourg Norway Spain Hungary Austria Australia Slovenia Cyprus Malaysia Denmark New Zealand Russian Federation Poland
6RXUFH81&7$' &6(6DQDO\VLV
It is immediately apparent from these data that India, Ireland and Israel are major offshoring locations. The other countries OLVWHG LQ )LJXUH DUH DOVR VLJQLÀFDQW H[SRUWHUV RI ,7 VHUYLFHV
andSULPD IDFLH have the potential to become major offshoring locations (including Australia).
Throughout the last decade New Zealand and the United States have been the largest markets for Australia’s ICTHTXLSPHQW H[SRUWV. In 2008, other major markets included China (incl. SARs), Singapore, Germany, the United Kingdom, Japan, the United Arab
Emirates, Papua New Guinea and Korea (Figure 9). The United States, China (incl. SARs), New Zealand, Germany, Singapore and the United Kingdom were also the largest markets for our locally produced equipment exports.
A decade ago the United States and Japan were the two main sources of ICTHTXLSPHQWLPSRUWV into Australia, but Asian countries, including China (incl. SARs), Malaysia, Japan, Korea, Singapore and Taiwan, are now major suppliers (Figure 9). TT
The biggest change has been in imports from China (incl. SARs), which is now the largest supplier – with ICT equipment exports to Australia in excess of $10 billion during 2008 (more than one-third of Australia’s total ICT equipment imports).
ICT Equipment Export
Markets and Import Sources
(Chapter 5)
Figure 9 Australia’s ICT Export Markets and Import Sources, 2008 (per cent)
1RWH,QFOXGHVUHH[SRUWVDQG UHLPSRUWV
6RXUFHV$%6DQG7UDGH'DWD ZZZWUDGHGDWDQHW&6(6DQDO\VLV
ICT Equipment Exports
NZ 23%
USA 17%
China (incl. SARs) 14% Other
22%
Germany 5%
Singapore 7% UAE
3% PNG
2% Korea 2% Japan
2%
UK 3%
ICT Equipment Imports
USA 14% Malaysia
9% Japan
7% Korea
4% Singapore
4% Germany
4%
Other 16%
China (incl. SARs) 35%
Taiwan 3%
UK 2%
Figure 10 State ICT Equipment Trade Shares, 2008 (per cent)
ICT Equipment Exports
NSW 43% VIC 36% QLD 8% SA 7% WA 6% TAS 0% NT 0% ACT 0%
ICT Equipment Imports
NSW 64% VIC 23% QLD 7% TAS 0% NT 0% ACT 0% WA 4% SA 2%
During 2008, the major markets for locally produced ICT equipment exports from NSW were New Zealand, China (incl. SARs) and the United States, while for Victorian equipment exports the major markets were the United States, Germany, China (incl. SARs) and New Zealand.
Queensland’s ICT equipment exports went primarily to the United States, China (incl. SARs), New Zealand, Singapore, the United Kingdom, New Caledonia and South Africa; South Australia’s to the United States, China (incl. SARs), New Zealand, the United Kingdom, India and South Africa; and
Western Australia’s to China (incl. SARs), the United States, Singapore, the United Kingdom, New Zealand and South Africa.
The composition of the State’s ICT equipment exports also varied. NSW accounted for 58% of computer equipment exports during 2008 and Victoria 24%, but just 48% of communications equipment exports compared to Victoria’s 27%. Victoria accounted for more than 50% of all exports other ICT-related equipment, and Western Australia accounted for aTT relatively large 11% of all communications equipment exports. New South Wales and Victoria dominate ICT HTXLSPHQW
exports and imports – with NSW being the largest exporter and importer of ICT and related equipment during 2008. In addition to Victoria, ICT equipment exports from Queensland, South $XVWUDOLDDQG:HVWHUQ$XVWUDOLDZHUHDOVRVLJQLÀFDQW)LJXUH
NSW attracted no less than 64% of all ICTHTXLSPHQWLPSRUWV
during 2008 – although $1.2 billion worth were re-exported, with Sydney acting as a regional distribution hub (Figure 10). NSW also accounted for 46% of Australia’s State-attributed ICT
VHUYLFHVH[SRUWV and 66% of ICTVHUYLFHVLPSRUWV
During 2008, NSW exported $835 million worth of domestically produced ICT equipment, down from more than $1 billion in 1997. In contrast, Victoria exported $700 million worth, up marginally from $695 million a decade earlier (in current prices).
Queensland, South Australia and Western Australia each accounted for 6% to 8% of Australia’s locally produced ICT equipment exports, while the contribution of the other States and Territories toTT ICT trade is relatively small.
ICT Trade State-By-State
(Chapter 6)
Strengths, Weaknesses,
Opportunities and Threats
7UDGH DQG VSHFLDOLVDWLRQ DUH EHQHÀFLDO 1RW DOO FRXQWULHV ZLOO have a comparative advantage in all areas of ICT production, but the ICT producing industries are highly diverse. Comparative and competitive advantages in areas like electronic equipment assembly are very different from those in such areas as consulting services. Given the enormous range of the ICT industries, and the diversity of their underlying inputs and cost structures, one could reasonably expect almost all countries to have strengths in some aspect of ICT production, and comparative advantage in some part of the ICT industries.
In Australia’s case, strong export growth and surpluses on trade in computer services stand out. It is the only area of ICTs in
which Australia has a surplus on trade and is clearly an important area of local strength. Despite the overall picture, there are also areas of electronics production in which Australia is competitive and actively participating in global production systems. The challenge is to build on these local strengths.
Summary I
ICT TradeTT II
ICT Services TradeTT III
ICT Equipment TradeTT IV
ICT Services Export Markets and Import Sources V ICT Equipment Export Markets and Import Sources VII ICT TradeTT State-By-State VIII Strengths, Weaknesses, Opportunities and Threats IX
1 Australia’s ICT Trade At A Glance 19 1.1 Australia’s ICT Exports 19 1.2 Australia’s ICT Imports 21 1.3 Australia’s ICT Trade BalanceTT 23 1.4 Australia’s ICT Export Markets 25 1.5 Australia’s ICT Import Sources 27 1.6 Australia’s ICT Export Composition TrendsTT 29
2 Australian ICT Services Trade 30
2.1 ICT Services Exports 30 2.2 ICT Services Imports 32 2.3 Balance of Trade inTT ICT Services 33
2.4 Software TradeTT 34
3 The Direction of ICT Services Trade 37 3.1 Australia’s Major ICT Services Export Markets 37 3.2 Australia’s Major ICT Services Import Sources 39 3.3 Offshoring and Australia’s Trade inTT IT-TT Enabled Service 41 3.4 Offshoring IT and IT-TT Enabled Services 42
3.4.1 IT Services 42
3.4.2 IT-TT Enabled Services 43 3.4.3 IT and IT-TT Enabled Services 44 3.4.4 IT Services Offshoring Intensity 45
4 Australian ICT Equipment Trade 46
4.1 ICT Equipment Exports 46 4.1.1 The Composition of ICT Equipment Exports 46
Table of Contents
4.1.2 Locally Produced ICT Equipment Exports and
Re-Exports 48
4.1.3 ICT Equipment Export TrendsTT 50 4.2 ICT Equipment Imports 51 4.2.1 The Composition of ICT Equipment Imports 51 4.2.2 ICT Equipment Imports For Domestic Consumption 53 4.2.3 ICT Equipment Import TrendsTT 54 4.3 The Balance of TradeTT In ICT Equipment 55 4.4 ICT Equipment Trade Values and VolumesTT 57
5 The Direction of ICT Equipment Trade 58 5.1 Australia’s ICT Equipment Export Markets 58 5.2 Australia’s Major ICT Equipment Import Sources 61 5.3 The China Phenomenon 62
6 ICT Trade State-By-State 64
6.1 Comparative State Performance 64 6.2 State Export Markets 66
6.3 New South Wales 68
6.4 Victoria 71
6.5 Queensland 73
6.6 South Australia 75
6.7 Western Australia 77
6.8 TasmaniaTT 79
6.9 Northern TerritoryTT 81 6.10 Australian Capital TerritoryTT 83 6.11 Re-Exports and Re-Imports By State 84
7 International Comparisons 85
7.1 Contribution of ICT Equipment ToTT Exports 85 7.2 ICT TradeTT Performance 86 7KH&RVWRI$XVWUDOLD·V,&77UDGH'HÀFLW
$SSHQGL[,'HÀQLQJ,&7V
Mapping ICTs 88
Table 1.1 T
T Australia’s TotalTT ICT Exports, 1998 to 2008 (AUDm) 20 Table 1.2
T
T Australia’s TotalTT ICT Imports, 1998 to 2008 (AUDm) 21 Table 1.3
T
T Australia’s ICT Trade Balance, 1998 to 2008 (ATT UDm) 23 Table 2.1
T
T Australia’s ICT Services Exports, 1998 to 2008 (AUDm) 30 Table 2.2
T
T Australia’s ICT Services Imports, 1998 to 2008 (AUDm) 32 Table 2.3
T
T Australia’s ICT Services Trade Balance, 1998 to 2008 (ATT UDm) 33 Table 2.4
T
T Australian Cross-Border Software Trade, 1998 to 2008 (ATT UDm) 35 Table 3.1
T
T ICT and Related Services Trade, 2008 (ATT UDm) 37 Table 4.1
T
T ICT Equipment Exports, 1998 to 2008 (AUDm) 47
Table 4.2 T
T Australia’s ICT Equipment Imports, 1998 to 2008 (AUDm) 51 Table 4.3
T
T Australia’s ICT Equipment Trade Balance, 1998 to 2008 (ATT UDm) 55 Table 5.1
T
T Australia’s Top 10 TT ICT Equipment Export Markets, 1998 and 2008 (AUDm 59 Table 5.2
T
T Australia’s Top 10 TT ICT Equipment Re-Export and Domestic Export Markets 60 Table 5.3
T
T Australia’s Top 10 TT ICT Equipment Import Sources, 1998 and 2008 (AUDm) 61 Table 6.1
T
T NSW’s ICT Equipment Trade, 1998 to 2008 ($’000)TT 68 Table 6.2
T
T NSW’s ICT Services Trade, 2000 to 2008 (ATT UDm) 70 Table 6.3
T
T Victoria’s ICT Equipment Trade, 1998 to 2008 ($’000)TT 71 Table 6.4
T
T Victoria’s ICT Services Trade, 2000 to 2008 (ATT UDm) 72 Table 6.5
T
T Queensland’s ICT Equipment Trade, 1998 to 2008 ($’000)TT 73 Table 6.6
T
T Queensland’s ICT Services Trade, 2000 to 2008 (ATT UDm) 74 Table 6.7
T
T South Australia’s ICT Equipment Trade, 1998 to 2008 ($’000)TT 75 Table 6.8
T
T South Australia’s ICT Services Trade, 2000 to 2008 (ATT UDm) 76 Table 6.9
T
T Western Australia’s ICT Equipment Trade, 1998 to 2008 ($’000)TT 77 Table 6.10
T
T Western Australia’s ICT Services Trade, 2000 to 2008 (ATT UDm) 78 Table 6.11
T
T Tasmania’s TT ICT Equipment Trade, 1998 to 2008 ($’000)TT 79 Table 6.12
T
T Tasmania’s TT ICT Services Trade, 2000 to 2008 (ATT UDm) 80 Table 6.13
T
T Northern Territory’s TT ICT Equipment Trade, 1998 to 2008 ($’000)TT 81 Table 6.14
T
T Northern Territory’s TT ICT Services Trade, 2000 to 2008 (ATT UDm) 82 Table 6.15
T
Figure 1.1 Australia’s ICT Exports, 1998 to 2008 (AUDm) 19 Figure 1.2 Australia’s ICT Imports, 1998 to 2008 (AUDm) 22 Figure 1.3 Australia’s ICT Trade Balance, 1998 to 2008 (ATT UDm) 24 Figure 1.4 Top 10 Markets for Australia’s TT ICT Equipment Exports, 2008 (Per Cent) 26 Figure 1.5 Australia’s ICT Services Export Markets, 2008 (Per Cent) 26 Figure 1.6 Top 10 TT Sources of Australia’s ICT Equipment Imports, 1998 And 2008 27 Figure 1.7 ICT Equipment Imports from China (Incl. SARs), 1998 to 2008 (AUDm) 28 Figure 1.8 Australia’s ICT Services Import Sources, 2008 (Per Cent) 28 Figure 1.9 Australia’s IT Export Shares, 1998 to 2008 (Per Cent) 29 Figure 2.1 Australia’s ICT Services Exports, 1998 to 2008 (AUDm) 31 Figure 2.2 Australia’s ICT Services Imports, 1998 to 2008 (AUDm) 33 Figure 2.3 Australia’s ICT Services Trade Balance, 1998 to 2008 (ATT UDm) 34 Figure 2.4 Software Imports and Exports, 1998 to 2008 (AUDm) 36 Figure 2.5 Software Trade Balance, 1998 to 2008 (ATT UDm) 36 Figure 3.1 Australia’s ICT Services Export Markets, 2008 (Per Cent) 39 Figure 3.2 Australia’s ICT Services Import Sources, 2008 (Per Cent) 40 Figure 3.3 Markets and Sources of IT-TT Enabled Business Services, 2008 (Per Cent) 41 Figure 3.4 Annual Growth of Computer and Information Services Exports, 2000-2006 42 Figure 3.5 Annual Growth of ‘Other Business Services’ Exports, 2000-2006 (Per Cent) 43 Figure 3.6 Average Annual Growth of IT and IT-TT Enabled Services Exports, 2000-2006 44 Figure 3.7 Share of IT Services in TotalTT Services Exports, 2006 (Per Cent) 45 Figure 4.1 Australian Produced and Re-Export Shares of TotalTT ICT Equipment Exports 48 Figure 4.2 Composition of ICT Equipment Exports, 2008 (Per Cent) 49 Figure 4.3 Australian Produced ICT Equipment Exports, 1998 to 2008 (AUDm) 49 Figure 4.4 Australian ICT Equipment Export Growth, 1998 to 2008 (Per Cent) 50 Figure 4.5 TotalTT ICT Equipment Imports, 1998 to 2008 (AUDm) 52 Figure 4.6 ICT Equipment Imports for Domestic Consumption, 1998 to 2008 (AUDm) 53 Figure 4.7 Australian ICT Equipment Import Growth, 1998-2008 (Per Cent Per Annum) 54 )LJXUH &RPSRVLWLRQRI$XVWUDOLD·V,&7(TXLSPHQW7UDGH'HÀFLWWR Figure 4.9 Australia’s ICT Equipment Trade, 1998 to 2008 (ATT UDm) 56 Figure 4.10 Average Unit Prices for ICT Equipment Exports And Imports, 1998 to 2008 57 Figure 5.1 Top 10 Markets for Australia’s TT ICT Equipment Exports, 1998 And 2008 58 Figure 5.2 Top 10 Markets for Australia’s TT ICT Equipment Exports, 2008 (Per Cent) 60 Figure 5.3 Top 10 TT Sources of Australia’s ICT Equipment Imports, 1998 And 2008 61 Figure 5.4 ICT Equipment Imports from China (Incl. Sars), 1998 to 2008 (AUDm) 62 Figure 5.5 ICT Equipment Trade with China (TT Incl. Sars), 2008 (Per Cent Shares) 63 Figure 6.1 State ICT Equipment TradeTT Shares, 2008 (Per Cent) 64 Figure 6.2 State ICT Services TradeTT Shares, 2008 (Per Cent) 65 Figure 6.3 NSW and Victorian ICT Equipment Export Markets, 2008 (Per Cent) 66 Figure 6.4 State Shares of ICT Equipment Exports By Category, 2008 67 Figure 6.5 NSW’s Exports of ICT Equipment, 1998 to 2008 ($’000) 69 Figure 6.6 Victoria’s Exports of ICT Equipment, 1998 to 2008 ($’000) 72 Figure 6.7 Queensland’s Exports of ICT Equipment, 1998 to 2008 ($’000) 74 Figure 6.8 South Australia’s Exports of ICT Equipment, 1998 to 2008 ($’000) 76 Figure 6.9 Western Australia’s Exports of ICT Equipment, 1998 to 2008 ($’000) 78 Figure 6.10 ICT Equipment Re-Exports and Re-Imports By State, 2008 (Per Cent) 84 Figure 7.1 ICT Equipment Share of TotalTT Exports, 1996 to 2006 (Per Cent) 85 Figure 7.2 Revealed Comparative Advantage in ICT Equipment, 1996 and 2006 86 )LJXUH ,&7(TXLSPHQW6XUSOXV'HÀFLWDVD3HUFHQWDJHRI*'33HU&HQW
Figure A1.1 The ICT Map 89
Bringing services, software and equipment trade together, this chapter presents a brief picture of Australia’s ICT trade position.
A more detailed and in-depth analysis of each element of Australia’s ICT trade is presented in the subsequent chapters.
Figure 1.1 Australia’s ICT Exports, 1998 to 2008 (AUDm)
0 1,000 2,000 3,000 4,000 5,000 6,000 7,000
1998 1999 2000 2001 2002 2003 2004 2005 2006 2007 2008
ICT Equipment Software (royalties & fees) ICT Services
1RWHV6HHQRWHVWRWDEOH
6RXUFHV$%6DQG7UDGH'DWDZZZWUDGHGDWDQHW&6(6$QDO\VLV
ICTHTXLSPHQWW exports accounted for almost $3.6 billion (55% of total ICT exports) and ICT related services accounted for the remaining $3 billion (45%) (Figure 1.1). It should be noted, however, that equipment re-exports (i.e. things brought into Australia and re-exported with little or no value added) were worth more than $1.5 billion, around 20% of total ICT exports. Hence, locally produced ICT exports were worth around $5 billion.
Total T
T ICT exports increased 1.9% per annum over the period 1998 to 2008 (in current prices), with ICT services exports growing by 2.4% per annum over the period and ICT equipment exports by 1.5% per annum. Australian domestically produced ICT equipment exports increased by only 0.6% per annum, with re-exports growing faster rate than locally produced exports.
1 Australia’s ICT Trade at
a Glance
1.1
Australia’s ICT Exports
During 2008, ICT goods and services exports from Australia were worth $6.6 billion, up from $5.5 billion in 1998 (in current
Table 1.1 Australia’s Total ICT Exports, 1998 to 2008 (AUDm)
1998 2000 2002 2004 2006 2008
Equipment
Re-exports 1,172 1,710 1,635 1,202 1,146 1,552
Local Exports 1,905 2,011 1,730 1,763 1,868 2,019
Communications 722 1,193 579 596 587 697
Computer 1,396 1,206 1,480 978 1,007 1,058
Audiovisual 200 222 229 246 253 410
Components 298 493 342 353 350 521
Other ICT-relatedTT 413 571 657 697 719 885
Software Products 47 37 78 95 98 ..
Total ICT Equipment 3,076 3,721 3,365 2,965 3,014 3,571
Services
Communications 1,309 1,533 992 818 849 924
Computer & Information 626 855 1,176 1,275 1,406 1,673
Audiovisual & related 169 478 170 178 203 214
Software royalties & fees 276 298 153 202 279 195
Total ICT Services 2,380 3,164 2,491 2,473 2,737 3,006
Total
Total ICT Exports 5,456 6,885 5,856 5,438 5,751 6,577
Australian ICT Exports 4,285 5,175 4,221 4,236 4,605 5,025
It is clear from these data that growth has been strong during the last two years, despite the global downturn (Figure 1.1). Total TT ICT exports grew by 11% during 2008, ICT
equipment by 9% and ICT services by 13%, and ICT exports during the first quarter of 2009 appear to be holding up well. 2
1RWHV7RWDOLQFOXGHVUHH[SRUWVZKLOHWKH$XVWUDOLDQWRWDOH[FOXGHVWKHP$OOGDWDDUHFXUUHQWSULFHV'XHWRDFXVWRPVUHFODVVLÀFDWLRQLQWKHUHLVDEUHDNLQWKHWLPHVHULHV IRU,&7HTXLSPHQWDQGGDWDIURPRQZDUGVDUHQRWVWULFWO\FRPSDUDEOHZLWKHDUOLHU\HDUV&RQVHTXHQWO\,&7HTXLSPHQWWUDGHJURZWKUDWHVDUHQRPRUHWKDQLQGLFDWLYH 6RXUFHV$%6DQG7UDGH'DWDZZZWUDGHGDWDQHW&6(6$QDO\VLV
2+RZHYHULWVKRXOGEHQRWHGWKDWGXHWRDFXVWRPVUHFODVVLÀFDWLRQLQWKHUHLVDEUHDNLQWKHWLPHVHULHVIRU,&7HTXLSPHQWDQGGDWDIURPRQZDUGVDUHQRW
1.2
Australia’s ICT Imports
Table 1.2 Australia’s Total ICT Imports, 1998 to 2008 (AUDm)
1998 2000 2002 2004 2006 2008
Equipment
Re-imports 51 57 80 70 93 125
Foreign Equipment Imports 15,005 20,865 17,546 19,777 22,737 29,594
Communications 2,254 5,505 3,416 4,276 5,357 5,485
Computer 6,603 7,868 7,288 7,482 8,454 8,276
Audiovisual 2,221 3,073 3,596 4,560 4,965 6,047
Components 1,607 2,084 612 739 714 3,511
Other ICT-relatedTT 1,792 1,843 2,206 2,250 2,730 6,402
Software Products 579 550 508 540 610 ..
Total ICT Equipment 15,056 20,923 17,626 19,847 22,830 29,719
Services
Communications 1,550 1,934 1,580 928 855 1,162
Computer & Information 397 886 995 1,064 1,238 1,543
Audiovisual & related 642 709 787 831 940 1,250
Software royalties & fees 339 398 488 693 724 941
Total ICT Services 2,928 3,927 3,850 3,516 3,757 4,896
Total
Total ICT Imports .. 24,850 21,476 23,363 26,587 34,615
)RUHLJQ,&7,PSRUWV 17,932 24,792 21,396 23,293 26,494 34,490
1RWHV$OOGDWDDUHFXUUHQWSULFHV(TXLSPHQWLPSRUWVLQFOXGHUHLPSRUWVDQGUHH[SRUWV&RPSXWHUDQGLQIRUPDWLRQVHUYLFHVLPSRUWVDQGUHODWHGWRWDOVSULRU WRDUHXQGHUVWDWHGDQGKDYHEHHQRPLWWHG'XHWRDFXVWRPVUHFODVVLÀFDWLRQLQWKHUHLVDEUHDNLQWKHWLPHVHULHVIRU,&7HTXLSPHQWDQGGDWD IURPRQZDUGVDUHQRWVWULFWO\FRPSDUDEOHZLWKHDUOLHU\HDUV
6RXUFHV$%6DQG7UDGH'DWDZZZWUDGHGDWDQHW&6(6$QDO\VLV
2+RZHYHULWVKRXOGEHQRWHGWKDWGXHWRDFXVWRPVUHFODVVLÀFDWLRQLQWKHUHLVDEUHDNLQWKHWLPHVHULHVIRU,&7HTXLSPHQWDQGGDWDIURP
2007 onwards are not strictly comparable with earlier years. Consequently, ICT equipment trade growth rates are no more than indicative. Australia’s ICT imports cost more than $34 billion during 2008,
up from nearly $18 billion in 1998 (in current prices). During
Figure 1.2 Australia’s ICT Imports, 1998 to 2008 (AUDm)
0 5,000 10,000 15,000 20,000 25,000 30,000 35,000
1998 1999 2000 2001 2002 2003 2004 2005 2006 2007 2008
ICT Equipment Software (royalties & fees) ICT Services
1RWHV6HHQRWHVWRWDEOH
6RXUFHV$%6DQG7UDGH'DWDZZZWUDGHGDWDQHW&6(6$QDO\VLV
ICTHTXLSPHQWW imports accounted for 86% of this total ($30 billion) and ICT related VHUYLFHV for the remaining 14% ($4.9 billion). ICTHTXLSPHQWW imports increased by around 7% per annum between 1998 and 2008 (in current prices) and services imports
1.3
Australia’s ICT Trade Balance
Table 1.3 Australia’s ICT Trade Balance, 1998 to 2008 (AUDm)
1998 2000 2002 2004 2006 2008
Equipment
Re-imports minus re-exports -1,121 -1,653 -1,555 -1,131 -1,052 -1,427
Production ‘Balance’ -13,100 -18,854 -15,816 -18,014 -20,869 -27,576
Communications -1,532 -4,312 -2,837 -3,680 -4,770 -4,788
Computer -5,207 -6,662 -5,808 -6,504 -7,447 -7,218
Audiovisual -2,020 -2,852 -3,367 -4,314 -4,712 -5,637
Components -1,309 -1,591 -270 -386 -364 -2,990
Other ICT-relatedTT -1,379 -1,272 -1,548 -1,553 -2,012 -5,516
Software Products -532 -513 -430 -445 -512 ..
Total ICT Equipment -11,979 -17,202 -14,261 -16,882 -19,816 -26,149
Services
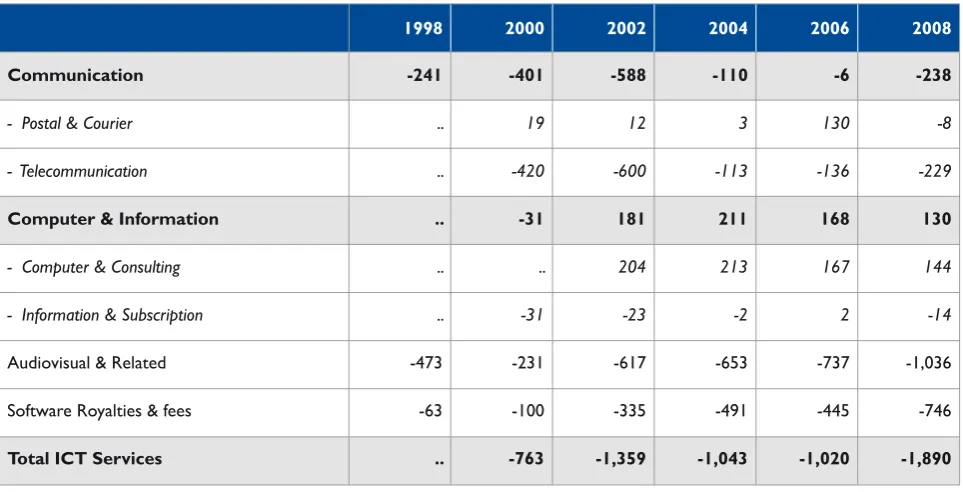
Communications -241 -401 -588 -110 -6 -238
Computer & Information 229 -31 181 211 168 130
Audiovisual & related -473 -231 -617 -653 -737 -1,036
Software royalties & fees -63 -100 -335 -491 -445 -746
Total ICT Services -548 -763 -1,359 -1,043 -1,020 -1,890
Total
7RWDO,&7%DODQFH'HÀFLW .. -17,965 -15,620 -17,925 -20,836 -28,039
¶,&73URGXFWLRQ'HÀFLW· .. -19,617 -17,175 -19,057 -21,889 -34,490
1RWHV7KH¶3URGXFWLRQ%DODQFH·LVWKHGLIIHUHQFHEHWZHHQGRPHVWLFDOO\SURGXFHGH[SRUWVDQGIRUHLJQSURGXFHGLPSRUWV6HHQRWHVWRSUHYLRXVWDEOHV 6RXUFHV$%6DQG7UDGH'DWDZZZWUDGHGDWDQHW&6(6$QDO\VLV
$XVWUDOLD·V GHÀFLW RQ ,&7 WUDGH VWRRG DW ELOOLRQ LQ (Figure 1.3), more than $4.5 billion (20%) higher than it had been in
Excluding re-exports and re-imports gives a clearer picture of what Australian ICT producers export and what Australia imports from overseas for local consumption – the difference between them can be thought of as the ‘GHÀFLW RQ SURGXFWLRQ’. %HFDXVH UHH[SRUWV DUH VLJQLÀFDQWO\ ODUJHU WKDQ UHLPSRUWV $XVWUDOLD·V,&7SURGXFWLRQGHÀFLWLVODUJHUWKDQLWVWUDGHGHÀFLW During 2008, the difference between locally produced exports and foreign produced imports was more than $34 billion.
Recent VXUSOXVHV on trade in computer and information services and growth in exports stand out as a bright spot. In 2008, Australia exported almost $1.7 billion worth of computer and information services, while importing just over $1.5 billion. It is the only area of ICTs in which Australia runs a surplus on trade.
Figure 1.3 Australia’s ICT Trade Balance, 1998 to 2008 (AUDm)
-30,000 -25,000 -20,000 -15,000 -10,000 -5,000 0
1998 1999 2000 2001 2002 2003 2004 2005 2006 2007 2008
ICT Equipment Software (royalties & fees) ICT Services
Box 1.1 What Does the ICT Deficit Show?
ICT imports underpin productivity gains, but realising the benefits of being a user of ICTs should not blind us to the potential benefits of being a producer. Strong productivity increases have been realised by countries that are ICT producers and by the ICT producing industries. The OECD’s Pilat and Wolfl (2004) concluded that: “In Finland, Ireland and Korea, close to 1 percentage point of aggregate labour productivity growth over the 1995-2001 period was due to the strong productivity performance of the ICT manufacturing sector. In the United States, Japan and Sweden, the ICT-producing sector also contributed TT significantly to productivity growth.” 4 Productivity in ICT production has been a significant driver of overall productivity growth in many developed countries, it does not depend upon ICT consumption alone.
Indeed, a growing ICT deficit can be seen as an indicator of decline in the local ICT industry and a sign of declining international competitiveness in ICT production. This has
implications for ICT using as well as the ICT producing industries. The Future Framework report stated that: “World-class ICT capabilities (e.g. in terms of skills and innovation) are fundamental to the ability to apply ICT in other industries and achieve broader national economic and social goals. A significant ICT production capability in the economy creates a symbiotic relationship between users and producers such that the level of sophistication of users is enhanced by the presence of producers of ICT goods and services. Without an industry producing such products and services, it would be more difficult for Australia to keep up internationally in terms of their adoption and use.”5
Many of the same factors underpin ICT production for market and in-house production and application. The concern is not so much, or not primarily, about the deficit per se, but rather about what a large and growing deficit indicates about Australia’s underlying ICT capabilities.
Source: Houghton, J.W. (2007) Australian ICT TradeTT Update 2007, Australian Computer Society, Sydney.
Perhaps more interestingly, these data also reveal that locally produced exports of ICT equipment from Australia found their largest markets in the United States (17%), China (incl. SARs)
(15%), New Zealand (13%), Germany, Singapore and the United Kingdom (5%) (Figure 1.4).
3Minor differences in the totals by country are due to trade with no recorded country source or destination. 43LODW'DQG:ROÁ$¶,&73URGXFWLRQDQG,&78VH:KDW5ROHLQ$JJUHJDWH3URGXFWLYLW\*URZWK"·LQ
OECD (2004) The Economic Impact of ICTs: Measurement, Evidence and Implications, OECD, Paris.
5Framework for the Future Steering Committee (2003) Enabling Our Future: A framework for the information
and communication technology industry, DCITA, Canberra, p19.TT
Over the last decade New Zealand and the United States have traditionally been the largest markets for Australia’s ICT
HTXLSPHQWH[SRUWVIn 1998, New Zealand took nearly 20% of our ICT equipment exports and the United States 17%. A decade later in 2008, New Zealand took $824 million (24%) and the United States took $611 million (17%). However it is China (incl. SARs) that has shown the strongest growth – increasing from less than 10% in 1998 to 14% ($477 million) in 2008 (Figure 1.4).
New Zealand was also by far the largest market for ICT equipment exports from Australia in 2008, taking 36% of all re-exports (Figure 1.4). Other major markets for UHH[SRUWVincluded the United States, China (incl. SARs) and Singapore. These data suggest that Australia acts as an ICT equipment distribution hub for the local region (e.g. New Zealand) and participates in international manufacturing supply chains (e.g. the United States, China (incl. SARs) and Singapore). 3
Figure 1.4 Top 10 Markets for Australia’s ICT Equipment Exports, 2008 (per cent)
Figure 1.5 Australia’s ICT Services Export Markets, 2008 (per cent) Domestic Exports ($1,956m)
USA 17%
China (incl. SARs) 15% NZ 13% Germany 5% Other 30% UK 5% PNG 3% UAE 3% Korea 2% Japan 2% Singapore 5% Re-Exports ($1,552m) NZ 36% USA 18% China (incl. SARs)
12% Singapore 8% Other 14% PNG 1% UK 2% UAE 3% Germany 4% Korea 1% Japan 1% Communications USA 20% HK 14% UK 6% Unallocated 25% Others 13% PNG 4% NZ 6% Japan 3% France 4% Singapore 3% Canada 1% Germany 1%
Computer & Information
USA 29% Unallocated 34% Others 9% UK 6% Ireland 3% Switzerland 3% HK 2% Singapore 4% Japan 3% China 2% Malaysia 1% NZ 4%
Thirty per cent of the exports of combined communications services and computer and information services from Australia GXULQJ FRXOG QRW EH WUDFHG WR D VSHFLÀF FRXQWU\ +HQFH
data on the direction of trade in services are far from complete, analysis is limited to the reporting countries only and should be interpreted with caution.
Regionally, however, APEC economies took nearly $1.4 billion of Australia’s ICT services exports during 2008, OECD countries $1.3 billion, European Union countries $306 million, and ASEAN economies $196 million. Of those countries reporting, the United States was by far our largest single customer for ICT services
exports during 2008, taking $663 million. Hong Kong took $166 million, the United Kingdom $154 million, New Zealand $131 million, Singapore $96 million and Japan $84 million – $44 million went to China (excl. SARs, more than $210 million incl. SARs) and $35 million to India (Figure 1.5).
6RXUFH7UDGH'DWDZZZWUDGHGDWDQHW&6(6$QDO\VLV
Australia draws ICT HTXLSPHQW LPSRUWV from a somewhat ZLGHUUDQJHRIVRXUFHVWKDQLWGLGDGHFDGHDJR5HÁHFWLQJWKH globalisation of ICT manufacturing. However, the Top 10 share of TT LPSRUWVLVVLJQLÀFDQWO\ODUJHUWKDQWKH7RSVKDUHRIH[SRUWV
A decade ago the United States, Japan and Singapore were the three main sources of ICT equipment imports into Australia,
supplying $4 billion (27%), $1.8 billion (12%) and $1.6 billion (11%), respectively. Japan has fallen down the rankings of suppliers from second to fourth, and by 2008 supplied just 7% of Australia’s ICT equipment imports, Singapore now supplies 4% of imports while the United States now supplies less than 14%. Asian countries, including China (incl. SARs), Malaysia, Korea, Taiwan andTT Thailand, are now major suppliers (Figure 1.6).
Figure 1.6 Top 10 Sources of Australia’s ICT Equipment Imports, 1998 and 2008 (per cent)
1998 USA 26% Japan 12% Singapore 11% Malaysia 9% Taiwan 7% Germany 3% Other 14% UK 5% Korea 4% Thailand 2%
China (incl. SARs) 7% 2008 USA 14% Malaysia 9% Japan 7% Korea 4% Singapore 4% Germany 4% Other 16%
China (incl. SARs) 35% Taiwan 3% UK 2% Thailand 2%
The big change is in imports from China (incl. SARs), which accounted for 7% of Australia’s ICT equipment imports in 1998, but is now the largest supplier with exports to Australia in excess of $10 billion in 2008 – more than one-third of Australia’s total ICT equipment imports. Australia’s ICT equipment imports from China (incl. SARs) increased by more than 26% per annum between 2000 and 2008 (Figure 1.7).
7KHVH GDWD UHÁHFW WKH ULVH RI $VLD DV D ORFDWLRQ IRU ,&7 manufacturing and assembly, the shift of Japanese ICT equipment manufacturing offshore and the rapid development of China (incl. SARs) as a base for electronics manufacturing.
1.5
Australia’s ICT Import Sources
Figure 1.7 ICT Equipment Imports from China (incl. SARs), 1998 to 2008 (AUDm) 0 2,000 4,000 6,000 8,000 10,000 12,000
1998 1999 2000 2001 2002 2003 2004 2005 2006 2007 2008
Communications Computer AudioVisual Components Other ICT-related Software Products
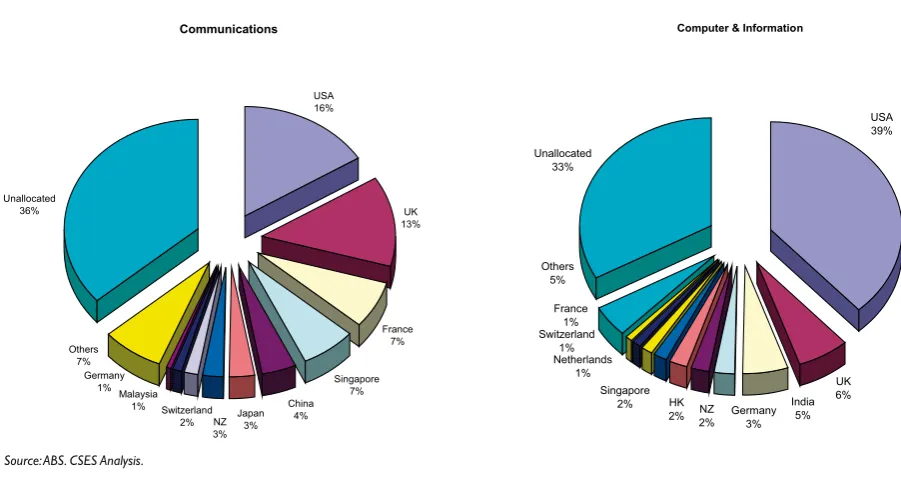
1RWH'XHWRDFXVWRPV UHFODVVLÀFDWLRQWKHUHLVDEUHDNLQ WKHWLPHVHULHVDQGGDWDIRU RQZDUGVDUHQRWVWULFWO\FRPSDUDEOH ZLWKHDUOLHU\HDUV&RQVHTXHQWO\ JURZWKUDWHVDUHQRPRUHWKDQ LQGLFDWLYH0RUHRYHUWKHUHDUHQR GDWDIRUVRIWZDUHSURGXFWVIRU DQG 6RXUFH7UDGH'DWD ZZZWUDGHGDWDQHW&6(6$QDO\VLV 7KLUW\ÀYHSHUFHQWRIWKHFRPELQHGFRPPXQLFDWLRQVVHUYLFHV and computer and information services imports into Australia GXULQJ FRXOG QRW EH WUDFHG WR D VSHFLÀF FRXQWU\ VRXUFH Hence, data on the sources of services imports are far from complete, analysis is limited to the reporting countries only and should be interpreted with caution.
Regionally, however, APEC economies were the source of $1.4 billion of Australia’s,&7VHUYLFHVLPSRUWVduring 2008, OECD
countries $1,5 billion, European Union countries $498 million, and ASEAN economies $187 million. Of the few reporting countries, the United States was by far our largest single source for ICT services imports during 2008, at $784 million. The United Kingdom was the source of $256 million, Singapore $109 million, France $95 million, New Zealand $64 million and Germany $48 million (Figure 1.8).
Figure 1.8 Australia’s ICT Services Import Sources, 2008 (per cent)
Communications USA 16% UK 13% France 7% NZ 3% Others 7% Germany 1% Malaysia 1% Switzerland 2% Singapore 7% China 4% Japan 3% Unallocated 36%
Computer & Information
Partly because of increased value-adding and partly because of relative price changes, ICT software and services expenditures have been increasing more rapidly than have hardware expenditures. Together with the continued globalisation andTT international rationalisation of ICT equipment manufacturing, these trends are clearly evident in Australia’s ICT export performance.
In 1998, locally produced ICT equipment accounted for 44% of all ICT exports from Australia and ICT services accounted for 56%. A decade later ICT services had increased to account for 60% of ICT exports. 6 This trend is all the more evident when one considers IT (i.e. computer) equipment and computer and information services exports alone (Figure 1.13). 7
6,QFOXGHV,&7DQGUHODWHGHTXLSPHQWVHUYLFHVDQGVRIWZDUHH[SRUWV²EURDGO\GHÀQHG,WLQFOXGHVDOOGRPHVWLFDOO\
produced exports of (i) computer, telecommunications, broadcasting and related equipment, components and parts; (ii) audiovisual, communications, computer and information services; and (iii) software royalties, license fees and media.
7Includes domestically produced exports of (i) computer equipment and parts; (ii) computer and information services;
and (iii) software (i.e. excludes communications and broadcasting equipment, content and services).
Figure 1.9 Australia’s IT Export Shares, 1998 to 2008 (per cent)
0% 20% 40% 60% 80% 100%
1998 1999 2000 2001 2002 2003 2004 2005 2006 2007 2008
IT Equipment (computer) IT Services (computer & information) Software (royalties & fees)
1RWH([FOXGHVUHH[SRUWV
6RXUFH$%6DQG7UDGH'DWDZZZWUDGHGDWDQHW&6(6$QDO\VLV
In 1998, locally produced computer equipment accounted for 43% of IT exports, computer and information services accounted for 39%. A decade later the situation had reversed, with computer and information services accounting for 75%
of IT exports during 2008, and locally produced computer HTXLSPHQWDFFRXQWLQJIRUMXVW7KLVUHÁHFWVDPDUNHGVKLIW in the composition of Australia’s IT exports from hardware to services.
Table 2.1 Australia’s ICT Services Exports, 1998 to 2008 (AUDm)
1998 2000 2002 2004 2006 2008
Communication 1,309 1,533 992 818 849 924
3RVWDO &RXULHU
7HOHFRPPXQLFDWLRQ
Computer & Information 626 855 1,176 1,275 1,406 1,673
&RPSXWHU &RQVXOWLQJ
,QIRUPDWLRQ 6XEVFULSWLRQ np
Audiovisual & Related 169 478 170 178 203 214
Software Royalties & fees 276 298 153 202 279 195
Total ICT Services 2,380 3,164 2,491 2,473 2,737 3,006
1RWHV$OOGDWDDUHFXUUHQWSULFHV1SLVQRWSXEOLVKHGLVQRGDWD 6RXUFH$%6&6(6$QDO\VLV
8ICTs exhibit rapid technological development and consequent price changes that are unlike consumer prices.
7KHFRPSOH[LW\RIDYDLODEOH,&7SULFHGHÁDWRUVDQGGLIIHUHQFHVEHWZHHQWKHPDQG&3,GHÁDWRUVUHQGHU DWWHPSWVWRDGMXVWSULFHVH[WUHPHO\GLIÀFXOW$VDUHVXOWLWLVVWDQGDUGSUDFWLFHWRSUHVHQW,&7WUDGHGDWDLQ
current prices (i.e. unadjusted for price changes over time).
2 Australian ICT Services
Trade
This chapter begins the detailed analysis by presenting an update on Australia’s ICT services trade, exploring the composition of
that trade and trends in exports (credits), imports (debits) and trade balances for the period 1998 to 2008. 8
2.1
ICT Services Exports
Australia’s ICT related services exports were worth $3 billion in 2008, up from $2.4 billion in 1998 (in current prices). They accounted for around 6% of total services exports – down from highs of around 9% in the late 1990s. Computer and information services exports were worth
Exports of ICT services have grown at a slower rate (2.4% per annum) over the last decade than have services exports generally (6.9% per annum), although strong growth was recorded in consultancy and implementation services exports, with information and database services exports also growing strongly. As a result, computer and information services exports have grown by 10% per annum over the last 10 years – a notable highlight in Australia’s overall ICT trade performance.
Since the peak of 2000, total ICT services exports have fallen by 0.6% per annum, due in part to large falls in audiovisual and related services following the peak exports relating to the Sydney Olympics. During 2008, ICT services exports grew by 13%, due to strong growth in audiovisual and communication services exports as well as computer and information services exports.
Figure 2.1 Australia’s ICT Services Exports, 1998 to 2008 (AUDm)
0 500 1,000 1,500 2,000 2,500 3,000 3,500
1998 1999 2000 2001 2002 2003 2004 2005 2006 2007 2008
Communication Computer & Information Audiovisual & related Software royalties & fees
1RWH([FOXGHVWKHRQHRIILPSDFWRISD\PHQWVIRU79ULJKWVWRWKH6\GQH\2O\PSLFVRQDXGLRYLVXDOVHUYLFHVGXULQJ 1HYHUWKHOHVVWKHUHZDVVWURQJ2O\PSLFVUHODWHGLQWHUHVWLQ$XVWUDOLDQDXGLRYLVXDOFRQWHQWDWWKDWWLPH 6RXUFHV$%6&6(6$QDO\VLV
Figure 2.1 shows trends in the composition of ICT related services exports. It reveals that after growing throughout the late 1990s Australia’s ICT services exports declined during EHIRUHUHFRYHULQJGXULQJ7KLVUHÁHFWVWKHJHQHUDO ‘Dot Com’ downturn in ICTs, from which recovery was slow. A decline in communications and audiovisual services exports
In late 2003, The Australian Bureau of Statistics (ABS) discovered a reporting error relating to computer and information services imports into Australia. Attempts to correct the error resulted in a substantial revision of computer services imports data reported in the December Quarterly Balance of Payments. The effect of the revision was to LQFUHDVH previously reported computer services imports by approximately $430 million for 2000-01 and 2001-02, and by $360 million for 2002-03. As a result there is a break in the historical series, with data SULRU WR OLNHO\ WR UHÁHFW D VXEVWDQWLDO XQGHUVWDWHPHQW RI
computer services imports and, thereby, an understatement of $XVWUDOLD·VRYHUDOO,&7WUDGHGHÀFLW
Australia’s ICT related services imports cost almost $4.9 billion in 2008 – accounting for around 9% of all services imports. Computer and information services imports were the largest category, costing $1.5 billion (32% of total ICT services imports). Audiovisual and related services imports cost $1.3 billion (26%), communications services imports $1.2 billion (24%), and software royalties and license fees cost $941 million (19%).
Table 2.2 Australia’s ICT Services Imports, 1998 to 2008 (AUDm)
1998 2000 2002 2004 2006 2008
Communication 1,550 1,934 1,580 928 855 1,162
3RVWDO &RXULHU
7HOHFRPPXQLFDWLRQ
Computer & Information .. 886 995 1,064 1,238 1,543
&RPSXWHU &RQVXOWLQJ
,QIRUPDWLRQ 6XEVFULSWLRQ
Audiovisual & Related 642 709 787 831 940 1,250
Software Royalties & fees 339 398 488 693 724 941
Total ICT Services .. 3,927 3,850 3,516 3,757 4,896
1RWHV$OOGDWDDUHFXUUHQWSULFHVLVQRGDWD 6RXUFH$%6&6(6$QDO\VLV
Because of the data revision little can be said about long-term growth trends. Nevertheless, since the peak in 2000 ICT services imports have grown (in current prices), and remained within the $3.5 billion to $3.8 billion range until 2008 when imports increased by 18% to almost $4.9 billion (Figure 2.2). Between 2000 and 2008 ICT services imports grew by an annual average of 2.8% but by contrast, overall services imports have grown by more than 6% per annum.
Areas of strong import growth have included software royalties and license fees, computer and information services and audiovisual services. Communication services imports have declined since the peak in 2000. However, all categories of ICT services imports grew during 2008 – driven by strong growth of communication services and audiovisual and related services imports.
Figure 2.2 Australia’s ICT Services Imports, 1998 to 2008 (AUDm)
0 500 1,000 1,500 2,000 2,500 3,000 3,500 4,000 4,500 5,000
1998 1999 2000 2001 2002 2003 2004 2005 2006 2007 2008
Computer services were understated prior to 2000
Communication Computer & Information Audiovisual & related Software royalties & fees
6RXUFHV$%6&6(6$QDO\VLV
Table 2.3 Australia’s ICT Services Trade Balance, 1998 to 2008 (AUDm)
1998 2000 2002 2004 2006 2008
Communication -241 -401 -588 -110 -6 -238
3RVWDO &RXULHU 3
7HOHFRPPXQLFDWLRQ
Computer & Information .. -31 181 211 168 130
&RPSXWHU &RQVXOWLQJ
,QIRUPDWLRQ 6XEVFULSWLRQ
Audiovisual & Related -473 -231 -617 -653 -737 -1,036
Software Royalties & fees -63 -100 -335 -491 -445 -746
Total ICT Services .. -763 -1,359 -1,043 -1,020 -1,890
2.3
Balance of Trade in ICT Services
1RWHV$OOGDWDDUHFXUUHQWSULFHVLVQRGDWD 6RXUFHV$%6&6(6$QDO\VLV
Computer and information services are the best performing area, having traded in surplus since 2002 – being in surplus by $181 million in 2002, rising to around $211 million in 2004, but
falling to $130 million during 2008. It is the only area of ICT trade in which Australia has a surplus (Figure 2.3).
,Q WKHUH ZDV D GHÀFLW RQ WUDGH LQ ,&7 UHODWHG VHUYLFHV DSSURDFKLQJELOOLRQ7KHODUJHVWGHÀFLWZDVRQWUDGHLQDXGLRYLVXDO
Figure 2.3 Australia’s ICT Services Trade Balance, 1998 to 2008 (AUDm)
-2,500 -2,000 -1,500 -1,000 -500 0 500
1998 1999 2000 2001 2002 2003 2004 2005 2006 2007 2008
The surplus on trade in computer services is overstated prior to 2000
Communication Computer & Information Audiovisual & related Software royalties & fees
6RXUFHV$%6&6(6$QDO\VLV
There are many problems associated with tracking software trade. The approach used in previous editions has been to track trade in the physical supports for software (e.g. magnetic discs, tapes and other recorded media) and payments made in respect to software related royalties and license fees.
Tracking the physical supports for software (i.e. software T
T
products) has had many limitations. First, as border valuations are based on the physical support media, the value of the VRIWZDUHWUDGHGLVOLNHO\WREHVLJQLÀFDQWO\XQGHUVWDWHG6HFRQG the bundling of software with hardware leads to substantial mis-measurement (i.e. likely overstating equipment trade and understating software trade). Third, trade statistics do not measure the value of copyright works sold in foreign markets (i.e. the ‘gold master’ problem). Fourth, trade statistics do not capture emerging business models for software delivery, in that they do not measure the value of software electronically transmitted across borders, nor do they capture software
delivered as a service, by, for example, applications services providers. 9There is also a recent trend towards a greater blurring of the distinctions between media products, with software and data of various types supported by a wider range of media than hitherto.
Tracking software related royalty and license fee payments T
T
complemented software products trade statistics, as some of the elements of the trade missed in commodity trade statistics are captured in royalty and license fee payments (e.g. embedded software). While far from perfect, taken together, trade in software products and payments of software related royalties and license fees provided a window on Australia’s software trade.
Unfortunately, due to the customs revisions of 2007 it is no longer possible to track software media products with any accuracy, and analysis is now limited to software-related royalties and license fees.
9OECD (2008) Information Technology Outlook 2008, Organisation for TT Economic Cooperation and Development, Paris.
Table 2.4 Australian Cross-Border Software Trade, 1998 to 2008 (AUDm)
1998 2000 2002 2004 2006 2008
Exports
Software Products 47 37 78 95 98 ..
Software royalties & fees 276 298 153 202 279 195
([SRUWV
Imports
Software Products 579 550 508 540 610 ..
Royalties & fees 339 398 488 693 724 941
,PSRUWV
Balance
Software Products -532 -513 -430 -445 -512 ..
Royalties & fees -63 -100 -335 -491 -445 -746
%DODQFH
1RWHV6RIWZDUHSURGXFWVLQFOXGHUHFRUGHGDQGUHFRUGDEOHPHGLDRIWKHW\SHVVXLWDEOHIRUVRIWZDUHDQGLQFOXGHUHH[SRUWVDQGUHLPSRUWV$OOGDWDDUHFXUUHQWSULFHV 6RXUFHV$%6DQG7UDGH'DWDZZZWUDGHGDWDQHW&6(6$QDO\VLV
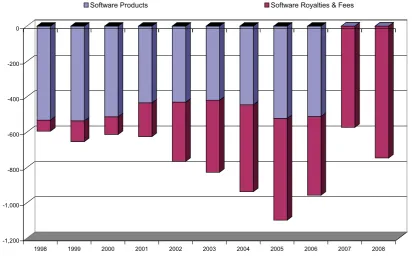
Table 2.4 shows reported Australian software related imports, T
T
exports and the balance on trade for the years 1998 through 2008. It reveals that software exports have been more-or-less stable over the decade, while software imports have grown. +HQFHWKHGHÀFLWRQVRIWZDUHUHODWHGWUDGHKDVLQFUHDVHG)LJXUH 7KH ODVW WZR \HDUV KDYH ZLWQHVVHG D VLJQLÀFDQW GHFOLQH LQ software royalty and license payments earnings, while imports grew strongly.
Figure 2.4 Software Imports and Exports, 1998 to 2008 (AUDm)
Figure 2.5 Software Trade Balance, 1998 to 2008 (AUDm)
-1,600 -1,400 -1,200 -1,000 -800 -600 -400 -200 0 200 400
1998 1999 2000 2001 2002 2003 2004 2005 2006 2007 2008
Imports Exports
Software Products Exports Royalties & Fees Exports Software Products Imports Royalties & Fees Imports
-1,200 -1,000 -800 -600 -400 -200 0
1998 1999 2000 2001 2002 2003 2004 2005 2006 2007 2008
Software Products Software Royalties & Fees
1RWH6HHQRWHVWR7DEOH
6RXUFHV$%6DQG7UDGH'DWDZZZWUDGHGDWDQHW&6(6$QDO\VLV
1RWH6HHQRWHVWR7DEOH
3 The Direction of ICT
Services Trade
Table 3.1 ICT and Related Services Trade, 2008 (AUDm)
&RXQWU\5HJLRQ Comms IT Business Royalties
Exports Imports Exports Imports Exports Imports Exports Imports
Belgium & Luxembourg np np np 2 np np - 5
Brunei Darussalam - 0 - 0 - 0 - 0
Canada 13 4 np 10 56 128 15 7
Central America & Caribbean np 38 np np 29 227 - np
Chile - 0 np 0 np np np 0
China (excl. SARs) 12 49 32 np 122 78 17 np
Fiji np np 1 0 12 np np 0
France 37 82 6 13 60 73 7 50
Germany 13 8 3 40 58 49 30 169
Some 30% of the exports of combined communications services and computer & information services from Australia GXULQJ FRXOG QRW EH WUDFHG WR D VSHFLÀF FRXQWU\ +HQFH data are far from complete and bilateral analysis is limited to reporting countries and should be interpreted with caution.
Regionally, however, APEC economies took nearly $1.4 billion of Australia’s ICT services exports during 2008, OECD countries more than $1.2 billion, European Union countries $306 million and ASEAN economies $196 million (Table 3.1). TT Of those countries reporting, the United States was by far our largest single customer for ICT services exports from Australia during 2008, taking $663 million. Hong Kong took $166 million, the United Kingdom $154 million, New Zealand $131 million, Singapore $96 million and Japan $84 million, while $44 million went to China (excl. SARs).
Markets for the two major services categories varied (Figure 3.1). The major recorded markets for FRPPXQLFDWLRQV VHUYLFHV
exports during 2008 included: the United States $185 million,
Hong Kong $128 million, the United Kingdom $59 million, New Zealand $56 million, France $37 million, Papua New Guinea $34 million, Japan $26 million and Singapore $25 million. The major recorded markets for FRPSXWHUDQGLQIRUPDWLRQVHUYLFHVexports during 2008 included: the United States $478 million, the United Kingdom $95 million, New Zealand $75 million, Singapore $71 million, Japan $58 million, Ireland $56 million, Switzerland $49 million, Hong Kong $38 million and China (excl. SARs) $32 million.
Regionally, communications services exports were down, while computer and information services exports increased to all regions – most notably to ASEAN and the European Union. Among reporting countries, the only growth markets for
FRPPXQLFDWLRQV VHUYLFHV H[SRUWV between 2000 and 2008 were France, Hong Kong and Papua New Guinea. For FRPSXWHU DQG LQIRUPDWLRQVHUYLFHV, the major growth markets were India (48% per annum), Switzerland (37% per annum), China (excl. SARs) (34% per annum), Ireland (30% per annum) and Malaysia (25% per annum).
This chapter focuses on the direction of trade in ICT services (i.e. our export markets and import sources). Services data are more limited than goods trade data, and there is a break in the time series due to the major revision to computer and information services import data noted above. Hence, analysis of
Australia’s bilateral trade in ICT services is restricted to reporting countries and to the period 2000 through 2008. Subsequent sections explore developments in the global sourcing of IT and IT-enabled business services (i.e. offshoring) through the prism of TT international services trade.
&RXQWU\5HJLRQ Comms IT Business Royalties
Exports Imports Exports Imports Exports Imports Exports Imports
Greece np np np 0 np np - 0
Hong Kong 128 np 38 33 91 np np np
India 12 np 23 85 45 np np 1
Indonesia np np 13 np 96 38 33 0
Ireland np 3 56 np 63 np np 166
Italy 5 np np np 19 23 np 38
Japan 26 36 58 9 173 np 14 np
Korea 7 np 2 2 26 69 2 np
Malaysia np 11 24 4 143 54 20 6
Mexico - 0 np 0 np 2 np 0
Netherlands np 5 6 15 23 177 59 199
New Zealand 56 30 75 34 484 181 np 25
Norway np np np 5 9 np np 1
Papua New Guinea 34 np 10 1 61 32 np 0
Peru - 0 - 0 7 np - np
Philippines np np 14 5 31 np 3 0
Russian Federation np 0 np 0 10 np np np
Singapore 25 79 71 30 877 397 np 39
South Africa 4 1 np 2 111 86 9 0
Sweden np 0 np np np 9 np 45
Switzerland np 19 49 21 192 56 3 329
Taiwan T
T np 5 2 np 6 3 np np
Thailand np 5 5 0 60 128 4 0
United Kingdom 59 155 95 101 668 947 49 285
United States of America 185 188 478 596 2,022 2,711 314 1,650
Vietnam np np - np 28 np np 0
Africa nes - 0 np 13 293 78 np 0
America nes np np 11 0 37 np 6 0
Asia nes 16 10 np np np np 6 0
Europe nes 12 2 46 10 87 177 80 76
Oceania nes np 1 4 0 63 29 - 0
International capital markets - 0 - 0 - 0 - 0
International institutions - 0 - 0 - 0 - 0
Unallocated 277 427 549 514 1,588 1,619 145 462
Total all countries 924 1,162 1,673 1,544 7,651 7,371 816 3,554
APEC 538 677 826 742 4,391 4,410 482 2,094
ASEAN 71 148 125 39 1,266 666 65 44
EU 134 272 172 226 1,011 1,344 165 1,027
OECD 423 589 839 903 3,965 4,952 558 3,313
Figure 3.1 Australia’s ICT Services Export Markets, 2008 (per cent) Communications USA 20% HK 14% UK 6% Unallocated 25% Others 13% PNG 4% NZ 6% Japan 3% France 4% Singapore 3% Canada 1% Germany 1%
Computer & Information
USA 29% Unallocated 34% Others 9% UK 6% Ireland 3% Switzerland 3% HK 2% Singapore 4% Japan 3% China 2% Malaysia 1% NZ 4%
3.2
Australia’s Major ICT Services Import Sources
Some 35% of the combined communications services and computer & information services imports into Australia during FRXOGQRWEHWUDFHGWRDVSHFLÀFFRXQWU\VRXUFH+HQFHGDWD on the sources of services imports are also far from complete and bilateral analysis is limited to the reporting countries and should be interpreted with caution.
Regionally, however, APEC economies were the source of $1.4 billion of Australia’s ICT services imports during 2008, OECD countries $1.5 billion, European Union countries $498 million, and ASEAN economies $187 million (Table 3.1). Of the fewTT reporting countries, the United States was by far our largest single source for ICT services imports during 2008, at $784 million. The United Kingdom was the source of $256 million, Singapore $109 million, France $95 million, New Zealand $64 million and Germany $48 million. Unfortunately, India did not report communication services but was the source of $85 million of computer and information services imports.
Sources of the two major services categories varied (Figure 3.2). The largest recorded sources of FRPPXQLFDWLRQV VHUYLFHV
imports during 2008 included: the United States $188 million, the United Kingdom $155 million, France $82 million, Singapore $79 million and China (excl. SARs) $49 million. The largest recorded sources of FRPSXWHU DQG LQIRUPDWLRQ VHUYLFHV imports during 2008 included: the United States $596 million, the United Kingdom $101 million, India $85 million, Germany $40 million, New Zealand $34 million, Hong Kong $33 million and Singapore $30 million.
All sources for FRPPXQLFDWLRQV VHUYLFHV imports declined between 2000 and 2008 except for Singapore, while for FRPSXWHU DQGLQIRUPDWLRQVHUYLFHV the growth came primarily from Germany, India, New Zealand, Canada, Norway, the United States and Singapore.
Figure 3.2 Australia’s ICT Services Import Sources, 2008 (per cent)
Communications
USA 16%
UK 13%
France 7%
NZ 3% Others
7% Germany
1% Malaysia
1% Switzerland 2%
Singapore 7% China
4% Japan
3% Unallocated
36%
Computer & Information
Unallocated 33%
UK 6% India
5% NZ
2% France
1%
Netherlands 1% Switzerland
1%
Singapore
2% HK
2% Germany
3% Others
5%
USA 39%
Among reporting countries, Australia had a positive balance on trade in FRPPXQLFDWLRQV VHUYLFHV during 2008 with New =HDODQG &DQDGD *HUPDQ\ DQG 6RXWK$IULFD DQG D GHÀFLW RQ trade with the United States of only $3 million. Australia had
a positive balance on trade inFRPSXWHUDQGLQIRUPDWLRQVHUYLFHV
during 2008 with Japan, New Zealand, Singapore, Switzerland DQG0DOD\VLDDQGDGHÀFLWRQWUDGHZLWKWKH8QLWHG6WDWHV,QGLD and Germany.
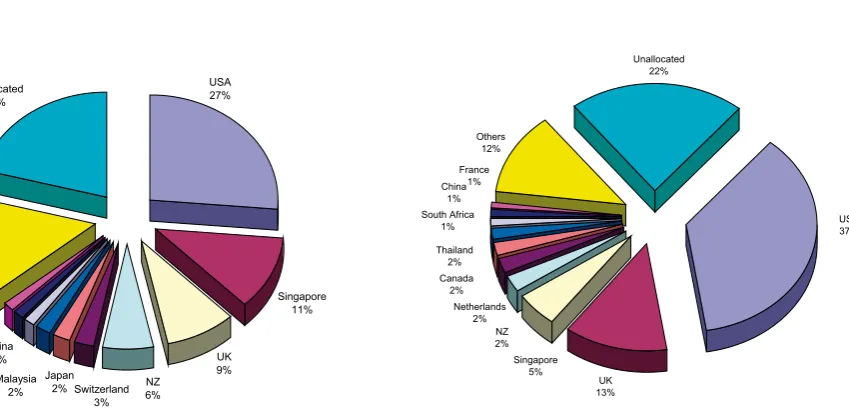
Figure 3.3 Markets and Sources of IT-Enabled Business Services, 2008 (per cent) 6RXUFH$%6&6(6$QDO\VLV Export Markets Singapore 11% Unallocated 21% UK 9% USA 27% Others 15% Switzerland 3% NZ 6% China 2% Japan 2% Malaysia 2% South Africa 1% Indonesia 1% Import Sources UK 13% Others 12% Unallocated 22% Thailand 2% Netherlands 2% Singapore 5% USA 37% Canada 2% France 1% China 1% South Africa 1% NZ 2%
and information services (i.e. IT services) and a range of IT-TT enabled business services that are captured in large part under the statistical category of ‘other business services’. Hence, while not strictly ICT services, it is interesting to explore Australia’s trade in these IT-enabled ‘other business services’ as a windowTT onto the offshoring phenomenon.
During 2008, Australia exportedd around $7.7 billion of these ‘other business services’, of which almost $4.4 billion went to APEC economies, $4 billion to OECD countries, $1.2 billion to ASEAN economies and $1 billion to European Union countries (Table 3.1). TT
Of reporting countries, the largest markets for ‘other business services’ exports from Australia during 2008 included: the United States $2 billion, Singapore $877 million, the United Kingdom $668 million, New Zealand $484 million, Switzerland $192 million, Japan $173 million, Malaysia $143 million, China (excl. SARs) $122 million and South Africa $111 million (Figure 3.3). The major growth markets for exports between 2000 and 2008 included: South Africa (41% per annum), Canada (35% per annum), India (32% per annum) and Singapore (20% per annum).
During 2008, Australia LPSRUWHGG almost $7.4 billion of these ‘other business services’, of which $5 billion came from OECD countries, $4.4 billion from APEC economies, $1.3 billion from European Union countries, and $666 million from ASEAN member countries (Table 3.1). TT
Of reporting countries, the largest suppliers of these ‘other business services’ imports into Australia during 2008 included: the United States $2.7 billion, the United Kingdom $947 million, Singapore $397 million, New Zealand $181 million, the Netherlands $177 million, Canada and Thailand $128 million, South Africa $86 million and China (excl. SARs) $78 million (Figure 3.3). The major growth suppliers of these ‘other business services’ services imports into Australia between 2000 and 2008
were: South Africa (60% per annum), Thailand (50% per annum), Papua New Guinea (34% per annum), Malaysia (30% per annum), Canada (25% per annum), Indonesia, Singapore and the United States (18% per annum), the United Kingdom (14% per annum) and New Zealand (13% per annum). These countries are a mix of those building exports from a very low base (e.g. PNG) and those that are already major offshored services providers (e.g. Singapore and Canada).
Australia had a positive balance on trade in these IT-enabledTT ‘other business services’ during 2008 with Singapore, New Zealand, Switzerland, Malaysia, Indonesia, China (excl. SARs) and 6RXWK$IULFDDQGDGHÀFLWRQWUDGHZLWKWKH8QLWHG6WDWHV8QLWHG Kingdom, Netherlands, Canada, Thailand and Korea.