1
Usage Surface Deflection Data for Performance Prediction in Flexible Pavement
Nader Karballaeezadeh1, Farah Zaremotekhases2, Narjes Nabipour3, Shahaboddin Shamshirband4,5,*, Amir Mosavi6,7
1 Department of Civil Engineering, Shahrood University of Technology, Shahrood, Iran: [email protected], 2 Department of Construction Management, Louisiana State University, Baton Rouge, LA: [email protected]
3 Institute of Research and Development, Duy Tan University, Da Nang 550000, Vietnam: [email protected] 4 Department for Management of Science and Technology Development, Ton Duc Thang University, Ho Chi Minh City, Vietnam 5 Faculty of Information Technology, Ton Duc Thang University, Ho Chi Minh City, Vietnam:
6 Institute of Automation, Kalman Kando Faculty of Electrical Engineering, Obuda University, Budapest, Hungary 7 Institute of Advanced Studies Koszeg, IASK, Koszeg, Hungary
*Corresponding: [email protected]
Abstract
The conventional method used for calculating pavement condition index (PCI) has two major drawbacks: safety problems during pavement inspection, and human error. This paper proposes a method for removing these problems. The proposed method uses surface deflection data in falling weight Deflectometer test to estimate PCI. The data used in this study were derived from 236 pavement segments taken from Tehran-Qom freeway in Iran. The data set was analyzed using multi layers perceptron (MLP) and radial basis function (RBF) neural networks. These neural networks were optimized by levenberg-marquardt (MLP-LM), scaled conjugate gradient (MLP-SCG), imperialist competitive (RBF-ICA), and genetic (RBF-GA) algorithms. After initial modeling with four neural networks mentioned, the committee machine intelligent systems (CMIS) method was adopted to combine the results and improve the accuracy of the modeling. The results of analysis have been verified by the four criteria of average percent relative error (APRE), average absolute percent relative error (AAPRE), root mean square error (RMSE) and standard error (SD). The best reported results belonged to CMIS, including APRE=2.3303, AAPRE=11.6768, RMSE=12.0056, and SD=0.0210.
Author keywords: transportation engineering; flexible pavement; pavement condition index prediction; falling weight Deflectometer; MLP neural network; RBF neural network; Intelligent machine system committee
Introduction
The transportation industry is recognized as the basic infrastructure for economic growth and the development of other industries throughout the world. The mission of a transportation system is to provide optimal services
2
to users (drivers, pedestrians, bicyclists or passengers) and thus reduce time and cost of daily lives. In road transportation, pavement plays a vital role as this part of the road is in direct contact with vehicles and users’ judgement about quality of road service is primarily predicated upon pavement conditions. Therefore, providing optimal service to users of a road is a function of the proper pavement quality.
Pavement maintenance has attracted growing attention of pavement engineers in recent years. The Maintenance, Rehabilitation and Reconstruction (MR&R) program is a multidimensional decision-making process that takes into account several considerations. Highway agencies generally focus on two issues: maximizing the efficiency of the pavement network or minimizing agency costs(France-Mensah and O’Brien 2019). Both of these issues require the estimation of operating conditions of the pavement network in order to set up pavement management and maintenance plans.
Detection of pavement surface distresses is essential before setting up a maintenance plan to determine the pavement operating conditions, as pavement network maintenance operations are arranged based on the state of such distresses(Suraji, Sudjianto, and Riman 2018). Table 1 shows an instance of pavement network maintenance operations based on pavement status.
Table 1. Maintenance Program in Roads(Suraji, Sudjianto, and Riman 2018) Damage (%) Condition Maintenance Program
< 𝟔 Good Routine Maintenance 6-11 Moderate Minor Rehabilitation 11-15 Light Damage Major Rehabilitation
> 𝟏𝟓 Heavy Damage Reconstruction
Given the importance of identifying surface pavement distresses, a variety of distress indices have been developed by engineers in recent decades. A very common index of the pavement maintenance program is pavement condition index (PCI), which was developed by the US Army Corps of Engineers in 1982. After visual inspection of the pavement network, pavement engineers calculate PCI based on the type, severity, and extent of the distresses. The index varies from zero for a virtually unusable pavement to 100 for an optimal pavement(Shah et al. 2013).
3
PCI calculation process is concerned with human error in identifying and recording pavement distress. Human error can affect the accuracy of calculated PCI. The aforesaid problems underline the necessity of substituting the current method of PCI calculation with a new one that is bereft of such shortcomings.
In this paper, the authors propose a novel method for estimating PCI in flexible pavements. In the proposed method, the PCI of a pavement segment can be calculated based on the surface deflections recorded in the Falling Weight Deflectometer (FWD) testing. FWD is a non-destructive equipment used for pavement assessment, which provides engineers with useful data including remaining service life of pavement and overlay thickness by applying impulse loading to the surface of pavement, recording and analyzing deflections(Karballaeezadeh et al. 2019). Most pavement management systems around the world have FWD testing in their evaluation programs. Hence, using FWD test results to estimate PCI contributes to the overlapping and cost-effectiveness of the pavement network maintenance activities. Another major incentive of the authors was the lack of studies on the link between PCI and pavement surface deflection in the FWD testing.
4
This paper is organized as follows. The second section reviews relevant studies in the literature. In the next section, the research methodology is presented. This section also includes an introduction to PCI and its calculation method, FWD test, the freeway under study, and data analysis methods. At the end of this section, the validation criteria of results are presented. The fourth section discusses the results and conclusions are drawn in the fifth Section.
Literature review
In addition to the conventional method of determining PCI, several other attempts have been made to predict this index. PCI prediction methods can be broadly divided into three categories:
❖ PCI prediction methods based on other pavement quality indices
❖ PCI prediction methods based on pavement age
❖ PCI prediction methods based on pavement surface deflection
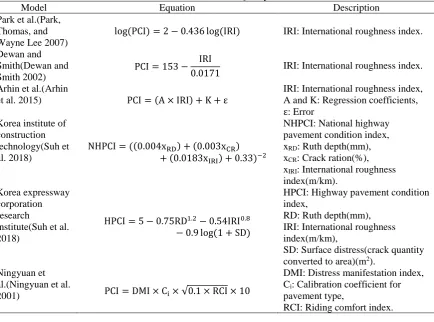
The first category represents the most frequent method used by other researchers. In this category, PCI of a flexible pavement is determined based on other indices that manifest pavement quality. Surface pavement distresses have a direct relationship with other indicators of pavement distress, including roughness and driving quality. Table 2 depicts a number of methods in this category.
Table 2. PCI Prediction Methods Based on Other Pavement Quality Indices
Model Equation Description
Park et al.(Park, Thomas, and Wayne Lee 2007)
log(PCI) = 2 − 0.436 log(IRI) IRI: International roughness index.
Dewan and Smith(Dewan and Smith 2002)
PCI = 153 − IRI
0.0171 IRI: International roughness index.
Arhin et al.(Arhin
et al. 2015) PCI = (A × IRI) + K + ε
IRI: International roughness index, A and K: Regression coefficients,
ε: Error Korea institute of
construction technology(Suh et al. 2018)
NHPCI = ((0.004xRD) + (0.003xCR) + (0.0183xIRI) + 0.33)−2
NHPCI: National highway pavement condition index, xRD: Ruth depth(mm), xCR: Crack ration(%), xIRI: International roughness index(m/km).
Korea expressway corporation research
institute(Suh et al. 2018)
HPCI = 5 − 0.75RD1.2− 0.54IRI0.8 − 0.9 log(1 + SD)
HPCI: Highway pavement condition index,
RD: Ruth depth(mm), IRI: International roughness index(m/km),
SD: Surface distress(crack quantity converted to area)(m2).
Ningyuan et al.(Ningyuan et al.
2001) PCI = DMI × Ci× √0.1 × RCI × 10
DMI: Distress manifestation index, Ci: Calibration coefficient for pavement type,
5
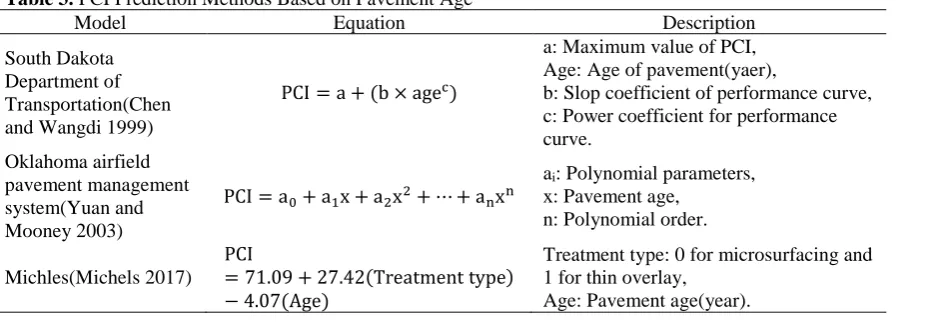
In the second category of PCI prediction methods, researchers focus on pavement age as a major prediction factor. The pavement age is directly linked to pavement distresses so that different types of damage are more likely to appear in an old pavement segment. Table 3 reveals examples of methods in this category.
Table 3. PCI Prediction Methods Based on Pavement Age
Model Equation Description
South Dakota Department of Transportation(Chen and Wangdi 1999)
PCI = a + (b × agec)
a: Maximum value of PCI, Age: Age of pavement(yaer),
b: Slop coefficient of performance curve, c: Power coefficient for performance curve.
Oklahoma airfield pavement management system(Yuan and Mooney 2003)
PCI = a0+ a1x + a2x2+ ⋯ + anxn
ai: Polynomial parameters, x: Pavement age,
n: Polynomial order.
Michles(Michels 2017)
PCI
= 71.09 + 27.42(Treatment type) − 4.07(Age)
Treatment type: 0 for microsurfacing and 1 for thin overlay,
Age: Pavement age(year).
The third category of PCI prediction methods involves the pavement surface deflections in the FWD test. FWD is a device used to evaluate the structural capacity of pavements. The appearance of different types of surface damage on pavements and their expansion reflects the deterioration of structural capacity of pavements. Given the above points, there is a mutual relationship between the FWD testing process and surface distresses of pavement. The paucity of research in this area was one of the reasons prompting the authors to investigate the relationship between pavement deflection data and PCI index. One of the few studies that falls into this category of PCI prediction methods is the research undertaken by O'Brein et al. They developed a model for predicting PCI, which in addition to deflections of surface pavement, drew on traffic data, pavement age and type of pavement(O'Brien III, Kohn, and Shahin 1983). Eq.1 shows the model proposed by O'Brein et al.
PCI = 96.6 − [(0.000572 × AGE2× LPMTOT × DIFF × AREA)
+ (0.3062 × AGE14× AGESOL2× DIFF2)
+ (0.00156 × AGE12× AGETOT × LPMTOT × DIFF × AREA)]
(1)
where:
6 LPMTOT: Log of weighted traffic total (veh/day), DIFF: Normalized deflection basin slope,
DIFF =D0− D12 D0
(2)
Di: Pavement surface deflection at i inches from center of loading plate in FWD test,
AREA: Area of FWD deflection basin at the high load level (in.2/103),
AREA = 12(D0+ D12) (3)
AGESOL: Age of pavement to last overlay (year), AGETOT: Total age of pavement (year).
The data used by O'Brein et al. were obtained from Virginia in the United States. In this study the pavement surface deflections data were collected using Dynatest 8000 FWD. Statistically, Eq.1 is moderately accurate, for a correlation coefficient (R2) and a standard error (σ) of 0.586 and 6.88 were obtained, respectively(O'Brien III, Kohn, and Shahin 1983).
Safety has always been a key factor in transportation engineering. As such, one major strength of the method proposed in this paper is that it eliminates the need for field inspection of pavement surface distresses, which significantly promotes the inspection safety. On the other hand, whenever human factor is involved in scientific processes, the possibility of error induced by inaccuracy and distraction cannot be ruled out. Thus, the accuracy of PCI estimation process could be improved by eliminating the human factor. Another strength of this study lies in its application of FWD. Due to its very accurate simulation of traffic load, FWD is a valid test endorsed by all transportation agencies and is extensively used in many parts of the world for structural evaluation of pavements. Therefore, the simultaneous use of FWD testing for structural evaluation of the pavement network and PCI estimation contributes to the overlapping of maintenance activities and diminishes the consumption budget. The last achievement of this is concerned with its role in filling the research gap in this area, which could lay the ground for future research in this field.
Methodology
7
in the third subsection, the data analysis methods are presented in the fourth subsection. Finally, the validation criteria for the analytical methods are discussed in the last subsection.
Pavement Condition Index (PCI)
One of the most common indices used to evaluate a flexible pavement is PCI. Introduced by the US Army Corps of Engineers, this index is based on visuals inspection of pavement(Shahin and Kohn 1981). The PCI value is a number from 100 to zero, with 100 representing the best pavement conditions and zero indicating the worst pavement conditions. To calculate PCI in a pavement segment, initially a number of 100 is assigned to that segment. Then, based on the type, extent and severity of the pavement distresses, a deduct value (DV) is subtracted from until PCI is finally obtained(Shahnazari et al. 2012). Table 4 shows the relationship between the pavement status and the value of PCI.
Table 4. Rating Scale of PCI(ASTM 2007)
PCI 0 - 10 10 - 25 25 – 40 40 – 55 55 – 70 70 – 85 85 - 100 Condition Failed Serious Very poor Poor Fair Satisfactory Good
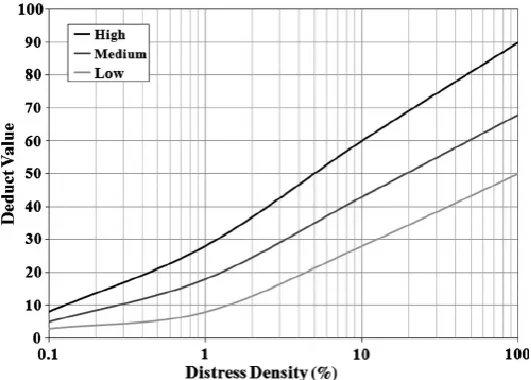
The process of PCI calculation in flexible pavements is summarized as follows(ASTM 2007; Shahin 2005): 1. Determine the type, extent and severity of pavement distresses
2. Determining DV for each distress based on its corresponding curve. Figure 1 shows an example of such curves.
Fig. 1. Typical deduct value curve(Shahin 2005)
3. Reducing the number of DVs to the maximum number allowed by Eq.4: mi= 1 +(100 − HDV) × 9
98 (4)
8 mi: Maximum allowable number of deduct values,
HDV: Greatest individual deduct value.
4. Determining the number of DVs greater than 2 (q).
5- Determining total deduct value (TDV), which is basically the sum of DVs.
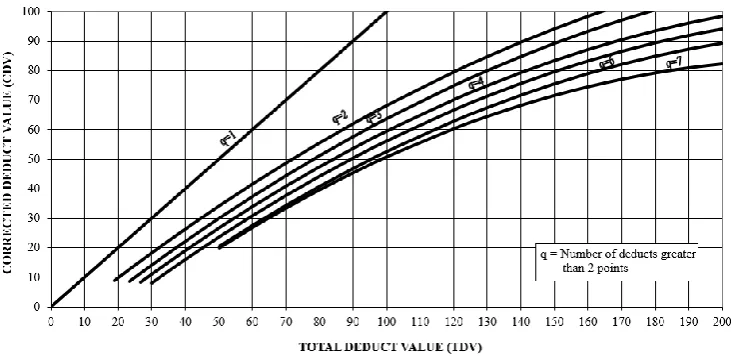
6. Determining corrected deduct value (CDV) based on correction curves using q and TDV. Figure 2 shows an example of correction curves.
Fig. 2. Typical corrected deduct value curve(Shahin 2005)
7. Decreasing the smallest DVs larger than 2 to 2. 8. Repeating steps 4 to 7 until q reaches 1.
9. Determining the maximum CDV and calculating the PCI using Eq.5:
PCI = 100 − CDVmax (5)
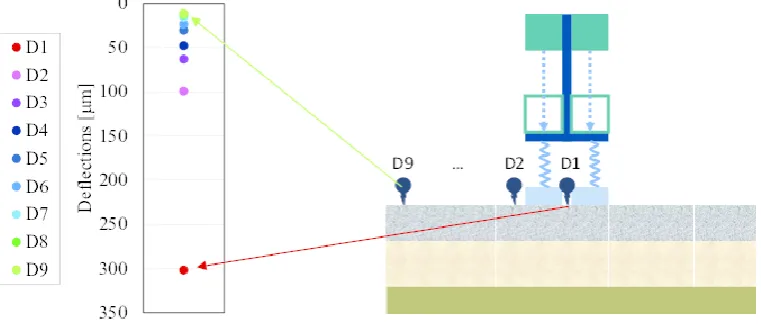
Falling Weight Deflectometer (FWD)
9
Fig. 3. Loading mechanism in FWD(De Chiara et al. 2012)
After the load is applied to the pavement surface, it generates vertical deflections, which are recorded by the sensors. Deflection data are transmitted to the central computer for later applications. Useful information such as remaining service life of pavement, overlay thickness and layers module can be obtained from the pavement surface deflections(Karballaeezadeh et al. 2019).
Case study
In this paper, 236 pavement segments were taken from Tehran-Qom freeway in Iran to implement the proposed theory. The study route is part of the artery between the capital and southern Iran, which is located in two provinces of Tehran and Qom. The freeway consists of 3 lanes in each direction with a width of 3.65 m for any lane. This freeway has a flexible pavement. A total of 236 pavement segments were selected from this freeway and the PCI was calculated as described in subsection pavement condition index. After calculating PCI, a load was applied to the pavement using an FWD equipped with 7 pavement deflection recording sensors. These sensors recorded the mean deflection in all pavement segments.
Analysis methods
10
Multi-layer Perceptron (MLP) Neural Network
There are three types of layers in MLP. The first layer is the input layer, which is concerned with the input data. The second type of layer is the output layer that deals with the model output. Between the input and output layers, there are intermediate layers known as hidden layers. The number of neurons in the input layer is equal to the number of input variables, while the output is generally the parameter considered for the analysis. The number of hidden layers and neurons in each hidden layer is determined experimentally. Generally, a hidden layer is sufficient for most analyses, but in highly complex systems, two hidden layers could be used. Each neuron in the hidden layer is connected to all the neurons in its preceding and succeeding layers(Nejad, Mehrabi, and Zakeri 2015). The amount of each neuron in the hidden layer and the output layer is determined based on the amount of each neuron in the previous layer, weights and bias. To do so, the amount of each neuron in the previous layer is multiplied by its weight and then the sum of the weighted values of neurons in the previous layer is obtained and combined with the bias. The obtained value is passed through an activation function and transferred to the next layer(Nejad, Mehrabi, and Zakeri 2015). Various activation functions are used in MLP, including Tansig, Linear, Sigmoid and Tanh.
Optimization algorithms used for model training play a key role in MLP performance. In other words, training optimization in a neural network is equivalent to minimizing a general error function, which is a multivariate function and depends on weights of the network. In this study, LM and SCG algorithms have been used to optimize MLP.
The LM algorithm introduced by Kenneth Levenberg and Donald Marquardt is a simple and stable convergence algorithm, which represents the most prevalent way of optimizing weights and biases in MLP networks(Yu and Wilamowski 2011). This algorithm is actually a combination of the steepest descent method and the Gauss-Newton algorithm, which is designed to alleviate computations by excluding the Hessian matrix(Ranganathan 2004). Interested readers can refer to (Hagan and Menhaj 1994) for further details regarding the application of the LM algorithm.
11
estimated using line search technique, which escalates the computational complexity. The SCG algorithm used in this paper is a CG algorithm that eliminates the line search technique and utilizes a step size scaling mechanism, thus accelerating the network learning process(Møller 1993; Kişi and Uncuoğlu 2005).
The MLP neural network used in this article has 40 neurons in 4 hidden layers for LM and SCG algorithm. Tansig, Sigmoid, Tansig, and Tansig sctivation functions, respectively, were used in hidden layers.
Radial Basis Function (RBF) Neural Network
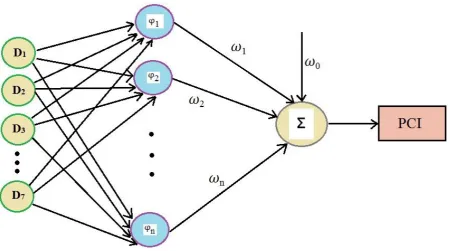
RBF is one of the most popular neural networks introduced by Broomhead and Lowe in 1988. Employed for both classification and regression purposes, this neural network is inspired by approximation function theory. The RBF generally has a three-layer feed-forward architecture in which an input layer connects to the output layer via a hidden layer(Broomhead and Lowe 1988; Sheng 2008). Figure 4 illustrates the structure of the RBF neural network adopted in this paper.
Fig. 4. Structure of RBF neural network used in this paper
12 y(x) = ∑ wjφj(‖x − cj‖)
N
j=1
(6)
where:
wj: Connection weight,
φj: Radial basis function,
‖x − cj‖: Euclidian distance between input data and radial function center.
13
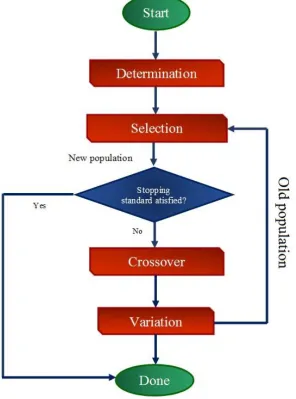
Fig. 5. A schematic of GA method in this study
14
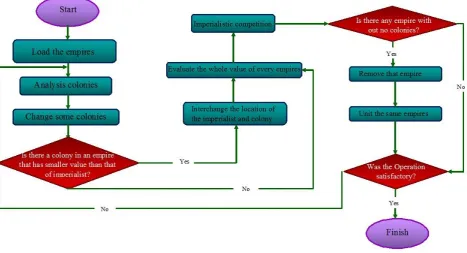
and they all enjoy the same position and value, the algorithm ends(Atashpaz-Gargari and Lucas 2007; Hosseini and Al Khaled 2014). Figure 6 shows the flowchart of the ICA algorithm.
Fig. 6. Flowchart of ICA
For GA and ICA algorithms used in this study, the number of neurons and the distribution coefficient were 55 and 0.37, respectively.
Committee Machine Intelligent System (CMIS)
The standard procedure in intelligence analysis is to consider several models for analysis and then select the best model based on the results. In this process, efforts made for the abandoned models are virtually in vain. This drawback could be fixed by a committee machine. In a committee machine, the results of different models are combined to reach a more accurate answer. The important thing in a committee machine is how to integrate models. In simple arithmetic averaging, all solutions have the same contribution, but in weighted averaging, the solutions are weighted based on their accuracy and then incorporated into the final solution(Nilsson 1965; Hashem and Schmeiser 1993; Perrone and Cooper 1992). In this paper, CMIS model was presented by using MLP-LM, MLP-SCG, RBF-GA, and RBF-ICA neural networks. Weighted coefficients were optimized by Solver. Table 5 shows the final weighted coefficients in CMIS.
Table 5. Coefficients of CMIS No. of coefficients Coefficients
15
C2 0.657295
C3 0.227583
C4 0.069749
C5 0.04656
Performance Criteria
In any scientific study, after analyzing data and calculating the analysis output, the results need to be reviewed and verified. Four statistical criteria have been used to validate the results in this study including APRE, AAPRE, RMSE and SD. These criteria are calculated according to the following Eqs. 7 to 10(Hemmati-Sarapardeh et al. 2018):
APRE =100
N ∑
PCIobserved,i− PCIpredicted,i PCIobserved,i N
i=1
(7)
AAPRE =100 N ∑
|PCIobserved,i− PCIpredicted,i| PCIobserved,i
N
i=1
(8)
RMSE = √1
N∑(PCIobserved,i− PCIpredicted,i) 2 N
i=1
(9)
SD = √ 1 N − 1∑ [
PCIobserved,i− PCIpredicted,i PCIobserved,i ]
2 N
i=1
(10)
All the above four statistical criteria represent some kind of computational errors, with smaller values close to zero indicating higher accuracy of the modeling results. By examining Eqs. 7 to 10, it becomes clear that APRE can be negative and the other three criteria are always positive.
Results
16
90, 120 and 150 cm away from the center of the loading plate. Figure 7 shows the relative impact of recorded PCI deflections. In this figure, D1 to D7 represent the deflections in geophones 1 to 7, respectively. As shown
in Figure 7, geophones 1 to 3 are inversely related while other geophones are directly related to PCI. The deflections in geophone 7, which is the furthest from the loading spot, wields the highest impact on PCI.
Fig. 7. The relative effect of input parameters on PCI
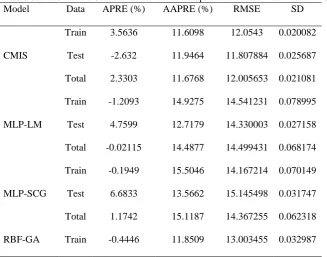
Table 6 lists the statistical parameters of APRE, AAPRE, RMSE and SD for all the models developed in this paper. Considering AARPE and APRE values for the CMIS model (11.67% and 2.33%, respectively) and lower RMSE and SD errors in the CMIS method compared to other models, this model yields the highest accuracy for predicting PCI among the developed models.
Table 6. Performance Criteria of The All Developed Models for Prediction of PCI
Model Data APRE (%) AAPRE (%) RMSE SD
CMIS
Train 3.5636 11.6098 12.0543 0.020082 Test -2.632 11.9464 11.807884 0.025687 Total 2.3303 11.6768 12.005653 0.021081
MLP-LM
Train -1.2093 14.9275 14.541231 0.078995 Test 4.7599 12.7179 14.330003 0.027158 Total -0.02115 14.4877 14.499431 0.068174
MLP-SCG
Train -0.1949 15.5046 14.167214 0.070149 Test 6.6833 13.5662 15.145498 0.031747 Total 1.1742 15.1187 14.367255 0.062318 RBF-GA Train -0.4446 11.8509 13.003455 0.032987
-0.06 -0.04 -0.02 0 0.02 0.04 0.06 0.08 0.1
D1 D2
D3 D4
D5 D6
D7
R
elev
an
cy
Facto
17
Test 14.2997 19.406 58.919147 0.360989 Total 2.4902 13.3547 28.747779 0.096868
RBF-ICA
Train -0.5063 12.6392 17.077364 0.057202 Test 16.7628 25.886 45.214386 0.45286 Total 2.9311 15.276 25.308415 0.134177
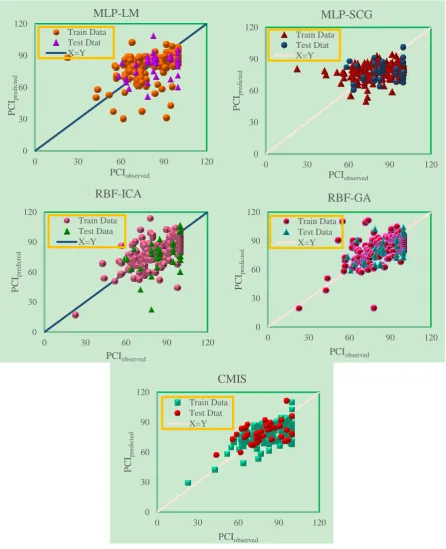
According to Figure 8, one can visually analyze the quality of all models developed to predict PCI of asphalt pavement. In this figure, a graph is presented for all five models proposed in this research. In each graph, the horizontal axis represents PCIobserved values and the vertical axis represents PCIpredicted values. In Figure 8, the
18
Fig. 8. Cross-plot for developed models to prediction of PCI
Figure 9 reveals the relative error distribution curves. In general, and for each model, the closer the data points are to the horizontal line of zero error, the greater the accuracy of the model is. According to Figure 9, the highest relative error between PCIobserved and PCIpredicted in the CMIS model is less than 33%, which is superior
to other models. Thus, Figure 9 also confirms the greater accuracy of the CMIS model compared to other models. 0 30 60 90 120
0 30 60 90 120
P
C
Ipredi
ct ed PCIobserved MLP-LM Train Data Test Dtat X=Y 0 30 60 90 120
0 30 60 90 120
P
C
Ipredi
ct ed PCIobserved MLP-SCG Train Data Test Dtat X=Y 0 30 60 90 120
0 30 60 90 120
P
C
Ipredi
ct ed PCIobserved RBF-ICA Train Data Test Data X=Y 0 30 60 90 120
0 30 60 90 120
P
C
Ipredi
ct ed PCIobserved RBF-GA Train Data Test Data X=Y 0 30 60 90 120
0 30 60 90 120
P
C
Ipredi
19
Fig. 9. Relative error between the observed and predicted PCI versus observed PCI
The cumulative frequency curve of AAPRE for models developed in this paper is presented in Figure 10. The analysis of curves in this figure suggests that the quality of results in models based on RBF neural network is higher than models based on MLP neural network, especially RBF-GA model, which has a lower error in PCI prediction. The curve of the CMIS model, which is the median of the results achieved from four MLP-LM, MLP-SCG, RBF-GA and RBG-ICA methods, lies in the middle of these four methods. However, the end
-80 -60 -40 -20 0 20 40 60 80
0 30 60 90 120
R elativ e E rr o r (%) PCIobserved MLP-SCG -80 -60 -40 -20 0 20 40 60 80
0 30 60 90 120
R elativ e E rr o r (%) PCIobserved MLP-LM -80 -60 -40 -20 0 20 40 60 80
0 30 60 90 120
R elativ e E rr o r (%) PCIobserved RBF-ICA -80 -60 -40 -20 0 20 40 60 80
0 30 60 90 120
R elativ e E rr o r (%) PCIobserved RBF-GA -80 -60 -40 -20 0 20 40 60 80
0 30 60 90 120
20
point of the CMIS curve is in a better position than all four methods, which corroborates the higher quality of the CMIS model in PCI prediction.
Fig. 10. Cumulative frequency curve of average absolut relative error for developed models in this study to predict PCI Conclusion
In this paper, authors attempted to present a method for predicting the performance of flexible pavements. The most common way to evaluate flexible pavement performance is to adopt an index as an indicator of pavement performance. In this study, PCI was used as an index of pavement performance. PCI is a numerical index obtained from the surface pavement distresses and its value is in the range of 0 to 100. A high quality pavement has a PCI of 100 while a virtually unusable pavement has a PCI of zero. The conventional way to determine PCI involves inspecting and recording surface distresses of pavement, which suffers from two major drawbacks: safety risks facing the pavement inspector, and human errors when recording information and calculations. The method proposed in this paper aims to predict the pavement performance using FWD test results. The FWD is a non-destructive test used in pavement engineering that assesses pavement by applying loads identical to the traffic load. The load applied during the FWD test triggers pavement deflections, which are used as input parameters to predict PCI in this paper. Since FWD is generally used in pavement network maintenance applications, the method proposed in this paper contributes to the overlapping
0 0.1 0.2 0.3 0.4 0.5 0.6 0.7 0.8 0.9 1
0 10 20 30 40
C
u
m
u
lativ
e
Fre
q
u
en
cy
21
of pavement maintenance activities and eliminates the aforesaid shortcomings by abandoning the conventional PCI calculation method.
To implement the proposed theory in this paper, data set including PCI and pavement surface deflections were collected based on FWD testing of 236 pavement segments taken from Tehran-Qom freeway in Iran. The data set was analyzed by two MLP and RBF neural networks. For optimization of MLP neural network, LM and SCG algorithms were used and also for optimization of RBF neural network both ICA and GA algorithms were used. To improve the results of four neural networks adopted in this study, CMIS method was employed. In general, committee machines combine the results of different methods to improve results. The results of this paper were verified by four statistical criteria including APRE, AAPRE, RMSE and SD, the values of which in the CMIS method were 2.3303, 11.6768, 12.0056 and 0.0210, respectively.
Given the paucity of studies that have adopted a theory comparable to the one proposed in this paper, this research is expected to pave the way for future studies in similar areas of research.
References
Alam, Mahamad Nabab, Biswarup Das, and Vinay Pant. 2015. 'A comparative study of metaheuristic optimization
approaches for directional overcurrent relays coordination', Electric Power Systems Research, 128: 39-52.
Arhin, Stephen A, Lakeasha N Williams, Asteway Ribbiso, and Melissa F Anderson. 2015. 'Predicting pavement
condition index using international roughness index in a dense urban area', Journal of Civil Engineering
Research, 5: 10-17.
ASTM, D. 2007. '6433-07,(2007)', Standard Practice for Roads and Parking Lots Pavement Condition Index Surveys,
American Society for Testing and Materials.
Atashpaz-Gargari, Esmaeil, and Caro Lucas. 2007. "Imperialist competitive algorithm: an algorithm for optimization
inspired by imperialistic competition." In 2007 IEEE congress on evolutionary computation, 4661-67. IEEE.
Broomhead, David S, and David Lowe. 1988. "Radial basis functions, multi-variable functional interpolation and adaptive networks." In.: Royal Signals and Radar Establishment Malvern (United Kingdom).
Chen, Jian-Shiuh, and Kunzang Wangdi. 1999. 'Proposal of a New Road Surface Management System (RSMS) for
Developing Countries', Doboku Gakkai Ronbunshu, 1999: 83-94.
Davis, Lawrence. 1991. 'Handbook of genetic algorithms'.
De Chiara, F, D Pereira, S Fontul, and E Fortunato. 2012. 'Track Substructure Assessment using Non-Destructive Load
Tests. A Portuguese Case Study', Procedia-Social and Behavioral Sciences, 53: 1129-38.
Dewan, SA, and RE Smith. 2002. 'Estimating IRI from pavement distresses to calculate vehicle operating costs for the
cities and counties of San Francisco Bay area', Transportation Research Record.
France-Mensah, Jojo, and William J O’Brien. 2019. 'Developing a Sustainable Pavement Management Plan: Tradeoffs
in Road Condition, User Costs, and Greenhouse Gas Emissions', Journal of Management in Engineering, 35:
04019005.
Hagan, Martin T, and Mohammad B Menhaj. 1994. 'Training feedforward networks with the Marquardt algorithm', IEEE transactions on Neural Networks, 5: 989-93.
Hashem, Sherif, and Bruce Schmeiser. 1993. Approximating a function and its derivatives using MSE-optimal linear
combinations of trained feedforward neural networks (Purdue University, Department of Statistics).
Haykin, Simon S. 2009. Neural networks and learning machines/Simon Haykin (New York: Prentice Hall).
Hemmati-Sarapardeh, Abdolhossein, Amir Varamesh, Maen M Husein, and Kunal Karan. 2018. 'On the evaluation of
the viscosity of nanofluid systems: Modeling and data assessment', Renewable and Sustainable Energy Reviews,
22
Hosseini, Seyedmohsen, and Abdullah Al Khaled. 2014. 'A survey on the imperialist competitive algorithm
metaheuristic: implementation in engineering domain and directions for future research', Applied Soft
Computing, 24: 1078-94.
Karballaeezadeh, Nader, Danial Mohammadzadeh S, Shahaboddin Shamshirband, Pouria Hajikhodaverdikhan, Amir Mosavi, and Kwok-wing Chau. 2019. 'Prediction of remaining service life of pavement using an optimized
support vector machine (case study of Semnan–Firuzkuh road)', Engineering Applications of Computational
Fluid Mechanics, 13: 188-98.
Karim, Asim, and Hojjat Adeli. 2003. 'Radial basis function neural network for work zone capacity and queue
estimation', Journal of Transportation Engineering, 129: 494-503.
Kişi, Özgür, and Erdal Uncuoğlu. 2005. 'Comparison of three back-propagation training algorithms for two case studies'. Levenberg, Eyal, Matteo Pettinari, Susanne Baltzer, and Britt Marie Lekven Christensen. 2018. 'Comparing Traffic
Speed Deflectometer and Falling Weight Deflectometer Data', Transportation Research Record, 2672: 22-31.
Michels, Dominic J. 2017. 'Pavement Condition Index and Cost of Ownership Analysis on Preventative Maintenance Projects in Kentucky'.
Møller, Martin Fodslette. 1993. 'A scaled conjugate gradient algorithm for fast supervised learning', Neural networks, 6:
525-33.
Nejad, Fereidoon Moghadas, Ahmad Mehrabi, and Hamzeh Zakeri. 2015. 'Prediction of Asphalt Mixture Resistance
Using Neural Network via Laboratorial X-ray Images', Journal of Industrial and Intelligent Information Vol, 3.
Nilsson, Nils J. 1965. 'Learning machines'.
Ningyuan, Li, Tom Kazmierowski, Susan Tighe, and Ralph Haas. 2001. "Integrating dynamic performance prediction
models into pavement management maintenance and rehabilitation programs." In 5th International Conference
on Managing Pavements.
O'Brien III, Dixon E, Starr D Kohn, and Mohamed Y Shahin. 1983. 'Prediction of Pavement Performance by Using
Nondestructive Test Results', Transportation Research Record.
Park, Kyungwon, Natacha E Thomas, and K Wayne Lee. 2007. 'Applicability of the international roughness index as a
predictor of asphalt pavement condition', Journal of Transportation Engineering, 133: 706-09.
Perrone, Michael P, and Leon N Cooper. 1992. "When networks disagree: Ensemble methods for hybrid neural networks." In.: BROWN UNIV PROVIDENCE RI INST FOR BRAIN AND NEURAL SYSTEMS.
Ranganathan, Ananth. 2004. 'The levenberg-marquardt algorithm', Tutoral on LM algorithm, 11: 101-10.
Shah, Yogesh U, SS Jain, Devesh Tiwari, and MK Jain. 2013. 'Development of overall pavement condition index for
urban road network', Procedia-Social and Behavioral Sciences, 104: 332-41.
Shahin, Mohamed Y. 2005. Pavement management for airports, roads, and parking lots (Springer New York).
Shahin, Mohamed Y, and Starr D Kohn. 1981. "Pavement maintenance management for roads and parking lots." In.: CONSTRUCTION ENGINEERING RESEARCH LAB (ARMY) CHAMPAIGN IL.
Shahnazari, Habib, Mohammad A Tutunchian, Mehdi Mashayekhi, and Amir A Amini. 2012. 'Application of soft
computing for prediction of pavement condition index', Journal of Transportation Engineering, 138: 1495-506.
Sheng, ZENG. 2008. 'Pavement performance evaluating model by using RBF', Journal of Highway and Transportation
Research and Development, 3.
Suh, Young-chan, Hong-jun Kwon, Ki-soo Park, Byung-sik Ohm, and Boo-il Kim. 2018. 'Correlation Analysis between
Pavement Condition Indices in Korean Roads', KSCE Journal of Civil Engineering, 22: 1162-69.
Suraji, A, AT Sudjianto, and Riman Riman. 2018. 'ANALYSIS OF ROAD SURFACE DEFECTS USING ROAD
CONDITION INDEX METHOD ON THE CARUBAN-NGAWI ROAD SEGMENT', JOURNAL OF
SCIENCE AND APPLIED ENGINEERING, 1.
Yildirim, Sahin, and Ibrahim Uzmay. 2001. 'Statistical analysis of vehicles' vibration due to road roughness using radial basis artificial neural network', Applied Artificial Intelligence, 15: 419-27.
Yu, Hao, and Bogdan M Wilamowski. 2011. 'Levenberg-marquardt training', Industrial electronics handbook, 5: 1.
Yuan, Jie, and Michael A Mooney. 2003. 'Development of adaptive performance models for Oklahoma Airfield