Page 1 of 10 Original Article
Test-retest variability of brain morphometry analysis: an
investigation of sequence and coil effects
Shuang Yan1, Tianyi Qian2, Bénédicte Maréchal3,4,5, Tobias Kober3,4,5, Xianchang Zhang2, Jinxia Zhu2, Jing Lei1, Mingli Li1, Zhengyu Jin1
1Department of Radiology, Peking Union Medical College Hospital, Peking Union Medical College, Chinese Academy of Medical Sciences, Beijing
100730, China; 2Department of MR Collaboration, Siemens Healthcare Ltd., Beijing 100102, China; 3Department of Advanced Clinical Imaging Technology, Siemens Healthcare, Lausanne, Switzerland; 4Department of Radiology, Lausanne University Hospital and University of Lausanne, Lausanne, Switzerland; 5LTS5, École Polytechnique Fédérale de Lausanne (EPFL), Lausanne, Switzerland
Contributions: (I) Conception and design: S Yan, T Qian; (II) Administrative support: Z Jin; (III) Provision of study materials or patients: S Yan, T Qian, M Li; (IV) Collection and assembly of data: J Lei, M Li, S Yan; (V) Data analysis and interpretation: B Maréchal, T Kober, X Zhang, J Zhu; (VI) Manuscript writing: All authors; (VII) Final approval of manuscript: All authors.
Correspondence to: Zhengyu Jin, MD. Department of Radiology, Peking Union Medical College Hospital, Peking Union Medical College, Chinese Academy of Medical Sciences, No. 1 Shuaifuyuan, Dongcheng District, Beijing 100730, China. Email: [email protected].
Background: Precise and reliable brain morphometry analysis is critical for clinical and research purposes. The magnetization-prepared rapid gradient echo (MPRAGE), multi-echo MPRAGE (MEMPRAGE) and magnetization-prepared 2 rapid acquisition gradient echo (MP2RAGE) sequences have all been used to acquire brain structural images, but it is unclear which of these sequences is the most suitable for brain morphometry and whether the number of coil channels (20 or 32) affects scan precision. This study aimed to assess the impact of T1-weighted image acquisition variables (sequence and head coil) on the repeatability of resultant automated volumetric measurements.
Methods: Twenty-four healthy volunteers underwent back-to-back scanning protocols with three sequences and two different coils (i.e., six scanning conditions in total) presented in a randomized order in a single session. MorphoBox prototype and FreeSurfer were used for brain segmentation. Brain structures were divided into cortical and subcortical regions for more precise analysis. The acquired volume and thickness values were used to calculate test-retest variability (TRV) values. TRV values from the six different combinations were compared for total brain structures, total cortical structures, total subcortical structures, and every single structure.
Results: The median TRV value for all brain regions was 1.23% with MorphoBox and 3.14% with FreeSurfer. When using FreeSurfer results to compare the six combinations, for total brain structures volume and total cortical structures volume and thickness, the MEMPRAGE-32 channel combination showed significantly lower TRV values than the others (P<0.01). Similar results were observed with MorphoBox. For total subcortical structures, the MP2RAGE-32 channel combination showed the lowest TRV values with both MorphoBox (lower about 0.01% to 0.17%) and FreeSurfer analyses (lower about 0.02% to 0.37%). Conclusions: TRV values were generally low, indicating generally high reliability for every region. The MEMPRAGE sequence was the most reliable of the three sequences for total brain structures and cortical structures. However, MP2RAGE was the most reliable for subcortical structures. The 32-channel coil showed better repeatability results than the 20-channel coil.
Keywords: Test-retest variability (TRV); magnetic resonance imaging (MRI) repeatability; brain morphometry; post-processing robustness
Submitted Sep 16, 2019. Accepted for publication Nov 06, 2019. doi: 10.21037/atm.2019.11.149
Introduction
The precise and robust visualization and delineation of brain structures are crucial for both clinical and research purposes (1-3). Automated morphometric analysis, based on high-resolution structural magnetic resonance imaging (MRI) data, has been widely used in cross-sectional and longitudinal research studies to visualize and delineate brain structures. The sensitivity of morphometry to detect changes in these studies depends on the reliability of the analysis (4). However, test-retest variability (TRV) can be affected by changes in pulse sequences and radio-frequency (RF) coils (5,6).
Several sequences can be used to acquire high-resolution 3D T1-weighted brain structural images which can then be used in morphometric analyses. One of the most widely used pulse sequences is the magnetization-prepared rapid gradient echo (MPRAGE) sequence (7), which is considered to be the standard sequence for structural brain imaging. This sequence can produce excellent T1-weighted contrast between gray matter (GM), white matter (WM), and cerebrospinal fluid (CSF), and delivers good overall image quality. MPRAGE sequence commonly consists of a magnetization preparation (MP) period, which is denoted as an inversion time (TI) after an inversion pulse, and a rapid gradient-echo (RAGE) readout, which is a FLASH (8) or a FISP (9) module. However, this sequence’s image quality is sensitive to the inhomogeneity of the transmit (B1+) and receive (B1–) RF fields (10). The inhomogeneity and distortion of the main magnetic (B0) field may also influence image quality (11).
Recently, new sequences have been developed based on the conventional MPRAGE sequence. One such sequence is the multi-echo MPRAGE (MEMPRAGE) sequence. A multi-echo sequence usually consists of four echoes with higher bandwidths instead of a single echo sequence that has a lower bandwidth. The higher bandwidths can help decrease B0-related distortions and enhance the reproduc-ibility of morphometry measurements without sacrificing the signal-to-noise ratio (SNR), as the different echoes are typically combined. The MEMPRAGE sequence is also better able to segment anatomy from the dura to the cortex, resulting in structures with fine edges that allow for precise registration across contrasts (11,12), taking advantage of the largely different T2* characteristics of these tissues.
The magnetization-prepared 2 rapid acquisition gradient echo (MP2RAGE) sequence (13) is another such sequence. This sequence applies a time-efficient measure that can
significantly lessen image biases and help prevent the impact of inhomogeneity induced by the reception and transmit RF fields. The sequence introduces the RAGE block twice and collects two full image sets during each of the two different TIs. The scan parameters are optimized so that one image can be synthesized by combining the two image sets and can provide eminent contrast across different brain tissues. The T1-weighted image, in which the cortical GM is efficiently nulled at the center of the k-space, is made by the first TI (TI1); the second TI (TI2) is long, thus it can approximately generate a proton density weighted contrast. Consensus has yet to be about which of these high-resolution 3D T1-weighted sequences is the most reliable and reproducible. Furthermore, few previous studies have compared these three sequences with each other.
Brain image quality is also influenced by the number of receiver channels in the utilized head coil. A phased-array coil with more channels can permit accelerated imaging and can significantly improve the SNR throughout the brain, especially in the cortex (14-16). However, it is unclear whether the number of coil channels affects scan and segmentation robustness.
The objectives of this study are to compare the repeatability of morphometric measures derived from the three aforementioned sequences, to investigate whether the results are consistent among different brain regions, such as between the cortical structures and subcortical structures, and to determine if RF coils impact the precision of the MRI scan and derived morphometric analysis.
Methods
Participants
The Institutional Review Board of our hospital approved this study, and informed consent was obtained from all the participants. Twenty-four healthy volunteers (12 males) with no history of severe head trauma, brain tumors, or neurological or psychiatric disorders were recruited. The mean age of the volunteers was 27.5 (range from 22 to 30) years old.
Imaging acquisition
T1-weighted sequences; scan parameters are shown in Table 1. All participants underwent scanning with all sequences, with both a 20-channel head-neck coil and a 32-channel head coil. Therefore, there were six experimental conditions: MPRAGE-20 channel, MPRAGE-32 channel, MEMPRAGE-20 channel, MEMPRAGE-32 channel, MP2RAGE-20 channel, and MP2RAGE-32 channel. The participants were assigned to undergo the six sequence-coil combinations in a randomized order. A rescan of each sequence-coil combination was performed immediately after the first scan, so that scan repeatability could be evaluated.
Image processing
Both the MorphoBox prototype and FreeSurfer were used to automatically segment brain structures and measure brain region volumes.
MorphoBox
The MorphoBox prototype is a fast-inline volume-based
morphometry algorithm (2,17-20). This algorithm is integrated into the image reconstruction chain of all three T1-weighted sequences so that brain structure volumes can be obtained directly in the scanner. It takes as input either a 3D MPRAGE, the result of root-mean-square combination of all four echoes in case of MEMPRAGE acquisition, or both the second inversion contrast and uniform original image in case of MP2RAGE acquisition. It combines atlas-free tissue classification and atlas-based brain segmentation to estimate the volume of 45 regions in approximately 2 minutes. Regions are further referred to as tissue [i.e., total intracranial volume (TIV), GM, WM, and CSF] or structures (i.e., subcortical nuclei, such as the thalamus, putamen, caudate, pallidum, and hippocampus; the GM and WM of the frontal, parietal, occipital, and temporal lobes; the ventricular system; the corpus callosum; the cerebellum; and the brainstem). Additionally, we gathered regions into cortical and subcortical structures based on their anatomical position for further detailed comparisons.
FreeSurfer
FreeSurfer v5.3.0 (http://surfer.nmr.mgh.harvard.edu) (21) measures cortical thickness using a surface-based model and measures subcortical volume using a volume-based model. Detailed descriptions of the segmentation procedure have been reported in previous studies (22,23). Briefly, the default processing stream (recon-all) and the segmentation consist of the following steps: registering the images to a template, normalizing the intensity, skull stripping the images, segmenting the structures, and statistical analyses.
A total of 148 cortical structure regions, 45 subcortical structures, and 70 WM structures were automatically segmented; their volumes were calculated using FreeSurfer. Both the volume and thickness values of the cortical structure regions were acquired.
Statistical analysis
[image:3.595.44.286.94.346.2]TRV was used to evaluate the reliability of the measurements from both MorphoBox and FreeSurfer for each brain region generated by each sequence and coil combination. Lower TRV values indicate lower variability and higher repeatability. TRV was calculated using the following equation: TRV%=|M1–M2|×2×100%/(M1+M2) (24), which was defined as the absolute difference divided by the mean of two measurements. M1 and M2 indicate the first (test) and the second (retest) measurements, respectively.
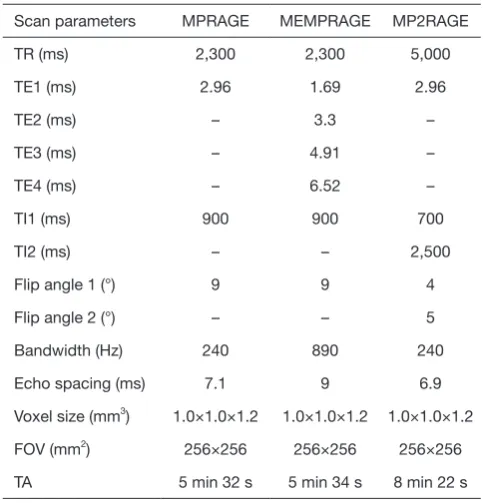
Table 1 Acquisition parameters for the three sequences
Scan parameters MPRAGE MEMPRAGE MP2RAGE
TR (ms) 2,300 2,300 5,000
TE1 (ms) 2.96 1.69 2.96
TE2 (ms) – 3.3 –
TE3 (ms) – 4.91 –
TE4 (ms) – 6.52 –
TI1 (ms) 900 900 700
TI2 (ms) – – 2,500
Flip angle 1 (°) 9 9 4
Flip angle 2 (°) – – 5
Bandwidth (Hz) 240 890 240
Echo spacing (ms) 7.1 9 6.9
Voxel size (mm3) 1.0×1.0×1.2 1.0×1.0×1.2 1.0×1.0×1.2
FOV (mm2) 256×256 256×256 256×256
TRV values of all brain regions were analyzed together as TRV for total brain structures, TRV values of all cortical regions were analyzed together as TRV for total cortical structures, and TRV values of all the subcortical regions were analyzed together as TRV for total subcortical structures. TRV values for every single structure, total brain structures, total cortical structures, and total subcortical structures were then compared among the six combinations using the Friedman test. Differences between each pair of combinations were measured using Student-Newman-Keuls post hoc analysis. All P values were 2-tailed. P<0.05 was considered to be statistically significant. All statistical analyses were performed using SPSS20 (IBM, Armonk, NY, USA).
Results
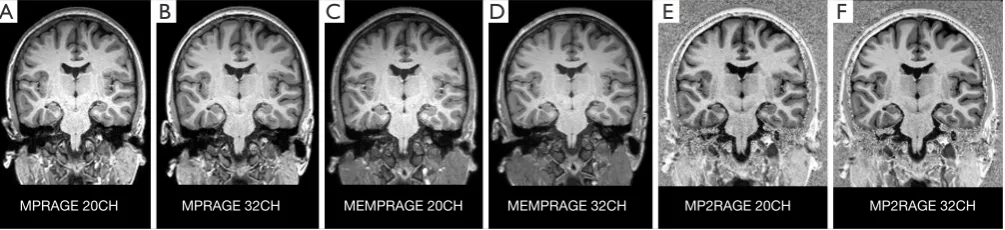
Structural images acquired with different combinations of sequences and coils are displayed in Figure 1.
MorphoBox-based volumetry repeatability comparison
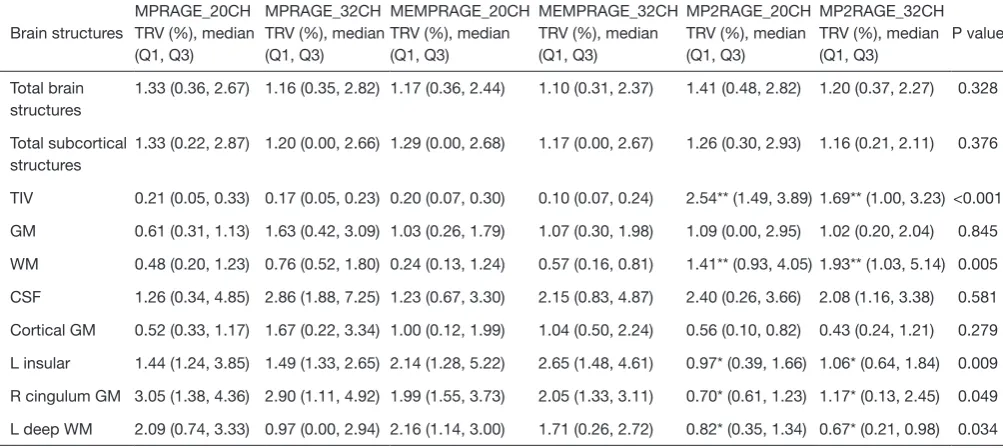
The median TRV calculated by the data acquired by MorphoBox was 1.23% (range, 0.00–9.89%) for all brain regions. Comparisons of the six different combinations and significant differences between the median TRV values of total brain structures, subcortical structures, brain tissue (TIV, GM, WM, CSF, cortical GM), and structural regions are shown in Table 2. All values are given in the form of median (first quartile, third quartile). TRV values were not significantly different between the different coil/sequence combinations for total brain structures and total subcortical structures. The median TRV value of the MEMPRAGE-32
channel combination for total brain structures was 1.10% (0.31%, 2.37%) and was slightly lower than that of other combinations. The MEMPRAGE sequence had the lowest TRV values among the three sequences for total brain structures, regardless of which coil was used. The MP2RAGE-32 channel combination had the lowest median TRV value [1.16% (0.21%, 2.11%)] for total subcortical structures. The TRV values of the MP2RAGE sequence were numerically lower than those for total subcortical structures regardless of which type of coil was used (lower 0.01% to 0.17%). The TRV values of the 32-channel coil were lower than those of the 20-channel coil, regardless of sequence, for both total brain structures and total subcortical structures.
[image:4.595.48.551.85.200.2]Regarding single tissues and structures, the TRV values were only significantly different between the six combinations for the TIV, WM, left deep WM, and the left insular and right cingulum GM. For the TIV, the TRV of the MEMPRAGE-32 channel combination was the lowest [0.10% (0.07%, 0.24%)]. The following TRV values for the other combinations are listed here in ascending order: MPRAGE-32 channel [0.17% (0.05%, 0.23%)], MEMPRAGE-20 channel [0.20% (0.07%, 0.30%)], MPRAGE-20 channel [0.21% (0.05%, 0.33%)], MP2RAGE-32 channel [1.69% (1.00%, 3.23%)], and MP2RAGE-20 channel [2.54% (1.49%, 3.89%)]; the TRV values of the final two combinations were significantly higher than those of the other combinations. The TRV values for the MP2RAGE-32 channel and MP2RAGE-20 channel combinations were also significantly higher than those of the other four combinations for WM. However, these two combinations had significantly lower TRV values
Figure 1 Overview of structural images from the same subject acquired with the (A) MPRAGE-20 channel, (B) MPRAGE-32 channel, (C) MEMPRAGE-20 channel, (D) MEMPRAGE-32 channel, (E) MP2RAGE-20 channel, and (F) MP2RAGE-32 channel combinations. MPRAGE, magnetization-prepared rapid gradient echo; MEMPRAGE, multi-echo MPRAGE; MP2RAGE, magnetization-prepared 2 rapid acquisition gradient echo; CH, channel.
MPRAGE 20CH MPRAGE 32CH MEMPRAGE 20CH MEMPRAGE 32CH MP2RAGE 20CH MP2RAGE 32CH
than those of the other four combinations for the left insular and right cingulum GM regions and the left deep WM regions. The MEMPRAGE-32 channel combination had the lowest TRV values in approximately 33.3% of all brain regions that had comparable TRV values across the six combinations; no other combination yielded optimal TRV values at a higher rate. The MP2RAGE-32 channel had the lowest TRV values among 30.8% of single regions within the subcortex; no other combination yielded optimal TRV values at a higher rate.
FreeSsurfer-based volumetry repeatability comparison
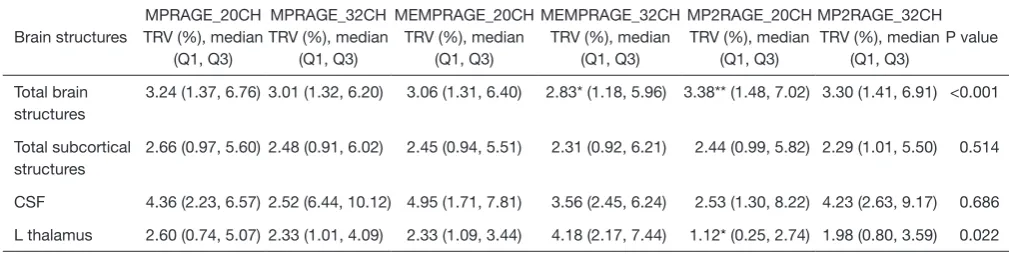
The median TRV value was 3.14% and all TRV values ranged from 0.00% to 16.46% in the data set generated by FreeSurfer. Comparisons and significant differences between TRV values for the total brain structures, total subcortical structures, and single subcortical structure are presented in Table 3. The MEMPRAGE-32 channel combination [2.83% (1.18%, 5.96%)] yielded the lowest TRV values, which were significantly lower than those of the MPRAGE-32 channel combination [3.01% (1.32%, 6.20%)] and the MEMPRAGE-20 channel combination
[3.06% (1.31%, 6.40%)]. The TRV values for the MPRAGE-20 channel combination [3.24% (1.37%, 6.76%)] and MP2RAGE-32 channel combination [3.30% (1.41%, 6.91%)] were significantly higher than the values of the three aforementioned combinations but were significantly lower than the values of the MP2RAGE-20 channel combination [3.38% (1.48%, 7.02%)]. There were no significant differences in TRV values for the total subcortical structures across the six combinations, but the MP2RAGE-32 channel combination [2.29% (1.01%, 5.50%)] yielded the lowest TRV of all the combinations (lower about 0.02% to 0.37%). Regardless of coil, the TRV values for the MP2RAGE sequence were lower than those of the total subcortical structures. Additionally, regardless of sequence, the TRV values of the 32-channel coil were lower than those of the 20-channel coil. There were no significant differences between the six combinations for all the single subcortical and WM structures except for the left thalamus, in which the TRV for MP2RAGE-20 channel condition [1.12% (0.25%, 2.74%)] was significantly lower than that of other conditions.
[image:5.595.46.548.99.323.2]Comparisons and significant differences between TRV values for the volume and thickness of total cortical
Table 2 TRV values of the six combinations with MorphoBox
Brain structures
MPRAGE_20CH TRV (%), median (Q1, Q3)
MPRAGE_32CH TRV (%), median (Q1, Q3)
MEMPRAGE_20CH TRV (%), median (Q1, Q3)
MEMPRAGE_32CH TRV (%), median (Q1, Q3)
MP2RAGE_20CH TRV (%), median (Q1, Q3)
MP2RAGE_32CH TRV (%), median (Q1, Q3)
P value
Total brain structures
1.33 (0.36, 2.67) 1.16 (0.35, 2.82) 1.17 (0.36, 2.44) 1.10 (0.31, 2.37) 1.41 (0.48, 2.82) 1.20 (0.37, 2.27) 0.328
Total subcortical structures
1.33 (0.22, 2.87) 1.20 (0.00, 2.66) 1.29 (0.00, 2.68) 1.17 (0.00, 2.67) 1.26 (0.30, 2.93) 1.16 (0.21, 2.11) 0.376
TIV 0.21 (0.05, 0.33) 0.17 (0.05, 0.23) 0.20 (0.07, 0.30) 0.10 (0.07, 0.24) 2.54** (1.49, 3.89) 1.69** (1.00, 3.23) <0.001
GM 0.61 (0.31, 1.13) 1.63 (0.42, 3.09) 1.03 (0.26, 1.79) 1.07 (0.30, 1.98) 1.09 (0.00, 2.95) 1.02 (0.20, 2.04) 0.845
WM 0.48 (0.20, 1.23) 0.76 (0.52, 1.80) 0.24 (0.13, 1.24) 0.57 (0.16, 0.81) 1.41** (0.93, 4.05) 1.93** (1.03, 5.14) 0.005
CSF 1.26 (0.34, 4.85) 2.86 (1.88, 7.25) 1.23 (0.67, 3.30) 2.15 (0.83, 4.87) 2.40 (0.26, 3.66) 2.08 (1.16, 3.38) 0.581
Cortical GM 0.52 (0.33, 1.17) 1.67 (0.22, 3.34) 1.00 (0.12, 1.99) 1.04 (0.50, 2.24) 0.56 (0.10, 0.82) 0.43 (0.24, 1.21) 0.279
L insular 1.44 (1.24, 3.85) 1.49 (1.33, 2.65) 2.14 (1.28, 5.22) 2.65 (1.48, 4.61) 0.97* (0.39, 1.66) 1.06* (0.64, 1.84) 0.009
R cingulum GM 3.05 (1.38, 4.36) 2.90 (1.11, 4.92) 1.99 (1.55, 3.73) 2.05 (1.33, 3.11) 0.70* (0.61, 1.23) 1.17* (0.13, 2.45) 0.049
structures and every single cortical structure across the six combinations are displayed in Table 4. Analyzed with volume data, the TRV values for total cortical structures were significantly different between the six combinations. The TRV for the MEMPRAGE-32 channel combination [3.43% (1.58%, 6.81%)] was the lowest. The TRV values for the MPRAGE-32 channel [3.70% (1.69%, 7.04%)] and MEMPRAGE-20 channel [3.83% (1.74%, 7.75%)] combinations were significantly higher than the values for the MEMPRAGE-32 channel combination and were significantly lower than the values for the MPRAGE-20 channel [4.18% (1.83%, 7.94%)], MP2RAGE-32 channel [4.30% (1.92%, 8.28%)], and MP2RAGE-20 channel [4.32% (1.99%, 8.40%)] combinations. The MPRAGE-32 channel combination had significantly lower TRV values than the other combinations, and the MP2RAGE-32 channel combination had significantly higher TRV values than the other combinations in the left temporal middle gyrus and right temporal middle gyrus. The TRV for the MP2RAGE-32 channel combination was significantly lower than that for other combinations, and the TRV for the MPRAGE-20 channel combination was significantly higher in the anterior left cingulum than that for other combinations. The MEMPRAGE-32 channel, MEMPRAGE-32 channel, and MP2RAGE-32 channel combinations had the lowest numerical TRV values in 25.9%, 35.3% and 40.0% of all brain regions, cortical structures and subcortical structures, respectively, which had comparable TRV values; and no other combinations yielded optimal TRV values at a higher rate.
[image:6.595.44.549.97.224.2]The TRV values for thickness differed significantly among the different combinations. All combinations were significantly different from each other for total cortical structures; the TRV values in ascending order were: MEMPRAGE-32 channel [1.65% (0.73%, 3.02%)], MPRAGE-32 channel [1.73% (0.82%, 3.33%)], MEMPRAGE-20 channel [1.83% (0.84%, 3.40%)], MP2RAGE-32 channel [2.03% (0.93%, 3.84%)], MPRAGE-20 channel [2.08% (0.92%, 3.83%)], and MP2RAGE-20 channel [2.30% (1.02%, 4.28%)]. Regarding single cortical structures, the TRV values for the MEMPRAGE-32 channel combination were significantly lower than those of the other combinations, and the TRV values for the MP2RAGE-20 channel combination were significantly higher than those in the right front middle gyrus, left temporal inferior gyrus, left parietal inferior supramarginal gyrus, and right parietal inferior angular gyrus. The MPRAGE-32 channel combination had TRV values that were significantly lower than those of the other combinations, and the MP2RAGE-20 channel combination had TRV values that were significantly higher than the other combinations in the left front inferior triangular gyrus and the left parietal inferior angular gyrus. The TRV values for the MPRAGE-32 channel combination and the MEMPRAGE-32 channel combination were significantly lower than the values for the other combinations in the left temporal middle gyrus and right occipital middle gyrus; the TRV value for the MP2RAGE-32 channel combination was the highest in the left temporal middle gyrus; the TRV value for the MP2RAGE-20 channel combination was the
Table 3 TRV values of the six combinations for whole brain and subcortical structures with FreeSurfer
Brain structures
MPRAGE_20CH TRV (%), median
(Q1, Q3)
MPRAGE_32CH TRV (%), median
(Q1, Q3)
MEMPRAGE_20CH TRV (%), median
(Q1, Q3)
MEMPRAGE_32CH TRV (%), median
(Q1, Q3)
MP2RAGE_20CH TRV (%), median
(Q1, Q3)
MP2RAGE_32CH TRV (%), median
(Q1, Q3)
P value
Total brain structures
3.24 (1.37, 6.76) 3.01 (1.32, 6.20) 3.06 (1.31, 6.40) 2.83* (1.18, 5.96) 3.38** (1.48, 7.02) 3.30 (1.41, 6.91) <0.001
Total subcortical structures
2.66 (0.97, 5.60) 2.48 (0.91, 6.02) 2.45 (0.94, 5.51) 2.31 (0.92, 6.21) 2.44 (0.99, 5.82) 2.29 (1.01, 5.50) 0.514
CSF 4.36 (2.23, 6.57) 2.52 (6.44, 10.12) 4.95 (1.71, 7.81) 3.56 (2.45, 6.24) 2.53 (1.30, 8.22) 4.23 (2.63, 9.17) 0.686
T
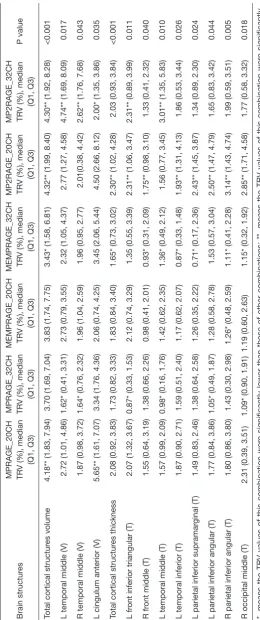
able 4
TR
V values of the six combinations for cortical structure volume values with FreeSurfer
Brain structur
es
MPRAGE_20CH TR V (%), median (Q1, Q3) MPRAGE_32CH TR
V (%), median (Q1, Q3) MEMPRAGE_20CH TR
V (%), median (Q1, Q3) MEMPRAGE_32CH TR
V (%), median (Q1, Q3) MP2RAGE_20CH TR
V (%), median (Q1, Q3) MP2RAGE_32CH TR
V (%), median (Q1, Q3)
P value
Total cortical structur
es volume
4.18** (1.83, 7.94)
3.70 (1.69, 7.04)
3.83 (1.74, 7.75)
3.43* (1.58, 6.81)
4.32** (1.99, 8.40)
4.30** (1.92, 8.28)
<0.001
L temporal middle (V)
2.72 (1.01, 4.86)
1.62* (0.41, 3.31)
2.73 (0.79, 3.55)
2.32 (1.05, 4.37)
2.77 (1.27, 4.58)
4.74** (1.69, 8.09)
0.017
R temporal middle (V)
1.87 (0.98, 3.72)
1.64* (0.76, 2.32)
1.96 (1.04, 2.59)
1.96 (0.95, 2.77)
2.01(0.38, 4.42)
2.62** (1.76, 7.68)
0.043
L cingulum anterior (V)
5.65** (1.61, 7.07)
3.34 (1.76, 4.36)
2.06 (0.74, 4.25)
3.45 (2.06, 5.44)
4.50 (2.66, 8.12)
2.00* (1.35, 3.86)
0.035
Total cortical structur
es thickness
2.08 (0.92, 3.83)
1.73 (0.82, 3.33)
1.83 (0.84, 3.40)
1.65* (0.73, 3.02)
2.30** (1.02, 4.28)
2.03 (0.93, 3.84)
<0.001
L fr
ont inferior triangular (T)
2.07 (1.32, 3.67)
0.87* (0.33, 1.53)
2.12 (0.74, 3.29)
1.35 (0.55, 3.39)
2.31** (1.06, 3.47)
2.31** (0.89, 3.99)
0.011
R fr
ont middle (T)
1.55 (0.64, 3.19)
1.38 (0.66, 2.26)
0.98 (0.41, 2.01)
0.93* (0.31, 2.09)
1.75** (0.98, 3.10)
1.33 (0.41, 2.32)
0.040
L temporal middle (T)
1.57 (0.99, 2.09)
0.98* (0.16, 1.76)
1.42 (0.62, 2.35)
1.36* (0.49, 2.12)
1.56 (0.77, 3.45)
3.01** (1.35, 5.83)
0.010
L temporal inferior (T)
1.87 (0.90, 2.71)
1.59 (0.51, 2.40)
1.17 (0.62, 2.07)
0.87* (0.33, 1.48)
1.93** (1.31, 4.13)
1.86 (0.53, 3.44)
0.026
L parietal inferior supramar
ginal (T)
1.49 (0.83, 2.46)
1.38 (0.64, 2.58)
1.26 (0.35, 2.22)
0.71* (0.17, 2.36)
2.43** (1.45, 3.87)
1.34 (0.89, 2.30)
0.024
L parietal inferior angular (T)
1.77 (0.84, 3.86)
1.05* (0.49, 1.87)
1.28 (0.58, 2.78)
1.53 (0.57, 3.04)
2.50** (1.47, 4.79)
1.65 (0.83, 3.42)
0.044
R parietal inferior angular (T)
1.80 (0.86, 3.80)
1.43 (0.30, 2.98)
1.26* (0.48, 2.59)
1.11* (0.41, 2.28)
3.14** (1.43, 4.74)
1.99 (0.59, 3.51)
0.005
R occipital middle (T)
2.31 (0.39, 3.51)
1.09* (0.90, 1.91)
1.19 (0.60, 2.63)
1.15* (0.32, 1.92)
2.85** (1.71, 4.58)
1.77 (0.58, 3.32)
0.018
*,
means the TR
V values of this combination
wer
e significantly lower
than
those of other
combinations; **, means the TR
V values
of this combination wer
e significantly
higher than those of other combinations. TR
V, test-r
etest variability; MPRAGE, magnetization-pr
epar
ed rapid gradient echo; MEMPRAGE, multi-echo MPRAGE; MP2RAGE,
magnetization-pr
epar
ed 2 rapid acquisition gradient echo; CH, channel; Q1, first quartile; Q3, thir
d quartile; R, right; L, left; V
, volume; T
highest in the right occipital middle gyrus.
Discussion
The main goal of this research was to investigate which 3D T1-weighted sequences yielded the best scan and segmentation repeatability for brain structures. The TRV values for the MEMPRAGE-32 channel combination were the lowest for the total brain structures and total cortical structures. When using FreeSurfer segmentation, the TRV values for the MEMPRAGE-32 channel combination were significantly lower than those of all the other combinations. Although the TRV values for the MEMPRAGE-32 channel combination were not significantly lower than those of the other combinations for the total brain structures when using the MorphoBox, it was still the lowest one numerically. We also found that, regardless of the coil type, MEMPRAGE outperformed the other two sequences regarding brain volume repeatability, especially for cortical structures.
The TRV values in the present study were similar to those reported in previous studies which also indicated high reliability for the same sequences. Our results showing that the TRV values ranged from 0.00% to 9.89% using the MorphoBox prototype and 0.00% to 16.46% using the FreeSurfer are comparable to those of previous studies indicating high reliability for similar sequences. Seiger et al. (25) reported TRV values that were under 3% in 78% of scanned regions when using the MPRAGE sequence. Okubo et al. reported coefficients of variation (COV) values (2× COV = TRV) for deep GM that were 0.50% to 3.31% when using the MP2RAGE sequence and 0.62% to 4.12% when using the MPRAGE sequence (26). Our results may have been slightly higher than those reported in these two studies because we used a different analysis procedure. These studies used voxel-based morphometry (VBM) analysis for brain segmentation, while we used MorphoBox and FreeSurfer. However, the median TRV values in our study were 1.23% with MorphoBox and 3.14% with FreeSurfer, which were low and comparable with those in former studies.
The results of our TRV comparisons between different sequences were also consistent with previous studies. We found that the MEMPRAGE sequence usually performed more reliably than the other two sequences for total brain structures and cortical structures. Another study also showed that the MEMPRAGE sequence had numerically but not significantly higher repeatability for cortical thickness measures and cortical surface placement than the
MP2RAGE sequence (20). In addition, another study that solely compared the MPRAGE and MP2RAGE sequences at 7T found that MP2RAGE had a larger TRV than MPRAGE especially in the inferior temporal region (25). Although a study demonstrated that MPRAGE was more reliable than MEMPRAGE, the reliability of MEMPRAGE in that study was still generally high and was comparable with the reliability of MPRAGE (27). Furthermore, there were some regions in our study in which the MPRAGE sequence performed more reliably than MEMPRAGE. Differences between our results and the results of other studies may have occurred because we used a higher bandwidth for MEMPRAGE than the other studies, which could have resulted in enhanced repeatability.
Similar to other studies, our TRV results for subcortical structures were different from our results for total brain and cortical structures. Both the results from MorphoBox and FreeSurfer demonstrated that the TRV values for the MP2RAGE sequence, regardless of coil type, were the lowest of the three sequences for total subcortical structures numerically, but this difference was not significant. Similar results were also found for some single subcortical structure, such as the left deep WM when MorphoBox was used, and the left thalamus when FreeSurfer was used. MP2RAGE also performed more reliably than the other sequences for certain deep cortical structures, such as the insula and cingulum. These findings are similar to those of a previous study that found that MPR2RAGE had significantly better reliability than MPRAGE in the bilateral putamen and had comparable reliability with MPRAGE in other deep GM areas (26). The superior reliability of the MP2RAGE sequence for subcortical and deeper cortical structures may arise because this sequence is less influenced by B1 inhomogeneity, allowing it to more easily distinguish the subcortical WM and GM, which is challenging because subcortical GM has a lower T1 values than cortical GM (28).
This study has a few limitations. First, this study did not compare the absolute volume values of different brain regions between the sequence and coil combinations. This lack of information regarding absolute volumes may have detracted from the accuracy of the resulting measurements used in our studies because previous studies have reported that different sequences and coils lead to variable measurements of brain structure volume and surface region thickness, indicating that some sequences and/or coils may over- or under-estimate the aforementioned measurements (25,31). However, this study was more concerned with repeatability comparisons than accuracy. Second, we obtained repeated acquisitions within a single scan session, which means that factors affecting reliability, such as differences in head positioning, auto shimming, and operational error were not taken into account (4). Future studies should include rescanned acquisitions acquired across different sessions. However, previous studies have reported comparable reliability between images acquired in the same session and images acquired in different sessions (20).
Conclusions
In conclusion, our study showed that overall the MEMPRAGE sequence provides better scan and segmentation repeatability for brain structures, especially cortical structures, than MPRAGE or MP2RAGE sequences. However, the MP2RAGE sequence may perform better when targeting subcortical structures volumetry. Our results also suggest that the 32-channel coil may have better scan reliability than the 20-channel coil. These findings may serve as a reference for choosing more reliable sequence and coil combinations in future studies and, potentially, in clinical practice.
Acknowledgments
We are very grateful to Dr. Ang Li and Prof. Bing Liu of Brainnetome Center, Institute of Automation, Chinese Academy of Sciences, for helping us in the data extraction and analysis.
Funding: This work was supported by the National Public Welfare Basic Scientific Research Program of Chinese Academy of Medical Sciences (2018PT32003 and 2017PT32004).
Footnote
Conflict of Interest: The authors have no conflicts of interest to declare.
Ethical Statement: The authors are accountable for all aspects of the work in ensuring that questions related to the accuracy or integrity of any part of the work are appropriately investigated and resolved. The Institutional Review Board of our hospital approved this study (No. ZS-1137), and informed consent was obtained from all the participants.
References
1. Fellhauer I, Zöllner FG, Schröder J, et al. Comparison of automated brain segmentation using a brain phantom and patients with early Alzheimer’s dementia or mild cognitive impairment. Psychiatry Res 2015;233:299-305.
2. Boto J, Gkinis G, Roche A, et al. Evaluating anorexia-related brain atrophy using MP2RAGE-based morphometry. Eur Radiol 2017;27:5064-72.
3. Chen X, Qian T, Maréchal B, et al. Quantitative volume-based morphometry in focal cortical dysplasia: a pilot study for lesion localization at the individual level. Eur J Radiol 2018;105:240-5.
4. Jovicich J, Marizzoni M, Sala-Llonch R, et al. Brain morphometry reproducibility in multi-center 3T MRI studies: a comparison of cross-sectional and longitudinal segmentations. Neuroimage 2013;83:472-84.
5. Jovicich J, Czanner S, Greve D, et al. Reliability in multi-site structural MRI studies: effects of gradient non-linearity correction on phantom and human data. Neuroimage 2006;30:436-43.
6. Han X, Jovicich J, Salat D, et al. Reliability of MRI-derived measurements of human cerebral cortical
thickness: the effects of field strength, scanner upgrade and
manufacturer. Neuroimage 2006;32:180-94. 7. Mugler JP 3rd, Brookeman JR. Three-dimensional
magnetization-prepared rapid gradient-echo imaging (3D MP RAGE). Magn Reson Med 1990;15:152-7.
8. Haase A. Snapshot FLASH MRI. Applications to T1, T2, and chemical-shift imaging. Magn Reson Med 1990;13:77-89.
three-dimensional magnetization-prepared rapid
gradient-echo imaging using variable flip angles. Magn Reson Med
1992;28:165-85.
10. Marques JP, Kober T, Krueger G, et al. MP2RAGE,
a self bias-field corrected sequence for improved
segmentation and T1-mapping at high field. Neuroimage
2010;49:1271-81.
11. van der Kouwe AJW, Benner T, Salat DH, et al. Brain morphometry with multiecho MPRAGE. Neuroimage 2008;40:559-69.
12. Jutras JD, Wachowicz K, Gilbert G, et al. SNR efficiency
of combined bipolar gradient echoes: comparison of three-dimensional FLASH, MPRAGE, and multiparameter mapping with VFA-FLASH and MP2RAGE. Magn Reson Med 2017;77:2186-202.
13. Tanner M, Gambarota G, Kober T, et al. Fluid and white matter suppression with the MP2RAGE sequence. J Magn Reson Imaging 2012;35:1063-70.
14. Wiggins GC, Triantafyllou C, Potthast A, et al. 32-channel 3 Tesla receive-only phased-array head coil with soccer-ball element geometry. Magn Reson Med 2006;56:216-23. 15. Wiggins GC, Polimeni JR, Potthast A, et al. 96-Channel
receive-only head coil for 3 Tesla: design optimization and evaluation. Magn Reson Med 2009;62:754-62.
16. Franke P, Markl M, Heinzelmann S, et al. Evaluation of a 32-channel versus a 12-channel head coil for high-resolution post-contrast MRI in giant cell arteritis (GCA) at 3T. Eur J Radiol 2014;83:1875-80.
17. Schmitter D, Roche A, Maréchal B, et al. An evaluation of volume-based morphometry for prediction of mild cognitive impairment and Alzheimer’s disease. Neuroimage Clin 2014;7:7-17.
18. Chalah MA, Kauv P, Lefaucheur JP, et al. Theory of mind in multiple sclerosis: a neuropsychological and MRI study. Neurosci Lett 2017;658:108-13.
19. Dunet V, Deverdun J, Charroud C, et al. MRI volumetric morphometry in vascular parkinsonism. J Neurol 2017;264:1511-9.
20. Fujimoto K, Polimeni JR, van der Kouwe AJ, et al. Quantitative comparison of cortical surface reconstructions
from MP2RAGE and multi-echo MPRAGE data at 3 and 7 T. Neuroimage 2014;90:60-73.
21. Fischl B. FreeSurfer. Neuroimage 2012;62:774-81. 22. Dale AM, Fischl B, Sereno MI. Cortical surface-based
analysis. I. segmentation and surface reconstruction. Neuroimage 1999;9:179-94.
23. Fischl B, Sereno MI, Dale AM. Cortical surface-based
analysis. II: inflation, flattening, and a surface-based
coordinate system. Neuroimage 1999;9:195-207. 24. Yoder KK, Albrecht DS, Kareken DA, et al.
Test-retest variability of [¹¹C]raclopride-binding potential in nontreatment-seeking alcoholics. Synapse 2011;65:553-61. 25. Seiger R, Hahn A, Hummer A, et al. Voxel-based
morphometry at ultra-high fields. A comparison of 7T and
3T MRI data. Neuroimage 2015;113:207-16. 26. Okubo G, Okada T, Yamamoto A, et al. MP2RAGE
for deep gray matter measurement of the brain: a comparative study with MPRAGE. J Magn Reson Imaging 2016;43:55-62.
27. Wonderlick JS, Ziegler DA, Hosseini-Varnamkhasti P, et al. Reliability of MRI-derived cortical and subcortical morphometric measures: effects of pulse sequence, voxel geometry, and parallel imaging. Neuroimage 2009;44:1324-33.
28. Zhu DC, Penn RD. Full-brain T1 mapping through inversion recovery fast spin echo imaging with
time-efficient slice ordering. Magn Reson Med 2005;54:725-31.
29. Motosugi U, Hernando D, Wiens C, et al. High SNR Acquisitions improve the repeatability of liver fat
quantification using confounder-corrected chemical
shift-encoded MR imaging. Magn Reson Med Sci 2017;16:332-9.
30. Okada T, Sakamoto S, Nakamoto Y, et al. Reproducibility of magnetic resonance spectroscopy in correlation with signal-to-noise ratio. Psychiatry Res 2007;156:169-74. 31. Viviani R, Pracht ED, Brenner D, et al. Multimodal
MEMPRAGE, FLAIR, and [Formula: see text]
segmentation to resolve dura and vessels from cortical gray matter. Front Neurosci 2017;11:258.