DOI: © 201 As P Abst Effic mini NHI In th (diag rand hype make two mod fores valid tree, Addi and L Keyw Live and [1,2] and adde the a comm disea fatty of liv adeq posit patho canc indic with panc the h recen diagn resea of p accu algor is 75 75.4
: http://dx.doi.
15-19, IJARCS A
LIV
ssistant Profes Pondicherry E
tract: In recen cient predictiv ing technique RD (National his data 2060 gnosed patient dom forest wh erlipidaemia, e e a differentia groups (traini del was done u st algorithm u dation result s and it can ef itionally, to g Logistic Regr
words: Artific
er cancer is th is the third ]. The main re
a high occurr ed to chronic c another study
mon in type-ases like alco y liver disease ver cancer dev
Although quately, that tive associati ogenic contriv cer and diabete cated that type hout diabetes [ creas are expo high probabil nt years, usi nosis has rec arch activity i papers publis uracy. For ex rithm (k=22) t 5.5% [14]. Th % whereas
.org/10.26483/
Inter
All Rights Reserve
VER CAN
J. Kumara
ssor, Compute Engineering C
nt years, type ve modelling
for type II d l Health Insur
cases were fo ts without live hich aims at etc.)using this ate between pa
ing group and using training uses multiple shows that the ffectively pred
et better predi ression algorit
cial Neural Ne
I. INTRO
he sixth most leading cause eason for live rence of hepa cirrhosis and shows non-al -II diabetes p oholic fatty li es and cirrhos velopment [6–
h these risk f more papers ion between vances underl
es were expla e II diabetes a [10-12]. To d osed to high i lity of liver ing predictiv ceived a stro in this field in shed deal w xample, Karol to obtain the h he neural netw the Bayesian /ijarcs.v9i2.585 V rnational Jo A ed
NCER PR
CLA
a Kumarer Science and College, Puduc
II diabetes wi is required fo diabetes patien rance Researc ounded and as
er cancer). In analysing so s the risk facto
atients with li d testing grou dataset. The decision trees e random fore dict the impac iction accurac thm.
etwork (ANN)
ODUCTION
common can e of cancer r er cancer is al atitis b and he hepatocellular lcoholic fatty patients [5] an
iver diseases, sis may also i –8].
factor have be reporting cancer and ying the relati ained [9]. The at the risk of ca diabetes patien involvement o cancer may ve classificati
ong boost ow n recent time with the goal l Grudzinski highest accura work achieved n approach a
56
Volume 9, N ournal of Ad RES Available O
REDICTI
ASSIFICA
d Engineering cherry, Indiaith liver cance for medical re nts with liver h Database). ssigned them This proposa ome readily a or were identif iver cancer an up). The traini remaining 30 s to train the st algorithm c ct of these re cy in random f
), AdaBoost, L
ncer world-wi related to dea lcohol usage epatitis c, whi
r carcinoma [ liver diseases nd several liv , non- alcoho increase the ri
een investigat a negative a diabetes. T ionship betwe e us studies ha ancer with tho nts the liver a of insulin, it h
increase [13] ion in medic wing to earn
s. And major l of improvi used the KN acy of the mod d an accuracy achieved 79.5
No. 2, March dvanced Re SEARCH PA Online at ww
ION FOR
ATION A
,
er became a se esearchers and r cancer with
That selected to a case grou l a liver cance available indic fied, then chi-nd patients wit ing group con % of dataset i samples, and can greatly red eadily availabl
forest model t
LogisticRegre ide ath [3] ich [4]. s is ver olic isk ted and The een ave ose and has .In cal nest rity ing NN del of 5% ac ne ne to th m sin th pr be th co al he us gr th in it co ad Th cl co de h-April 2018 esearch in Co APER ww.ijarcs.inf
R TYPE-I
ALGORIT
M. Te Pondicherry erious disease d practitionersin 6 years of patients who up (diagnose er prediction f cator (age, liv -square test w thout liver can ntain of 70%
is assigned to integrates we duce the prob le indicators o than using the
ession, Random
ccuracy in ref eural network eural network o get the valu he model has b methods and th ngle classifier han the sing
redictors in th e measured by he cost of th
ontain a lot of coholic cirr epatitis, viral sing these ind reatly reduce t he system ma ndicators to ju
in the bud. omposed of dvantages of herefore, the p
assifier.
On th oncept is to de etect the proba
8 omputer Sc fo
I DIABET
THM
S. Aech Student, C y Engineering
e that threatens s. To develop f diagnosis. D were newly d patients with for type II dia
ver diseases, was conducted
ncer. The data of dataset (14 the test group eight of each blem of model
on the risk liv Artificial Neu
m forest algor
ference [15]. k (artificial neu k (FNN) mode
e of 84.24% been improvin he improved r. However, t le classifier he model are y certain med he patient's d f readily availa rhosis, non-a hepatitis, oth dicators to pr
the cost of dia ay choose th dge the impac Random fo
multiple de high accura present study
he basis of th evelop an app ability of liver
II. PROP ience
472 ISSN No
TES USIN
Agilan
Computer Scie g College, Pud
s the health an p a prediction Data has been
diagnosed wit liver cancer) abetes predicti
Alcoholic fa on each indep aset were rand 442 cases) wh p for model v tree to get the lling error of ver cancer for
ural Network
rithm.
Allah Verdi ural networks el), the precis [16]. Althoug ng, it is obviou algorithms ar the ensemble in many ca not directly v ical equipmen iagnosis. Bes able indicators alcoholic cir her types of c redict diabetes abetes liver ca hese external
ct on diabetes orest is an e ecision trees, cy and good uses random
he prediction plication to en r cancer in fut
POSED MOD
2
o. 0976‐5697
NG
nce Dept. ducherry, Indi
nd mind of hu n model using collectedfrom th type II diab
and control g ve model bas atty liver dise
pendent variab domly divided here the predi validation. Ran
e final results the single dec r diabetes pat
(ANN), AdaB
proposed a h s (ANN) and f
ion of this me gh the accura us that the res re the indispu
classifier is b ases. Also, visible and ne nt, which incr sides, the dat s (such as sex rrhosis, alco chronic hepat s patients tha ancer predicti readily avai s and try to pr
nsemble clas , which has d robustness forest as the
model, the nable physicia ture 6-year per
2.1. Data source
Data were taken from the NHIRD of Taiwan, The NHIRD encompasses all medical privileges data of almost 23.72 million people, including over 99% of the Taiwan population [18]. This study used the LHIRD (Longitudinal Health Insurance Database) 2010, which covers the health insurance data of 2 million people in 6 year time period [19].
This paper chose recently determined patients to have compose type II diabetes patients (from 2000 to 2003 who did not have a history of cancer (n = 65,871) [19]. A
while later, this model utilizes encoded singular recognizable proof information to perform information linkage with the disease registry database to distinguish whether the patients had been determined to have liver growth(International Classification of Diseases, (ICD-O-3 = C22.0 and C22.1))between 2001 and 2009.In fig.1, it is found 515 diabetes patients who established liver cancer within 6 years after diabetes diagnosis. Those studies [20-21] have reported that the ratio of the test group to the control group should not be more than 1:3 ratio; using other ratios it may lead to a biased comparison.
Fig.1 Research Flow
2.2 Random Forest model
The random forest algorithm, proposed by Dr.Breiman in 2001, has been to a great degree effective as a universally useful grouping and relapse technique. The approach, which joins separate randomized decision trees and aggregates their predictions by averaging which has shown excellent performance in settings where the quantity of factors is significantly bigger than the quantity of observations [22].. It is an algorithm based on statistical learning theory, which uses Bootstrap randomized re-sampling way to extract multiple versions of the sample sets from the original training datasets, then building a decision tree model for each sample set, the final combined all the results of the decision trees to predict the results of classification by the established voting mechanism. The detailed process is shown in Fig.2.
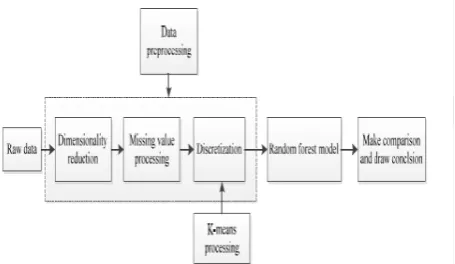
2.3 Data Pre-Processing
The data should be carefully collected, integrated and prepared for analysis. In this study, the model applied
the techniques of data pre-processing to improve the quality of the mining results and the efficiency of the mining process. The raw dataset is provided by NHIRD of Taiwan. Which has 2060 cases The raw data was randomly categorized into two groups (training group and test group); the training group consist of 1442 cases (70% of dataset). The prediction model was developed based on training dataset. The remaining 30%cases is assigned as test group. The 70/30 percentage rule was applied on the basis of some studies such as by Antonio Mucherino [23] and CogNova Technologies [24], and each tester consists of 10 features including age group, gender, alcoholic cirrhosis, other cirrhosis, alcoholic hepatitis, viral hepatitis, etc . In this datasets, it is easy to judge whether or not the tester has liver cancer using sequential mining optimization algorithm, they have indicate that 70% of data is sufficient for developing random forest model and remaining data can be used for validation, if the dataset is small 90% is used as training set and remaining 10 fold validation is used.
[image:2.595.340.535.424.601.2]This model is also tested the SVM,ANN(artificial neural network)and Logistic regression on our data in this study and employed WEKA to devise this models. The decision tree included sex, alcoholic cirrhosis, cirrhosis, viral hepatitis, chronic hepatitis, alcoholic fatty liver disease, hyperlipidaemia, and age as parameters, and the decision tree algorithm was used to construct random forest model. By contrast, to devise the ANN model, it is used in the sequential minimal optimization algorithm, and included as factors sex, alcoholic cirrhosis, cirrhosis, viral hepatitis, chronic hepatitis, alcoholic fatty liver disease, and other types of fatty liver disease,
Fig. 2. Flow chart of the random forest algorithm
J. Kumaran Kumar et al, International Journal of Advanced Research in Computer Science, 9 (2), March-April 2018,472-477
© 2015-19, IJARCS All Rights Reserved 474
Table I: Statistics data –relationship between factors and liver cancer.
Factors P-value
Gender 0.869
Age group 0.999
Alcoholic liver cirrhosis 0.018* Liver cirrhosis <0.001* Alcoholic hepatitis 0.134 Viral hepatitis <0.001* Chronic hepatitis <0.001* Alcoholic fatty liver 0.125
Other fatty liver 0.248
Hyperlipidaemia <0.001*
P-value < 0.05, it means the factor have significant
relationship with liver cancer.
In order to improve the accuracy of the model, the continuous features are often needed to be discretized[26]. Discretization involves two tasks: First, to determine the number of classification that it need; Second, to determine how to map continuous features values to these classification values. For the first sub-tasks, it can handle like this: after the continuous features values are sorted, divide them into n intervals by specifying the n-1 points. As for the second subtasks, it will map all the values in an interval to the corresponding classification value. Therefore, the discretization is to choose the number of split points and determine the point location problem. In order to facilitate the processing of the data, it will divide each feature into three parts and using low, medium and high represent these feature values, respectively. The next step is to determine the split point; there are three kinds of methods to determine the split point, namely: width discretization, frequency discretization and k-means discretization. After the experimentation, the performance of k-means discretization is the best [27].According to the centre point of each feature obtained by k-means discretization, the features of discretization are shown in TABLE II
Table II. Discretized features
Name Low Medium High
Age 0 0.55~0.90 ≥ 1
Liver
cirrhosis 0 0.001~0.015* ≥1
Alcoholic hepatitis
0 0.01~0.134 ≥1
Alcoholic
fatty liver 0 0.001~0.134 ≥1
III. EXPERIMENT DESIGN
After the data pre-processing, the next goal is to dig out the relationships between the various features and extract some useful patterns. Now, the main idea is to develop a risk of liver cancer for type II diabetes model to predict whether a person will develop liver cancer. The construction steps of the random forest mainly include generating a training set, choosing the splitting point, repeating construct the
classification and regression tree and the voting. Detailed procedure is as follows:
Step1: using Bootstrap re-sampling techniques to generate k (In this paper, the k is 10) samples. Theoretically k samples cover 2/3 of the original datasets, and the rest of the data is called Out-Of-Bag (OOB), OOB can be used as test data [28].
Step2: using the k samples to generate k decision trees. At each node of each tree, that are randomly selected m features (m<M) in the M features, it is suggested starting with m = √ and then decreasing or increasing m until the minimum error for the OOB data set is obtained. Finally choose the best split according to the Gini criterion.
Gini criterion and prediction class labels are shown in the Eq. (1) and Eq. (2).
Gini 1
- Eq. (1) Where represents the probability of the i-th class instance; n is the number of classes; represents the i-th feature.
,
- Eq. (2)
Where represents prediction class labels; arg maxc
represents a parameter to find the maximum score c; k represents the number of decision trees in a random forest; I(*) represents indicator function; , , represents the classification results of the decision tree for the c class; n hi
represents the number of leaf nodes in the decision tree .
Step3: according to the previous two steps to predict the test
samples, and combined with the test results of each tree and determines the final result in accordance with majority rule voting mechanism.
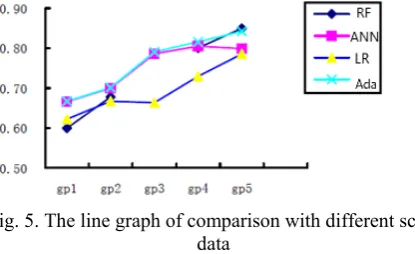
[image:3.595.318.546.604.736.2]In order to validate the effectiveness of the proposed methods, it utilizes another three algorithm, namely ANN model, Logistic regression algorithm and AdaBoost algorithm. Additionally, in order to further demonstrate the effectiveness of the method used in this study. This model is designed in a different set of contrast experiments. First, the data set was divided into four subsets (20%, 40%, 60%, and 80% )of the total data set, respectively), and each model was compared in each subset. The overall framework of model building is shown in Fig.3
Acco root Alco hepa these whet as fo 1) If diabe 2) If then If th prev Alco diabe hepa show liver canc spec metr prod abili accu sepa Spec Whe corre the when occu when The perfo cross mod rand 10-fo carri algor 78.5 of ac IV. R
ording to the a node of ea oholic liver atitis, A0lcoho
e are all im ther they are ollows:
f Liver cirrho etic.
f Alcoholic fa diabetic.
he first rule i ious study , oholic fatty l
etes from tho atitis. Conside wn a similar
r -to- Chroni cer for Type I In medi ificity are t rics. Accuracy duce accurate
ty of the mod urately. Specif arate the targ cificity are me
ere the True P ect classificat outcome is i n it is actual urs when the
n it is actually k-fold cross ormance [30]. s validation m del. According dom forest mo fold cross vali ied out AN rithms to obta 7%, 79.89% ccuracy for 4 m
RESULTS AN EV
above experim ach tree in
cirrhosis, olic fatty live mportant exter suffering from
osis ≥0 and A
atty liver ≥ 1
is considered, which show iver discrim ose without, ering the sec study which ic hepatitis c
I diabetes. cal diagnosis the common
y determines disease diagn del to identify ficity measure get class. The easured as foll
Positives (TP) tions. A False incorrectly pr
ly no (negati outcome is y yes.
validation is . Therefore, in method to ev g to the Eq. odel is 85.00%
dation method NN, Logistic ain accuracy and 84.19%. models’ NALYSIS AN VALUATION
ment, it is eas a random fo Liver cirrho er and Age. rnal indicator m liver cancer
Alcoholic fatty
1 and Chronic
, the rule is wed that Liv minate better as compared ond rule, rec
showed that can be used t
s accuracy, measures o ability of t osis. Sensitivi
the occurrenc es the ability e Accuracy, lows [29].
and True Neg e Positive (FP redicted as ye ive). A False
incorrectly p
a best measu n our study, it valuate the re
(3), the accur %, which is ca d. In addition
regression of the model
Fig.4 present
ND MODEL N
sy to see that t orest, includi osis, Alcoho It indicates th rs to determi
r . The rules a
y liver ≥1, th
c hepatitis ≤
supported by ver cirrhosis the cases w with Alcoho cent study ha Alcoholic fa to identify liv
sensitivity a of performan the classifier ity measures t ce of target cla
of the model Sensitivity a
-Eq. (
-Eq. (
-Eq. (
gatives (TN) a P) occurs wh es (or positiv Negative (F predicted as
ure for classif tuses the 10-fo
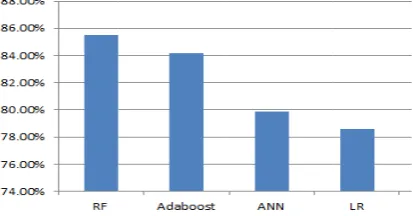
eliability of t racy rate of t alculated by t n, this paper al and AdaBoo l are as follow ts the bar gra
the ing olic hat ine are hen 1, y a or with olic ave atty ver and nce to the ass to and (3) (4) (5) are hen ve) FN) no fier old the the the lso ost ws: aph A se se re le fo is AN se ha di ac re ex A be 20 W gr In al gr In da im m of ra fo am Fig ccording to ensitivity reach ensitivity of espectively. W
vel. By observ ound that the d
a direction f NN, Logistic ensitivity of ra as a certain g iabetes wheth ccount the am elatively sma
[image:4.595.317.524.57.165.2]xperiment to s ccording to th eing set up fo 0%, 40%, 60 With the above roup were sho
Table III Algorithms Random Forest ANN Logistic regression AdaBoost
n order to b gorithm in e raph. It is show n Fig. 6, it can
ata, the accura mproved. Add model is also c f increased da andom forest m or type II dia
mount of data
. 4. Accuracy
the Eq. (4), hed a compar
91.17%, 9 While the spe ving the data data imbalance for the next re regression an andom forest guiding signifi her having liv mount of dat all, it is ma
strengthen the he characterist our subsets of 0%, 80% of t e methods, the own in TABLE
I. Comparison s Group 1 60.00% 66.65% 62.25% 66.70% etter observe ach experime wn in Fig. 5. n be conclude
acy of the ran ditionally, the constantly imp ata in the sim model can eff abetes patien
for different m
Eq. (5), it ative high lev 92.11%, 99. ecificity achi and searching e leads to this esearch. How nd AdaBoost, model are m ficance for the
ver cancer or ta used in th ade 4 groups e persuasivene tics of the dat f different siz the total data e accuracy of E III..
n with differen
Group 2 Gr 3 67.78% 80. 69.93% 78. 66.73% 66. 70.10% 79.
e the effect ental group,
d that with th ndom forest m
accuracy of proving while milar proportio fectively predi nts in the ca
models
is found tha vel, they achie 05% and 1 eved a quite g the literature s problem. An wever, compar , the accuracy more satisfacto
e early warnin r not. Taking he experimen s of compar ess of experim ta set, the mo zes, accountin a set, respecti each experim
nt scale data
roup Group 4 .07% 84.13% .64% 80.50% .36% 72.94% .06% 81.61%
of random f and make its
he expansion o model is const
the random f e the same am on of cases. S
ict the liver c se of a suffi
at the ved a 100% e low e, it is
[image:4.595.322.551.451.570.2]J. Kumaran Kumar et al, International Journal of Advanced Research in Computer Science, 9 (2), March-April 2018,472-477
[image:5.595.51.259.60.187.2]© 2015-19, IJARCS All Rights Reserved 476
Fig. 5. The line graph of comparison with different scale data
.
V. CONCLUSION
The data mining technique has played a very important and decisive role in the medical industry. In this paper, it is to obtain some simple decision rules by establishing the random forest model, and which can make a simple prediction of whether having liver cancer or not for type II diabetes patients by these simple and readily available indicators. Additionally, these indicators are relatively easy to obtain and measured by physician, so they can greatly reduce the cost of diagnosis. By using these indicators to predict liver cancer for diabetes patients will have a certain practical significance.
In this paper, just use some readily available indicators to predict the risk of liver cancer for type II diabetes and there is no further study the impact of other indicators of illness, also not taken into account the impact of the tester itself suffering from other diseases on the prediction of diabetes. Expand other indicators to predict the risk of disease and update the perspective of data mining are the future direction of the prediction of the risk of liver cancer for type II diabetes patients.
VI. ACKNOWEDGEMENT
The authors gratefully acknowledge the authorities and Pondicherry Engineering College for the facilities offered to carry out this work.
VII. REFERENCE
[1] Jemal, Ahmedin, et al. "Global cancer statistics." CA: a cancer journal for clinicians 61.2 (2011):pp. 69-90.
[2] Singh, Gopal K factors b., Mohammad Siahpush, and
Sean F. Altekruse. "Time trends in liver cancer mortality, incidence, and risk y unemployment level and race/ethnicity, United States, 1969–2011." Journal of community health 38, no. 5 (2013): 926-940.
[3] Alcohol Use and Cancer, 2014, Available
from:http://www.cancer.org/cancer/cancercauses/dietandp hysicalactivity/alcohol-use-and-cancer.
[4] Momin, Behnoosh, and Lisa Richardson. "An analysis of content in comprehensive cancer control plans that address chronic hepatitis B and C virus infections as major risk factors for liver cancer." Journal of community health 37, no. 4 (2012): 912-916.
[5] Schulz, P. O., Ferreira, F. G., Nascimento, M. D. F. A., Vieira, A., Ribeiro, M. A., David, A. I., &Szutan "Association of non-alcoholic fatty liver disease and liver
cancer." World Journal of Gastroenterology: WJG 21, no. 3 (2015):p. 913.
[6] Vongsuvanh, Roslyn, David van der Poorten, and Jacob
George. "Non-alcoholic fatty liver disease-related hepatocellular carcinoma: a sleeping tiger in the Asia Pacific." Hepatology international 7, no. 2 (2013): 823-832.
[7] Hashimoto, Etsuko, and KatsutoshiTokushige.
"Hepatocellular carcinoma in non alcoholic steatohepatitis: Growing evidence of an epidemic?." Hepatology Research 42, no. 1 (2012): pp. 1-14.
[8] Baffy, György, Elizabeth M. Brunt, and Stephen H.
Caldwell. "Hepatocellular carcinoma in non-alcoholic fatty liver disease: an emerging menace." Journal of hepatology 56, no. 6 (2012):pp. 1384-1391.
[9] P.F.F. Vigneri, L. Sciacca, G. Pandini, R. Vigneri,
Diabetes andcancer, Endocr. Relat. Cancer 16 (4) (2009) pp. 1103–1123
[10] Lowenfels, Albert B., and Patrick Maisonneuve. "Risk factors for pancreatic cancer." Journal of cellular biochemistry 95, no. 4 (2005):pp. 649-656.
[11] Chang, Chia Hsuin, Jou Wei Lin, Li Chiu Wu,
Mei Shu Lai, Lee Ming Chuang, and K. Arnold Chan. "Association of thiazolidinediones with liver cancer and colorectal cancer in type 2 diabetes mellitus." Hepatology 55, no. 5 (2012):pp. 1462-1472.. [12] Bosetti, Cristina, ValentinaRosato, DaniloBuniato,
AntonellaZambon, Carlo La Vecchia, and Giovanni Corrao. "Cancer risk for patients using thiazolidinediones for type 2 diabetes: a meta-analysis." The oncologist 18, no. 2 (2013): pp.148-156.
[13] Printz, Carrie. "Diabetes associated with increased risk of liver cancer." Cancer 120, no. 9 (2014): 1288-1288. [14] Grudziński, Karol. "Towards Heterogeneous Similarity
Function Learning for the k-Nearest Neighbors Classification." In International Conference on Artificial Intelligence and Soft Computing, pp. 578-587. Springer, Berlin, Heidelberg, 2008.
[15] Bioch, Jan C., Onno Van Der Meer, and Rob Potharst.
"Classification using Bayesian neural nets." In Neural Networks, 1996., IEEE International Conference on, vol. 3, pp. 1488-1493. IEEE, 1996.
[16] Kahramanli, Humar, and NovruzAllahverdi. "Design of a hybrid system for the diabetes and heart diseases." Expert systems with applications 35, no. 1-2 (2008):pp 82-89.
[17] Fawagreh, Khaled, M. M. Gaber, and EyadElyan.
"Random forests: from early developments to recent advancements." Systems Science & Control Engineering: An Open Access Journal 2, no. 1 (2014): pp. 602-609. [18] Cheng, C. L., Kao, Y. H. Y., Lin, S. J., Lee, C. H., & Lai,
M. L. "Validation of the National Health Insurance Research Database with ischemic stroke cases in Taiwan." Pharmacoepidemiology and drug safety 20, no. 3 (2011):pp. 236-242.
[19] Rau, H. H., Hsu, C. Y., Lin, Y. A., Atique, S., Fuad, A., Wei, L. M., & Hsu, M. H. (2016) "Development of a web-based liver cancer prediction model for type II diabetes patients by using an artificial neural network." computer methods and programs in biomedicine125 (2016):pp. 58-65
[20] N. Chawla, Data Mining for Imbalanced Datasets:
AnOverview Data Mining and Knowledge Discovery Handbook,2010, pp. 875–886.
datasets." International journal of environmental research and public health 11, no. 9 (2014):pp. 9776-9789.
[22] L.Breiman, "Random Forests," Machine Learning, vol.45, 2001: pp. 5-32.
[23] A.P.P. Mucherino, P.M. Pardalos, Data mining in
agriculture. Vol. 34. Springer Science, 2009.
[24] Karaboga, Dervis, and CelalOzturk. "Neural networks training by artificial bee colony algorithm on pattern
classification." Neural Network World 19, no. 3
(2009):pp. 279..
[25] M. G. Ahamad, A. Aljumah, and M. K. Siddiqui,
"Application of data mining: Diabetes health care in young and old patients." Journal of King Saud University-Computer and Information Sciences 25, no. 2 (2013):pp. 127-136
[26] J. C. Han, J. C. Rodriguze, and M. Beheshti, "Diabetes data analysis and prediction model discovery using rapidminer." In Future Generation Communication and Networking, 2008. FGCN'08. Second International Conference on, vol. 3, pp. 96-99. IEEE, 2008.
[27] P.N. Tan, M. Steinbach and V. Kumar, Introduction to
Data Mining, Pearson Addison Wesley, 2006
[28] Seyedhosseini, Mojtaba, and TolgaTasdizen. "Disjunctive normal random forests." Pattern Recognition 48, no. 3 (2015):pp. 976-983.
[29] Z. H. Zhou, Machine Learning, 1st ed., Tsinghua
University Press, 2016,pp.28-36.
[30] N. Esfandiari, M. R. Babavalian and V. K. Tabar,