Volume 2, No. 4, July-August 2011
International Journal of Advanced Research in Computer Science
RESEARCH PAPER
Available Online at www.ijarcs.info
Classification Technique – Construction of Decision Tree with Continuous Variable
K. Rakesh*, N.Vikram
Asst Professor
Jaya Prakesh Narayan College of Engineering.
A.P.,India
Abstract - Decision tree supervised learning is one of the most widely used and practical inductive methods, which represents the results in a tree scheme. Various decision tree algorithms have already been proposed, such as ID3, Assistant and C4.5. These algorithms suffer from some drawbacks. In traditional classification tree algorithms, the label is assumed to be a categorical (class) variable. When the label is a continuous variable in the data, two possible approaches based on existing decision tree algorithms can be used to handle the situations. The first uses a data discretization method in the preprocessing stage to convert the continuous label into a class label defined by a finite set of non overlapping intervals and then applies a decision tree algorithm. The second simply applies a regression tree algorithm, using the continuous label directly. We propose an algorithm that dynamically discretizes the continuous label at each node during the tree induction process. Extensive analysis shows that the proposed method outperforms the preprocessing approach, the regression tree approach, which presents the best approach comparing to existing algorithms
Keywords – Data mining, Classification, Decision tree, ID3, CART.
I. INTRODUCTION
Data mining involves the use of sophisticated data analysis tools to discover previously unknown, valid patterns and relationships in large data set. These tools can include statistical models, mathematical algorithm and machine learning methods. Consequently, data mining consists of more than collection and managing data, it also includes analysis and prediction. Classification technique is capable of processing a wider variety of data than regression and is growing in popularity.
There are several applications for Machine Learning (ML), the most significant of which is data mining. People are often prone to making mistakes during analyses or, possibly, when trying to establish relationships between multiple features. This makes it difficult for them to find solutions to certain problems. Machine learning can often be successfully applied to these problems, improving the efficiency of systems and the designs of machines. The ability to predict/classify a student’s performance is very important in web-based educational environments. A very promising arena to attain this objective is the use of Data Mining (DM). In fact, one of the most useful DM tasks in e-learning is classification. There are different educational objectives for using classification, such as: to discover potential student groups with similar characteristics and reactions to a particular pedagogical strategy [2], to detect students’ misuse or game-playing [1], to group students who are hint-driven or failure-driven and find common misconceptions that students possess [10], to identify learners with low motivation and find remedial actions to lower drop-out rates [3], to predict/classify students when using intelligent tutoring systems [6], etc. And there are different types of classification methods and artificial intelligent algorithms that have been applied to predict student outcome, marks or scores. Some examples are: predicting students’ grades (to classify in five classes: A, B,
C, D and E or F) from test scores using neural networks [5]; predicting student academic success (classes that are
successful or not) using discriminant function analysis classifying students using genetic algorithms to predict their final grade [8], predicting a student’s academic success (to classify as low, medium and high risk classes) using different data mining methods, predicting a student’s marks (pass and fail classes) using regression techniques in Hellenic Open University data [7] or using neural network models from Moodle logs [4].
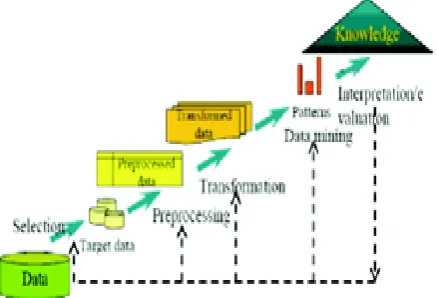
Figure 1 is the transition from raw data to valuable knowledge patterns
II. SECTION
Machine learning is a scientific discipline that is concerned with the design and development of algorithms that allow computers to learn based on data, such as from sensor data or databases. A major focus of machine learning research is to automatically learn to recognize complex patterns and make intelligent decisions based on data. Hence, machine learning is closely related to fields such as statistics, probability theory, data mining, pattern recognition, artificial intelligence, adaptive control, and theoretical computer science. Data mining interfaces support the following supervised functions:
A. Classification:
A classification task begins with build data (also known as training data) for which the target values (or class assignments) are known. Different classification algorithms use different techniques for finding relations between the predictor attributes' values and the target attribute's values in the build data.
Decision tree rules provide model transparency so that a business user, marketing analyst, or business analyst can understand the basis of the model's predictions, and therefore, be comfortable acting on them and explaining them to others Decision Tree does not support nested tables. Decision Tree Models can be converted to XML.
NB makes predictions using Bayes' Theorem, which derives the probability of a prediction from the underlying evidence. Bayes' Theorem states that the probability of event A occurring given that event B has occurred (P(A|B)) is proportional to the probability of event B occurring given that event A has occurred multiplied by the probability of event A occurring ((P(B|A)P(A)).
Adaptive Bayes Network (ABN) is an Oracle proprietary algorithm that provides a fast, scalable, non-parametric means of extracting predictive information from data with respect to a target attribute. (Non-parametric statistical techniques avoid assuming that the population is characterized by a family of simple distributional models, such as standard linear regression, where different members of the family are differentiated by a small set of parameters.)
B. Support Vector Machine:
Support vector machine (SVM) is a state-of-the-art classification and regression algorithm. SVM is an algorithm with strong regularization properties, that is, the optimization procedure maximizes predictive accuracy while automatically avoiding over-fitting of the training data. Neural networks and radial basis functions, both popular data mining techniques, have the same functional form as SVM models; however, neither of these algorithms has the well-founded theoretical approach to regularization that forms the basis of SVM.
C. Association Rule:
Association rule learning is a popular and well researched method for discovering interesting relations between variables in large databases . Piatetsky-Shapiro[11] describes analyzing and presenting strong rules discovered in databases using different measures of interestingness. Based on the concept of strong rules, Agrawa[12]l et al. introduced association rules for discovering regularities between products in large scale transaction data recorded by
point-of-scale (POS) systems in supermarkets. For example, the rule{ onions, potatoes}=>{beef} found in the sales data of a supermarket would indicate that if a customer buys onions and potatoes together, he or she is likely to also buy beef. Association model is often used for market basket analysis, which attempts to discover relationships or correlations in a set of items. Market basket analysis is widely used in data analysis for direct marketing, catalog design, and other business decision-making processes. Traditionally, association models are used to discover business trends by analyzing customer transactions.
However, they can also be used effectively to predict Web page accesses for personalization. For example, assume that after mining the Web access log, Company X discovered an association rule "A and B implies C," with 80% confidence, where A, B, and C are Web page accesses. If a user has visited pages A and B, there is an 80% chance that he/she will visit page C in the same session. Page C may or may not have a direct link from A or B. This information can be used to create a dynamic link to page C from pages A or B so that the user can "click-through" to page C directly. This kind of information is particularly valuable for a Web server supporting an e-commerce site to link the different product pages dynamically, based on the customer interaction.
D. Clustering:
Cluster is a number of similar objects grouped together. It can also be defined as the organization of dataset into homogeneous and/or well separated groups with respect to distance or equivalently similarity measure. Cluster is an aggregation of points in test space such that the distance between any two points in cluster is less than the distance between any two points in the cluster and any point not in it. There are two types of attributes associated with clustering, numerical and categorical attributes. Numerical attributes are associated with ordered values such as height of a person and speed of a train. Categorical attributes are those with unordered values such as kind of a drink and brand of car. Clustering is available in flavors of
a. Hierarchical
b. Partition (non Hierarchical)
In hierarchical clustering the data are not partitioned into a particular cluster in a single step. Instead, a series of partitions takes place, which may run from a single cluster containing all objects to n clusters each containing a single object. Hierarchical Clustering is subdivided into agglomerativemethods, which proceed by series of fusions of the n objects into groups, and divisive methods, which separate n objects successively into finer groupings.
III. SECTION
Supervised (Classification): Decision Tree, bayesian classification, Bayesian belief networks, neural networks etc. are used in data mining based applications.
A. Classification Techniques:
In Classification, training examples are used to learn a model that can classify the data samples into known classes. i. The Classification process involves following steps: ii. Create training data set.
iv. Identify useful attributes for classification (relevance analysis).
v. Learn a model using training examples in training set. vi. Use the model to classify the unknown data samples.
a. Decision Tree:
Decision tree support tool that uses tree-like graph or models of decisions and their consequences [13][14], including event outcomes, resource costs, and utility. Commonly used in operations research, in decision analysis help to identify a strategy most likely to reach a goal. In data mining and machine learning, decision tree is a predictive model that is mapping from observations about an item to conclusions about its target value. The machine learning technique for inducing a decision tree from data is called decision tree learning.
Figure: 2 The example of fig(2) is taken from[15]
In above fig(2) tree is classified into five leaf nodes. In a decision tree, each leaf node represents a rule. The following rules are as follows in figure(2) Rule 1: If it is sunny and the humidity is high then do not play. Rule2 : If it is sunny and the humidity is normal then play. Rule3 : If it is overcast, then play. Rule4 : If it is rainy and wind is strong then do not play. Rule5 : If it is rainy and wind is weak then play.
b. ID3 Decision Tree:
Iterative Dichotomiser is an algorithm to generate a decision tree invented by Ross Quinlan, based on Occam’s
razor. It prefers smaller decision trees(simpler theories) over larger ones. However it does not always produce smallest
tree, and therefore heuristic. The decision tree is used by the concept of Information Entropy
The ID3 Algorithm is :
i. Take all unused attributes and count their entropy concerning test samples
ii. Choose attribute for which entropy is maximum iii. Make node containing that attribute
ID3 (Examples, Target _ Attribute, Attributes) Create a root node for the tree
If all examples are positive, Return the single-node tree Root, with label = +.
If all examples are negative, Return the single-node tree Root, with label = -.
If number of predicting attributes is empty, then Return the single node tree Root, with
label = most common value of the target attribute in the examples.
Otherwise Begin
A = The Attribute that best classifies examples. Decision Tree attribute for Root = A.
For each possible value, vi, of A,
Add a new tree branch below Root, corresponding to the test A = vi.
Let Examples(vi), be the subset of examples that
have the value vi for A
If Examples(vi) is empty common target value in
the examples
Else below this new branch add the sub tree ID3 (Examples(vi), Target_ Attribute, Attributes – {A}
End Return Root
c. C.CART:
CART (Classification and regression trees) was introduced by Breiman, (1984). It builds both classifications and regressions trees. The classification tree construction by CART is based on binary splitting of the attributes. It is also based on Hunt’s model of decision tree construction and can be implemented serially (Breiman, 1984). It uses gini index splitting measure in selecting the splitting attribute. Pruning is done in CART by using a portion of the training data set (Podgorelec et al, 2002). CART uses both numeric and categorical attributes for building the decision tree and has in-built features that deal with missing attributes (Lewis, 200). CART is unique from other Hunt’s based algorithm as it is also use for regression analysis with the help of the regression trees. The regression analysis feature is used in forecasting a dependent variable (result) given a set of predictor variables over a given period of time (Breiman, 1984). It uses many single variable splitting criteria like gini index, symgini etc and one multi-variable (linear combinations) in determining the best split point and data is sorted at every node to determine the best splitting point.
The linear combination splitting criteria is used during regression analysis. SALFORD SYSTEMS implemented a version of CART called CART® using the original code of Breiman, (1984). CART® has enhanced features and capabilities that address the short-comings of CART giving rise to a modern decision tree classifier with high classification and prediction accuracy.
B. Measures of Node Impurity for CART:
To measure the node impurity we have three types 1)Gini Index 2)Entropy 3)Misclassfication
Gini index for a given node t :
P(j/t) is the relative frequency of class j at node t, here the maximum (1-1/nc)when recors are eually distributed among all classes, implying least interesting information and minimum (0,0) when all records belong to one class, implying most interesting information.
Entropy: It is measured using information Gain
Misclassification: Classification error at a node t:
Measures misclassification error made by a node, maximum (1-1/nc) when records are equally distributed among all classes, implying least interesting information and the minimum (0.0) when all records belong to one class, implying most interesting information
IV. PROBLEM DEFINITION
The available traditional decision (classification) tree induction algorithms were developed considering label as a categorical variable. As the label is a continuous variable, two critical approaches are commonly in use. In the first approach there will be a preprocessing stage to discretize the continuous label into a class label before applying a traditional decision tree algorithm. In the second approach a regression tree will be build from the data, directly using the continuous label. The basic limitation in these is its discretization is based on the entire training data rather than the local data in each node, which need to be rectified. Analysis directs us to conclude “Need of an efficient decision tree induction algorithm based on decentralization approach”. Traditional decision tree induction algorithms were developed under the assumption that the label is a categorical variable. Limited to one output Attribute. These algorithms are unstable. Trees created from numeric datasets can be complex. The objective is to developing a two level based decision tree induction algorithm that works on dataset with non continuous attributes.
The proposed system performs two approaches that are: In Preprocessing stage we apply discretization on continuous label into a class label. This discretization should be done by a finite set of disjoint intervals. One of the popular data discretization methods like “equal width method”, “equal depth method”, “clustering method”, “Monothetic Contrast Criterions (MCCs)method”, “3-4-5 partition method” will be used. In Classification phase we will apply a regression tree algorithm, such as Classification and Regression Trees (CARTs), using the continuous label directly
V. COMPARISON OF CLASSIFICATION ALGORITHMS
Algorithm designers have had much success with equal width method, equal depth method approaches to building class descriptions. It is chosen decision tree learners made popular by ID3, C4.5 (Quinlan1986) and CART (Breiman, Friedman, Olshen, and Stone 1984) for this survey, because
they are relatively fast and typically they produce competitive classifiers. In fact, the decision tree generator C4.5, a successor to ID3, has become a standard factor for comparison in machine learning research, because it produces good classifiers quickly. For non numeric datasets, the growth of the run time of ID3 (and C4.5) is linear in all examples.
The practical run time complexity of C4.5 has been determined empirically to be worse than O (e2) on some datasets. One possible explanation is based on the observation of Oates and Jensen (1998) that the size of C4.5 trees increases linearly with the number of examples. One of the factors of a in C4.5’s run-time complexity corresponds to the tree depth, which cannot be larger than the number of attributes. Tree depth is related to tree size, and thereby to the number of examples. When compared with C4.5, the run time complexity of CART is satisfactory.
VI. CONCLUSION
Traditional classification decision tree induction algorithms were developed under the assumption that the label is a categorical variable. When the label is a continuous variable, two major approaches have been commonly used. The first uses a preprocessing stage to discretize the continuous label into a class label before applying a traditional decision tree algorithm. The second builds a regression tree from the data, directly using the continuous label. Basically, the algorithm proposed in this paper was motivated by observing the weakness of the first approach—its discretization is based on the entire training data rather than the local data in each node. Therefore, we propose a decision tree algorithm that allows the data in each node to be discretized dynamically during the tree induction process. We analyzed the classification algorithms then applied for the proposed system, here the data set input as a categorical variable.
In pre-processing stage categorical variable is converted into continuous variable using class label approach including the MCCs method or clustering methods. The results indicates that our algorithm performs well in both efficient and precision. Finally we compare our classification algorithms like ID3, C4.5, CART. This work can be extended in several ways. We may consider ordinal data, which have mixed characteristics of categorical and numerical data. Therefore, it would be interesting to investigate how to build a DT with ordinal class labels or intervals of ordinal class labels. Furthermore, in practice, we may need to simultaneously predict multiple numerical labels, such as the stock price, profit, and revenue of a company.
VII. REFERNCES
[1] Baker, R., Corbett, A., Koedinger, K. Detecting Student Misuse of Intelligent Tutoring Systems. Intelligent Tutoring Systems. Alagoas, 2004. pp.531–540.
[3] Cocea, M., Weibelzahl, S. Can Log Files Analysis Estimate Learners’ Level of Motivation? Workshop on Adaptivity and User Modeling in Interactive Systems, Hildesheim, 2006. pp. 32-35.
[4] Delgado, M., Gibaja, E., Pegalajar, M.C., Pérez, O. Predicting Students’ Marks from Moodle Logs using Neural Network Models. Current Developments in Technology- Assisted Education, Badajoz, 2006. pp.586-590.
[5] Fausett, L., Elwasif, W. Predicting Performance from Test Scores using Back propagation and Counterpropagation. IEEE Congress on Computational Intelligence, 1994. pp.3398–3402.
[6] Hämäläinen, W., Vinni, M. Comparison of machine learning methods for intelligent tutoring systems. Conference Intelligent Tutoring Systems, Taiwan, 2006. pp. 525–534.
[7] Kotsiantis, S.B., Pintelas, P.E. Predicting Students Marks in Hellenic Open University. Conference on Advanced Learning Technologies. IEEE, 2005. pp.664- 668.
[8] Minaei-Bidgoli, B., Punch, W. Using Genetic Algorithms for Data Mining Optimization in an Educational Web-based System. Genetic and Evolutionary Computation, Part II. 2003. pp.2252– 2263.
[9] Romero, C., Ventura, S. Educational Data Mining: a Survey from 1995 to 2005. Expert Systems with Applications, 2007, 33(1), pp.135-146.
[10]Yudelson, M.V., Medvedeva, O., Legowski, E., Castine, M., Jukic, D., Rebecca, C. Mining Student Learning Data to Develop High Level Pedagogic Strategy in a Medical ITS. AAAI Workshop on Educational Data Mining, 2006. pp.1-8.
[11]Piatetsky-Shapiro, G. (1991), Discovery, analysis, and presentation of strong rules, in G. Piatetsky-Shapiro & W. J. Frawley, eds, ‘Knowledge Discovery in Databases’, AAAI/MIT Press, Cambridge, MA.
[12]R. Agrawal; T. Imielinski; A. Swami: Mining
Association Rules Between Sets of Items in Large
Databases", SIGMOD Conference 1993: 207-216
[13]D. Mutz, F. Valeur, G. Vigna, and C. Kruegel, “Anomalous System Call Detection,” ACM Trans. Information and System Security, vol. 9, no. 1, pp. 61-93, Feb. 2006.M. Thottan and C. Ji, “Anomaly Detection in IP Networks,” IEEE Trans. Signal Processing, vol. 51, no. 8, pp. 2191-2204, 2003.
[14]C. Kruegel and G. Vigna, “Anomaly Detection of Web-Based Attacks,” Proc. ACM Conf. Computer and Comm. Security, Oct. 2003.
[15]Text Book of Data mining Techniques by Arun K Pujari Universities Press (India) Private Limited.
[16]Breiman, L., Friedman, J., Olshen, L and Stone, J. (1984). Classification and Regression trees. Wadsworth