Citation:
Chang, V and Walters, RJ and Wills, G (2015) Monte Carlo simulation as a service in the Cloud. International Journal of Business Process Integration and Management, 7 (3). 262 - 271. ISSN 1741-8763 DOI: https://doi.org/10.1504/IJBPIM.2015.071245
Link to Leeds Beckett Repository record: http://eprints.leedsbeckett.ac.uk/1932/
Document Version: Article
The aim of the Leeds Beckett Repository is to provide open access to our research, as required by funder policies and permitted by publishers and copyright law.
The Leeds Beckett repository holds a wide range of publications, each of which has been checked for copyright and the relevant embargo period has been applied by the Research Services team.
We operate on a standard take-down policy. If you are the author or publisher of an output and you would like it removed from the repository, please contact us and we will investigate on a case-by-case basis.
M
ONTEC
ARLOS
IMULATION AS AS
ERVICE IN THEC
LOUD Victor Chang1,2, Robert John Walters2, Gary Wills21. School of Computing, Creative Technologies and Engineering, Leeds Metropolitan University, Leeds, UK.
2. Electronics and Computer Science, University of Southampton, Southampton, UK. [email protected]
Abstract
Limitations imposed by the traditional practice in financial institutions of running price and risk analysis on the desktop drive analysts to use simplified models in order to obtain
acceptable response times. Typically these models make assumptions about the distribution of market events like defaults. One popular model is Gaussian Copula which assumes events are independent and form a “normal” (Gaussian) distribution. This model provides good risk estimates in many situations but unfortunately it systematically underestimates risk for unusual market conditions, the very time when analysts most need good estimates of risk. They run away from using Monte Carlo simulations since they can take days. We propose a Monte Carlo Simulation as a Service (MCSaaS) which takes the benefits from two sides: The accuracy and reliability of typical Monte Carlo simulations and the fast performance of running and completing the service in the Cloud.
In the use of MCSaaS, we propose to remove outliers to enhance the improvement in
accuracy. In the process of doing so, we propose three hypotheses. We describe our rationale and steps involved to validate them. We set up three major experiments. We conform that firstly, MCSaaS with outlier removal can reduce percentage of errors to 0.1%. Secondly, MCSaaS with outlier removal is expected to have slower performance than the one without removal but is kept within 1 second difference. Thirdly, MCSaaS in the Cloud has a
significant performance improvement over the Gaussian Copula on Desktop. We describe the architecture of deployment, together with examples and results from a proof of concept implementation which shows our approach is able to match response rates of desktop systems without making simplifying assumptions and the associated potential threat to the accuracy of the results.
Key Words
Monte Carlo Methods; Monte Carlo Simulation as a Service (MCSaaS); Least Square Methods (LSM); Gauusian-Copula.
1 Introduction
Analysts working in the Financial Sector use models to predict risks and market behaviour, and as an aid to their decision making regarding trading activity and setting prices for financial instruments. With the arrival of modern desktop computers, it has become possible for analysts to perform many of these tasks on the desktop and it is clear this is how they like to work. However, there are limits to the desktop environment which means larger-scale software simulation to calculate risk and pricing using techniques like Monte Carlo simulation take hours to complete (MacKenzie and Spears, 2012). Techniques such as the Variance Gamma Process (VGP) (Madan, Carr and Chang, 1998) can be used to reduce the number of simulations necessary to obtain good results but it still not possible to obtain satisfactory results quickly enough to satisfy analysts requirements.
derivatives in the finance industry prior to the 2008 crisis. Using this model, it is possible to calculate results in an acceptable time in the desktop environment. However, although this model offers a good approximation in ordinary situations, it has some shortcomings, notably that it underestimates risks markedly for relatively unlikely market conditions.
In this paper, we propose an alternative solution to the problem which permits reducing the response time to perform market simulation and analysis down to acceptable level whereby, rather than compromise the value of the result by adopting an approximate model, recent advances in Cloud Computing enable the application of sufficient computing resources to complete the desired analysis in an acceptable time. We describe one approach using Monte Carlo Simulations and Least Squares Method and the results from experiments using a prototype implementation which show the benefits of using Cloud Computing in this context compared with the traditional approach.
1.1
Rise and fall of the Gaussian Copula model
A collateralised debt obligation (CDO) is a type of structured asset-backed security. They are issued by specially incorporated entities which sell series of bonds for cash which is used to buy assets. Typically these assets include corporate loans, mortgage backed securities and commercial property bonds. The income from these assets is then used to pay the promised cash flows of the bonds which are issued in a serried of tranches. Should there be a shortage of income from the assets, payment is made to bonds according to their rank in the tranches. Earlier issued bonds take priority, the latest tranches are the first not to be paid. As with all asset-backed securities, the risk to the holder of the bonds does not depend so much on the underlying assets as on the definition of the various tranches, effectively transferring the risk associated with the underlying assets to the holders of the bonds. Issuers of CDOs generally receive an initial commission and management fees for the lifetime of the CDO. A particular feature of this type of security is that there is no residual risk to issuers who are therefore encouraged to pursue asset volumes rather than quality.
David X Li is credited with developing concepts and techniques widely used by financial analysts prior to the financial crisis in 2008 to model ‘credit derivatives’ and calculate risks and values for collateralised debt obligations (CDO) which had previously been thought too complex to price (Li and Liang, 2005). Using Li’s technique it became possible to derive figures for yields of a corporation’s bonds and the prices of new credit swaps rapidly. He did this by adopting a notion of the “survival time” of an individual corporation (the time until it defaults) in combination with the “copula function” which is an established technique used in mortgage lending to calculate the impacts of defaults due to death of one of the borrowers (Free, Carriere and Valdez, 1996).
Li then incorporated his work into a popular financial software package, CreditMetrics, and Copula function together to establish “Gaussian copula” model, which has been used by the finance industry since 1997 (MacKenzie and Spears, 2012). Combining the two approaches permitted the finance sector to enjoy benefits from both – Gaussian’s simplicity and
familiarity and copula’s unified and easy-to-use approach.
CDO Evaluator was the final version of Li’s software. According to interviews with experts and developers working in financial services by MacKenzie and Spears (2012), CDO
Evaluator became very popular amongst quantitative developers and investment banks for the following reasons:
• It avoided the need to think of many variables which are time-consuming to obtain. • It was easier to understand since there were fewer variables to consider.
within teams. Concepts of “Gaussian copula” model and the CDO Evaluator could ease these difficulties.
• Developers found it easy to reproduce Li’s concepts due to the simplicity of the model and the problem.
• Li’s software was backed by some leading quantitative developers at that time, and was in widespread use in investment banks.
• It meant analysts could avoid using Monte Carlo simulations that took overnight or longer to complete.
The drawback for this approach is that for the Gaussian-Copula simplification to be valid, there can be little or no correlation between events. As correlation between events rises, the holders of the latest investments become increasingly at risk and Gaussian-copula based models break down in such conditions (MacKenzie and Spears, 2012). Unfortunately, this is exactly what happened in the run up to the financial crisis of 2007/8 and commentators believe that the problem was aggravated by traders actions which were based on seriously underestimated estimates of risk generated by Gaussian-Copula based analyses (Ma, 2009).
1.2
The problem and our proposal
As discussed in Section 1.1, the problems are due to the wide adoption, limitation and potential abuse (by traders) of the Gaussian Copula model. In our previous publication (Chang et al, 2011), we demonstrate that the use of Cloud Computing applications can support large-scaled simulations, e.g., up to 500,000 simulations in one go and allow all simulations to be completed within 25 seconds in the Clouds. We also demonstrate that the accuracy can be achieved by introducing the Least Square Method which can perform regression to give high accuracy and reliability supported by literature and our results. While some quantitative developers do not use Monte Carlo simulations, that is because they write their code and perform their simulations on the desktop (MacKenzie and Spears, 2012). We propose that with the structured and systematic way to combine the Monte Carlo calculations in the Cloud, it can obtain the benefits from both sides: The accuracy and reliability from the Monte Carlo simulations and the excellent performance and resource sharing in the Cloud.
2 An Alternative to Gaussian-Copula: Monte Carlo
Simulation as a Service
Gaussian copula models are used in financial modelling and many banks’ mathematical models assume normal (Gaussian) distributions of events and may underestimate risks in real financial markets (Birge and Massart, 2001). Moreover, these models make assumptions about market behaviour which may not always be true with the result that the models can fail to detect risks, as highlighted by the financial crisis in 2008. To address this alternative, non-Gaussian financial models are needed. Various studies conclude that modelling of financial markets needs to be addressed in two stages; one for pricing and another for risk analysis (Feiman and Cearley, 2009; Chang, 2014). This means a more suitable model is required for large-scale of financial analysis. MCS is the most commonly adopted and provides data for investors’ decision-making amongst other models (Hull, 2009).
Li’s Gaussian-Copula model meant it did not work in extreme conditions (MacKenzie and Spears, 2012) with the consequence that it underestimated risks. According to Meissner (2008) who attended Li’s presentation, Li himself acknowledged the imitations of the model and said: “The current copula framework gains its popularity owing to its
simplicity....However, there is little theoretical justification of the current framework from financial economics....We essentially have a credit portfolio model without solid credit portfolio theory”.
2.1
The objective
With the Gaussian-Copula model discredited, there is need to find an alternative analysis technique. The obvious approach is to revert to a Monte-Carlo based technique but running simulations on desktop clearly takes too long. However, using new techniques and
technologies, it is possible to gain access to far more processing power than is available on the desktop. In particular, Cloud computing promises to provide users with flexible access to large computing resources on demand.
2.2
MCSaaS using Cloud Computing
Our proposal is to offer a Cloud based analysis service. With a Cloud based approach the limitations of the desktop no longer need apply, meaning a Monte-Carlo based solution which won’t suffer from the shortcomings of the Gaussian-Copula based solution can be feasible. For the particular application under consideration here, factors such as accuracy, speed, reliability and security of financial models and their attendant costs must be considered (Dixon, 2011). Some existing Grid based financial applications are available but they cannot be transferred to Cloud Computing easily (Kondo et al., 2009). Additionally, privacy and data ownership issues mean that public and hybrid Clouds are not suitable (Armbrust et al., 2009) making a private cloud the obvious choice for the financial sector.
We propose and describe a Monte Carlo based service (MCSaaS), a Cloud based service designed to improve accuracy and quality of both pricing and risk analysis in financial
markets, compared with traditional desktop technologies. MCSaaS is an example of Software as a Service (SaaS) with the emphasis on how the application offers quality services in private cloud environments. This is important because incorrect analysis leads to excessive risk taking which may then lead to financial losses, damage to business credibility or destabilised markets. We illustrate its use with an example which shows price and risk assessments for investments such as stocks and shares or financial derivatives in the context of different levels of volatility, maturity and risk free rates.
3 Methods used by MCSaaS
Adopting a better methodology not only enhances performance but also resolves some aspects of challenges. Barnard et al. (2003) demonstrate that having the right method is more
important than using a particular language.
3.1
Monte Carlo Simulation (Monte Carlo Methods)
game, this might involve highly complex calculations to take into account all of the various random factors, the behaviour of the players and interrelations between all of them.
Alternatively, they could arrive at an approximation by playing (or just watching) the game and recording the results. The more games they record and use, the more accurate their approximation is likely to be. This is the heart of Monte Carlo Methods (or Simulation); an aggregation of many simulations of the system under consideration is used to discover the behaviour of a system in place of deriving a theoretical result.
Using Monte Carlo Simulation involves the following steps:
1. Producing reliable forecasting: A model is generated which reproduces the probabilistic behaviour of the system to be considered.
2. Outlier removal: Using an understanding (or approximation) of the distribution of the input data to the system, values are generated for many simulations of the system. 3. Accuracy: The simulation is run using these sets of input data until sufficient
simulations have been performed to produce a result of the desired accuracy of result. All of the simulations are aggregated to arrive at the results.
4. Performance: The proposed solution can support large-scaled simulations such as up to 500,000 simulations in one go and can be completed within seconds.
When volatility is known, Monte Carlo Methods (MCM) can be used to calculate best prices for buy and sell, and provides data for investors’ decision-making (Waters, 2008).
Various enhancements may be used in conjunction with Mote Carlo Methods to reduce the number of simulations necessary to obtain a given degree of accuracy in the result. For example, the application of error correction which may be applied throughout financial modelling; the type of errors which may be detected and eliminated include systematic errors in calculations and out of range of data. The use of the Variance-Gamma Process (VGP) in conjunction with Monte Carlo Methods (MCM) in this way has been the subject of a number of studies (Carr et al., 2002). When errors are identified, rectifications are found and applied automatically wherever possible (Zimmermann, R. Neuneier, R. Grothmann, 2006).
Brigo et al. (2007) describe their risk modelling process and explain how VGP may be used to reduce inconsistency. One drawback is that their technique works on desktop but not Cloud (Ribeiro and Webber, 2004). Another is that there is a practical limit to the number of simulations VGP can handle at once which prompts us to look for an alternative suitable for large numbers of simulations whilst maintaining accuracy and quality. For example, MCS written in a combination of Fortran and C# used by in Commonwealth Bank of Australia can take anything from several hours to more than a whole day to complete when they are run on the desktop (Chang et al., 2011).
3.2
Seamless removal of outliers
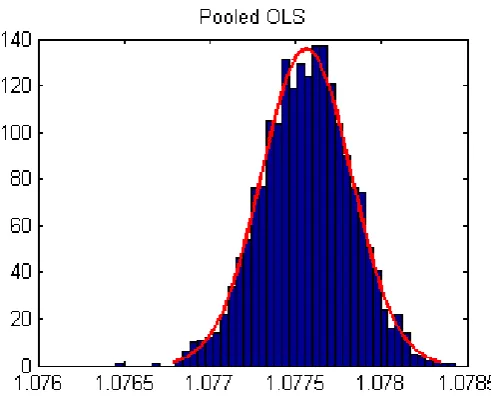
Figure 1: Frequency of call price simulation performed by LSM.
Figure 1 shows results of frequency of call price simulation performed by LSM. The x-axis is the call price and the y-axis is the number of frequency out of 1000. The higher the peak, the greater the probability. A key observation is that the majority of data plots in Figure 1 fall within the bell shape in red. This means that not many outliers (which appear to be noise-like wavelengths) have been observed. In addition, the red bell line indicates that the peak falls to 1.0775 as the call price, although the actual peak appears to be around 1.0776 while reading the peak (in indigo). This means that there is a difference between the estimated value and the actual value of the most-likely call price for the profitability. Our assertion is that using the integrated approach of seamlessly adopting outlier removal, the percentage of errors is lower than Monte-Carlo simulations without outlier removal. Hence, the hypothesis becomes
H1: Monte-Carlo simulations with outlier removal have lower percentages of errors than Monte-Carlo simulations without outlier removal.
Within MCSaaS, another key technique involved to optimise computational performance is Least Square Method (LSM). The advantage of using LSM is that it allows financial
computations in the Cloud to complete up to 500,000 simulations in one go in less than 25 seconds (Chang et al., 2011 a). The seamless approach can also ensure all financial
computations to run 500,000 times with their outliers removed, so that results can achieve greater accuracy. However, it is reported that financial computation by VGP takes longer time (Ribeiro and Webber, 2004 and Brigo et al., 2007; Chang et al., 2010), so we set the
hypothesis that
H2: The execution time between Monte-Carlo simulations without outlier removal is less than Monte Carlo simulations with outlier removal.
Additionally, Section 1 and 2 also describe that most of the financial computation performed by Gaussian Copula is on the desktop and has slower performance than using Cloud. Hence, the next hypothesis is
Key techniques involved in MCSaaS are the use of Least Square Method, which is presented in the following section.
3.3
Choice of Least Square Method (LSM) for MCSaaS
Completion of large numbers of Monte-Carlo simulations generates a large number of results which need to be assimilated into a single graph for which our service follows current finance industry practise and uses LSM. Various alternative methods were considered including stochastic simulation, Terms Structure Models (Piazzesi, 2010), Triangular Methods (Mullen et al., 1988; Mullen and Ennis, 1991), and Least Square Methods (LSM) (Chang et al., 2011; Longstaff and Schwartz, 2011; Moreno and Navas, 2001). Of these, Least Square Method (LSM) was chosen because it provides a direct method for problem solving, is appropriate for large problems and it lends itself to rapid calculation in the Cloud because its computation can be divided into sections which can be calculated independently (Moreno and Navas, 2001; Chang et al., 2011; Longstaff and Schwartz, 2011). Robust algorithms have been developed which estimate best values efficiently and precisely using LSM in combination with MCS which are popular and versatile (Moreno and Navas, 2001; Choudhury et al., 2008; Longstaff and Schwartz, 2011).
3.3.1 Least Square Method (LSM) for Monte Carlo Simulations (MCS)
Consider a data set (x1,y1), (x2, y2),....,(xn, yn) with the fitting curve f(x) has the deviation d1, d1,
.... , dn caused by each data point, the least square method produces the best fitting curve with
the property as follows
2 1 1 2 2 2 1 2 2 2
1 ... [ ( )]
) (
∑
∑
= = − + = = − + + + = Π n i i n i i i nn d d y f x
d d
d ror
stSquareEr
MinimumLea (1)
The least squares line method uses an equation f(x) = a + bx which is a line graph and describes the trend of the raw data set (x1,y1), (x2, y2),....,(xn, yn). The n should be greater or
equal to 2 (n≥ 2)in order to find the unknowns a and b. So the equation for the least square line is 2 1 1 2 2 2 1 2 2 2
1 ...
∑
∑
[ ( )]= = − + = = − + + + + = Π n i i n i i i n
n d d y a bx
d d
d (2)
The least squares line method uses an equation f(x) = a + bx + cx2which is a parabola graph. The n should be greater or equal to 3 (n≥ 3)in order to find the unknowns a, b, and c. When you get the first derivatives of ∏ in parabola, you will have
2
1 1 1 1
2 1 2 2 2 1 2 2 2
1 ...
∑
∑
[ (∑ ∑
∑
)]= = = = = − + = = − + + + + + = Π n i n i n i n i i n i i i n
n d d y a bx cx
d d
d (3)
LSM has been mathematically proven and allows advanced calculations of complex systems. f(x) = a + bx + cx2 is the equation for LSM. LSM provides a direct method for problem solving, and is extremely useful for linear regressions. LSM simulates and performs
calculations by linear regression, which attempt to fit to the parabolic function to get a precise approximation to the actual values closely. LSM computation can either use data or
mathematical predictive modelling (no data).
3.4
Accurate Risk modelling using the Monte-Carlo and Least Squares
Methods
likely price, upper limit and lower limit. Risk analysis is carried out using models of both the American and European styles of option as both are popular. The difference is that an
American option may exercise at any time but European options may only be exercised at expiry (Hull, 2009). The majority of exchange-traded options are American. Adopting both options is useful because American options indicate average performance, and European options give the best pricing or risk at the time that research work takes place. Both American and European options can be converted to percentages (Hull, 2009; Chang et al., 2012). This means if a risk is calculated as the 7.52 risk price, it can be interpreted as 7.52% as the percentage that the risk can happen and the price to accept it is 7.52.
Chang et al (2011) explain how adopting LSM allows 100,000 MATLAB simulations to be run in the cloud, allowing such a calculation to be completed in a few seconds. MATLAB is used due to its ease of use with relatively good speed.
The following is the result of running LSM to calculate the expected risk price. MCAmericanPrice = 7.533 (risk price)
MCEuropeanPrice = 7.326 (risk price)
This means the average performance for risk price is 7.533 (i.e., 7.533% for operational risk to happen), and the best risk pricing that the completion of project or the end of investment (exit/expiry) to happen is 7.326 (7.326 % for operational risk to happen).
The next stage is to calculate the range of lower, upper and medium limit. This is an important step to calculate precise options. The put price is used to calculate risk pricing as it represents a price to accept this risk (Hull, 2009; Chang et al., 2012; Chang, 2013). MCSaaS calculations allow computation of accurate results of up to five decimal places including its exact price, lower limit and upper limit which corresponds to 95% confidence interval of the analysis. Option prices presented in Table 1 are the results of 500,000 simulations in the Cloud for the expected European option (for risk price).
Table 1: Precision result to calculate exact risk prices for European options
LowerLimit MCPrice (exact risk price) UpperLimit
Put Prices: 7.26761 7.32682 7.38596
4 Experiments and Benchmark in the Clouds using
MATLAB
Using MCSaaS, Monte Carlo Simulations with LSM can be performed quickly in the Cloud. In our previous work, we describe code used for experiments and benchmarking in the Clouds (Chang et al., 2011, 2012). Based on a core code algorithm, the code calculates the best American and European options. MCSaaS can calculate financial options using up to 500,000 simulations each time. Execution time (based on the average of three results) is used as the performance benchmark with standard deviations presented. Our objective is to demonstrate that:
H1: Monte Carlo simulations with outlier removal have lower percentages of errors than Monte-Carlo simulations without outlier removal.
H2: The execution time of Monte-Carlo simulations without outlier removal is less than Monte Carlo simulations with outlier removal.
4.1
Background information about a Cloud platform for running MCSaaS
There are several types of computing Cloud platform, each with its own benefits and
constraints. The main broad types are public, private and hybrid. As suggested by the name, Public Clouds are normally offered by commercial organisations who offer access to them in return for a fee. Private Clouds are contained within an organisation and not generally
available for use from outside the organisation. Hybrid clouds are a mixture of private and public clouds, being effectively private clouds with a facility to call upon additional resources from a public cloud when necessary.
The considerable amount of processing required for MCSaaS makes using a public Cloud an obvious choice for MCSaaS, especially in view of the nature of much of the calculation which can be performed independently and hence in parallel. These Clouds have virtually unlimited processing power available (subject to cost considerations) and should be highly reliable and available. They are also available without any capital or maintenance costs. However, they do have some drawbacks such as security; the objective of implementing and using MCSaaS is to achieve a competitive advantage in trading from the improved analysis it is able to produce. It is therefore important to ensure the results of its analysis do not become available to
competitors. Indeed, it may be desirable to prevent competitors from being able to discern patterns of MCSaaS activity.
Security issues are solved by building and using a private Cloud. As a private facility, access to it can be strictly controlled and limited. It can also be established as a facility dedicated to MCSaaS work. In addition, any latency associated with passing data to and from the Cloud should be small since it is most likely to be located physically close to the analysts using it. As with public Clouds, there are disadvantages. The most obvious being the capital cost of obtaining the necessary hardware and the setup and maintenance costs. There will also be a trade-off to be made between the cost of building the private Cloud and the processing power it can provide.
In view of the nature of the application under consideration, which requires a great deal of processing to perform many thousands of simulations quickly if it is to match the performance of the discredited desktop applications which used Gaussian Copula techniques, it would appear that raw performance is likely to be the key consideration. Accordingly, experiments have been devised to establish the extent of the expected advantage of the Public Cloud in order to establish if this is sufficient to negate any potential costs associated with resolving the security issues arising from using a public facility.
4.2
Hardware used for experiments and benchmarks
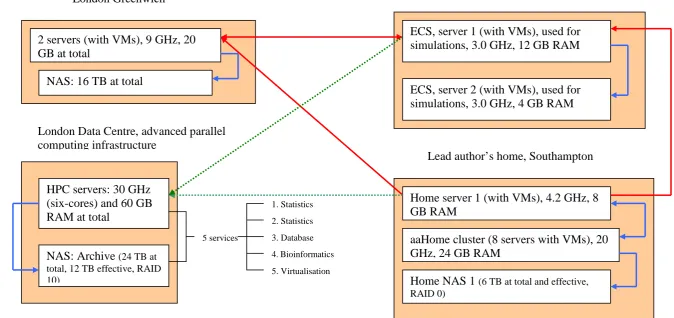
Desktop experiments used a high specification desktop machine: 2.67 GHz Intel Xeon Quad Core, 4 GB of memory (800 MHz). Figure 2 shows the architecture of the private cloud which involves six sites in total; two in London, two in Southampton and two further collaborator sites in Taiwan and Australia. The University of Southampton resources are used for all experiments, and are also used to connect lead author’s home cluster, Greenwich and London Data Centre. On the diagram, blue arrows indicate computational connections between internal networks.
Figure 2: Architecture of the private cloud.
London Data Centre, advanced parallel computing infrastructure
London Greenwich University of Southampton
Lead author’s home, Southampton ECS, server 1 (with VMs), used for simulations, 3.0 GHz, 12 GB RAM
ECS, server 2 (with VMs), used for simulations, 3.0 GHz, 4 GB RAM 2 servers (with VMs), 9 GHz, 20
GB at total
NAS: 16 TB at total
Home server 1 (with VMs), 4.2 GHz, 8 GB RAM
aaHome cluster (8 servers with VMs), 20 GHz, 24 GB RAM
Home NAS 1 (6 TB at total and effective, RAID 0)
HPC servers: 30 GHz (six-cores) and 60 GB RAM at total
NAS: Archive (24 TB at total, 12 TB effective, RAID 10)
5 services
1. Statistics
2. Statistics
4. Bioinformatics 3. Database
5. Virtualisation
Red arrows: simulations and computational connections between different networks. Blue arrows: simulations and computational connections between internal networks.
4.3
Cross-platform baseline experiments before validating three hypotheses
Cross-platform baseline experiments are necessary before validating our three hypotheses as we need to quantify performance differences between different platforms so we can make a fair comparison when validating the three hypotheses.
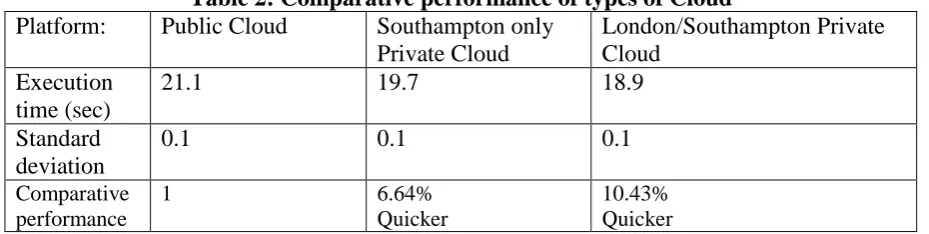
[image:12.595.67.532.282.399.2]Five different experiments were designed. Each set of experiments recorded execution time for a sample exercise using MATLAB 2009 running from 50,000 to 500,000 simulations with the results for each set of experiments recorded. Multiple runs were made of each set of experiments, under the same conditions and parameters each time to ensure average execution time is a reasonable performance indicator. The experiments were run on one public Cloud and two configurations of private Cloud and the results were unexpected. The final results are shown in Table 2.
Table 2: Comparative performance of types of Cloud
Platform: Public Cloud Southampton only Private Cloud
London/Southampton Private Cloud
Execution time (sec)
21.1 19.7 18.9
Standard deviation
0.1 0.1 0.1
Comparative performance
1 6.64%
Quicker
10.43% Quicker
Far from exhibiting an overwhelming advantage expected from the public Cloud, the performance of all three Cloud configurations was similar suggesting that a preference for using a private Cloud for MCSaaS arising from security concerns does not present a barrier to obtaining satisfactory performance.
4.4
Experiments validating the first hypothesis
Results in Section 4.3 show that performance of running MCSaaS is the best on the Private Cloud (London and Southampton), Private Cloud (Southampton) and Public Cloud. For the purpose of validating the first hypothesis, experiments were performed on the Private Cloud (Southampton). MCSaaS with and without outlier removal were performed five times and compared results with each other. Both call prices for the actual values and estimated values were recorded. The percentage of errors can be worked out by the followings:
• Finding the difference between the actual and estimated values in the call price; • The difference value is then divided by the actual value.
Results are presented in Table 3 as follows. It shows that MCSaaS without outlier removal is 50 times more accurate than the one without outlier removal, although both percentage rates are below 1%.
Table 3: Comparison between MCSaaS with or without outlier removal
Comparison type Percentage of errors (%) Standard deviation (%)
MCSaaS with outlier removal 0.01 0
4.5
Experiments validating the second hypothesis
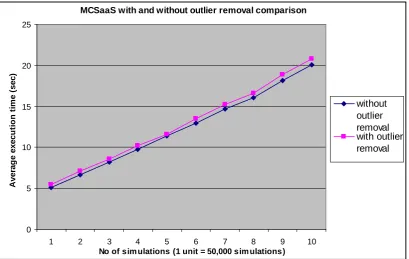
Similar to Section 4.4, experiments were performed on the Private Cloud (Southampton). The purpose is to compare performance of MCSaaS with and without outlier removal. All
experiments were performed five times and their results of the execution time were recorded for simulations between 50,000 and 500,000. Figure 3 shows results of the execution time of performing between 50,000 and 500,000 simulations. Although MCSaaS without outlier has the better performance as expected, it has less than 1 second quicker in all the tests. This also means that the improvement with the outlier removal is worth the effort, since it has 50 times more accurate than the MCSaaS without outlier removal.
MCSaaS with and without outlier removal comparison
0 5 10 15 20 25
1 2 3 4 5 6 7 8 9 10
No of sim ulations (1 unit = 50,000 sim ulations)
A
ver
ag
e execu
ti
o
n
t
im
e (
sec)
[image:13.595.77.487.222.481.2]without outlier removal with outlier removal
Figure 3: MCSaaS with and without outlier removal comparison
4.6
Experiments validating the third hypothesis
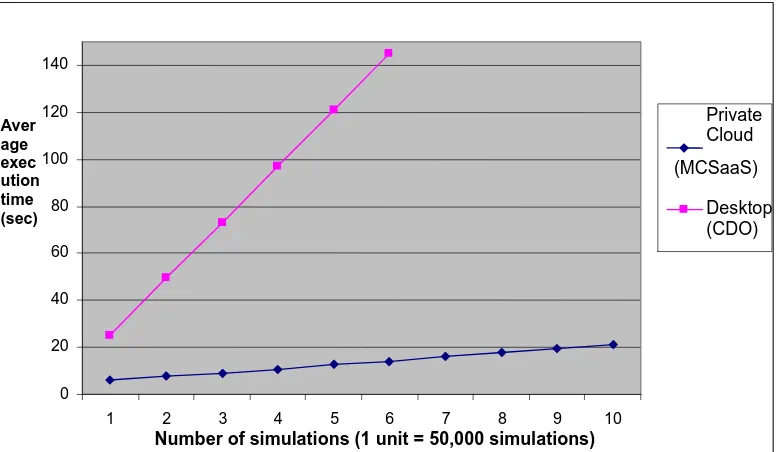
Figure 4: Performance comparison between MCSaaS (private cloud) and Gaussian CDO on desktop.
5
Discussions: benefits offered by MCSaaS
Two topics of discussions are presented as follows.
5.1
Benefits offered by MCSaaS
This section presents the benefits offered by MCSaaS. Firstly, it supports outlier removal and integrates it seamlessly with the MCSaaS to ensure a good level of computational quality prior risk modelling. Secondly, it offers a precision method to calculate risk prices up to five decimal places with 95% confidence interval presented. This allows stakeholders to
understand the likely range and to make appropriate decisions to reduce risk. Thirdly, 500,000 simulations in the Cloud takes around 20 seconds to complete instead of more than 140 seconds for running up to 300,000 simulations on desktop. Cloud Computing provides better performances in achieving shorter execution time and running more simulations than the desktop. Fourthly, MCSaaS offers cost saving, as the entire infrastructure cost than £81,000 to build and do not need millions of spending in investment banks. These four major points can bring long-term benefits in adopting MCSaaS in the Cloud. It can allow
researchers, stakeholders and organisations to produce accurate and reliable risk analysis that can be completed much quickly than desktop, and offer them cost saving.
We also set up three hypotheses and explain our steps to validate them. We demonstrate that MCSaaS with outlier removal can keep the percentage of errors to be within 0.01%. It is only less than 1 second slower than MCSaaS without outlier removal and has a significant
performance improvement over Gaussian CDO on Desktop. 0
20 40 60 80 100 120 140
1 2 3 4 5 6 7 8 9 10
Number of simulations (1 unit = 50,000 simulations)
Private Cloud
(MCSaaS)
Desktop (CDO)
[image:14.595.76.465.81.307.2]5.2
Contributions to risk analysis
There are many types of risks that affect businesses including market risk, credit risk, liquidity risk, legal/reputation risk and operational risk. Behavioural models of systems are often constructed to predict likely outcomes under different contexts and scenarios. Both analytical and simulations methodologies are applied to these models to predict likely outcomes.
For a variety of reasons, financial analysts have traditionally favoured desktop solutions leading to widespread adoption of risk models which rely on Gaussian-Copula type approximations to make completion of the necessary calculations practical. However, this type of model makes dangerous assumptions about the nature of market risks. In particular, they assume little or no dependence between events such as defaults. This may be reasonable in a stable market, but at least a proportion of the changes which occur in unstable market situations affect the market as a whole meaning that analysis results from models which assume independence are not reliable and can lead to serious underestimates of risk in unstable market situations. The recent financial crisis brought an abrupt end to the use of this type of model which, according to some experts was a contributory factor.
Our proposed solution offers accurate results to reduce percentage of errors to be within 0.01%. This can help finance industry a good alternative for risk analysis and risk reduction in their operational work and investment decision.
6
Conclusion
Our proposed MCSaaS is an obvious alternative technique which has the potential to provide high quality analysis of pricing and risks in financial markets. However, to obtain these accurate and reliable results, large numbers of simulations are required and the processing required to perform such analysis is not practical using the desktop environment where it can take many hours to complete. The alternative we propose is to use a Cloud based service which, by taking advantage of the considerably increased capability of Cloud Computing, even compared with the most powerful desktop, permits the use of Monte Carlo techniques without the response penalty associated with using such techniques on the desktop.
We propose three hypotheses with their rationale explained. We set up the experiments and explain the process involved to validate our hypotheses. Firstly, we confirm that the use of outlier removal can reduce the percentage of errors to be 0.01% instead of 0.5% for those without outlier removal. Secondly, we show that the MCSaaS with outlier removal is expected to have longer execution time but can be managed to keep within 1 second
difference than those without outlier removal. Thirdly, the use of MCSaaS in the Cloud has a significant performance improvement than the Gaussian CDO on Desktop and can complete 500,000 simulations in 21 seconds. The Deskptop Gaussian CDO takes more than 140 seconds and cannot go beyond 300,000 simulations.
References
Armbrust, M., Fox, A., Griffith, R., Joseph, A. D., Katz, R. H., Konwinski, A., Lee, G., Patterson, D., Rabkin, A., Stoica, I., Zaharia, M.,, Above the Clouds: A Berkeley View of Cloud computing, Technical Report, No. UCB/EECS-2009-28, UC Berkeley, February 2009. Barnard, K., Duygulu, P., Forsyth, D., De Freitas, N., Blei, D.M. and Jordan, M.I., “Matching Words and Pictures”, Journal of Machine Learning Research, page 1107-1135, February 2003.
Bhansali, V., Gingrich, R. and Longsta, F.A., System Credit Risk: What is the Market Telling us? Financial Analysts Journal, Vol. 64, No. 4, page 16-24, 2008.
Birge, L., and Massart, P., Gaussian model selection, Journal of the European Mathematical Society, 3 (3) 203 - 268, 2001.
Brigo, D., Dalessandro, A., Neugebauer, M. and Triki, F., A Stochastic Processes Toolkit for Risk Management, Working Paper, King's College London, November 2007.
Carr, P. , Geman, H., Madan D. and Yor, M., The fine structure of asset returns: An empirical investigation, Journal of Business, 75 (2002) 305-332.
Chang, V., Li, C.S, De Roure, D., Wills, G., Walters, R.J. and Chee C., The Financial Clouds Review, International Journal of Cloud Applications and Computing, 1 (2) 46-63, 2011. Chang, V., Walters R.J. and Wills, G., Business Integration as a Service, International Journal of Cloud Applications and Computing, 2 (1), 16-40, 2012.
Chang, V., Business integration as a service: computational risk analysis for small and medium enterprises adopting SAP, International Journal of Next-Generation Computing, 4 (3), 2013.
Chang, V., Business Intelligence as a Service in the Cloud, Future Generation Computer Systems, 2014.
Choudhury, A.R., King, A., Kumar, S. and Sabharwal, Y., Optimisations in Financial Engineering: the Least-Squares Monte Carlo method of Longstaff and Schwarts, IEEE International Parallel and Distributed Computing, IPDPS 2008.
Dixon, E., Cloud Computing - Benefits and Barriers for Financial Services organisations, in: Cobweb White Paper, 2011.
Feiman, J. and Cearly, D. W., Economics of the Cloud: Business Value Assessments, Core Research White Papers, Gartner RAS, 2009.
Frees, E. W., Carriere, J. and Valdez, E., Annuity Valuation with Dependent Mortality, Journal of Risk and Insurance 63:229-261, 1996.
Hull, J. C., Options, Futures, and Other Derivatives, Seventh Edition, Prentice Hall, ISBN-10: 0136015867, 2009.
Kondo, D., Javadi, B., Malecot, P., Cappello, F. and Anderson D.P., Cost-Benefit Analysis of Cloud Computing versus Desktop Grids, in: 18th International Heterogeneity in Computing Workshop, Rome, Italy, 2009.
Li, D. X. and Liang, M., CDO2 Pricing Using Gaussian Mixture Model with Transformation of Loss Distribution, technical paper, Barclays Capital, September 2005.
Ma, Q. P.,The Global Financial Crisis, Financial innovations and risks in the financial system, The 2nd GEP Conference in China, November 2009, Ningbo, China.
MacKenzie, D. and Spears, T., The Formula That Killed Wall Street?, The Gaussian Copula and the Material Cultures of Modelling", Working paper, School of Social and Political Science, the University of Edinburgh, June 2012.
Madan, D. B., Carr, P. P. and Chang, E. C., The Variance Gamma Process and Option Pricing, European Finance Review 2: 79–105, 1998.
Meissner, G. (editor), The Definitive Guide to CDOs, Risk Books, pg. 71, 2008.
Moreno, M. and Navas, J.F., On the Robustness of Least-Square Monte Carlo (LSM) for Pricing American Derivatives, Journal of Economic Literature Classification, April 2001. Mullen, K., Ennis, D.M, de Doncker, E. and Kapenga, J.A., Models for the duo-trio and triangular methods, Journal of Biometrics, 44, 1169-1175, 1988.
Mullen, K. and Ennis, D.M., A simple multivariate probabilistic model for preferential and triadic choices, Journal of Psychometrika, Volume 56, Number 1, 69-75, DOI:
10.1007/BF02294586, 1991.
Piazzesi, M., Affine Term Structure Models, Book Chapter, Chapter 12, Elsevier B.V., Department of Economics, Stanford University, Stanford, CA, USA, 2010.
Ribeiro, C. and Webber, N., Valuing path-dependent options in the variance-gamma model by Monte Carlo with a gamma bridge, The Journal of Computational Finance, 7 (2004) 81– 100.
Salmon, F., Recipe to Disaster, Wired magazine, February 2009.