Volume 2010, Article ID 978694,18pages doi:10.1155/2010/978694
Research Article
Energy-Efficient Query Management Scheme for
a Wireless Sensor Database System
Guofang Nan
1, 2and Minqiang Li
31Institute of Systems Engineering, Tianjin University, Tianjin 300072, China 2Department of Electronics, Polytechnic University of Turin, Turin 10129, Italy
3Department of Information Management and Management Science, Tianjin University, Tianjin 300072, China
Correspondence should be addressed to Guofang Nan,[email protected]
Received 5 November 2009; Revised 6 April 2010; Accepted 3 June 2010 Academic Editor: Xinbing Wang
Copyright © 2010 G. Nan and M. Li. This is an open access article distributed under the Creative Commons Attribution License, which permits unrestricted use, distribution, and reproduction in any medium, provided the original work is properly cited. Minimizing the communication overhead to reduce the energy consumption is an essential consideration in sensor network applications, and existing research has mostly concentrated on data aggregation and in-network processing. However, effective query management to optimize the query aggregation plan at the gateway side is also a significant approach to energy saving in practice. In this paper, we present a multiquery management framework to support historical and continuous queries, where the key idea is to reduce common tasks in a collection of queries through merging and aggregation, according to query region, attribute, time duration, and frequency, by executing the common subqueries only once. In this framework, we propose a query management scheme to support query partitioning, region aggregation and approximate processing, time partitioning and aggregation rules, multirate queries, and historical database. In order to validate the performance of our algorithm, a heuristic routing protocol is also described. The performance simulation results show that the overall energy consumption for forwarding and answering a collection of queries can be significantly reduced by applying our query management scheme. The advantages and disadvantages of the proposed scheme are discussed, together with open research issues.
1. Introduction
With the development of low-power hardware manufactur-ing and integration, it is possible to design tiny sensor devices combining the abilities of sensing, computation, storage, and
communication [1]. These nodes collect sensor data and
communicate with each other, forming a network to monitor objects, animals, people, temperature, humidity, and so on
in a given area [2]. The appearance of wireless sensor
networks has significantly changed various kinds of remote sensing applications such as environmental and ecological monitoring of natural habitats, smart homes, and military
areas in recent years [3].
Due to the facts that sensor nodes are physically small and must use extremely limited power or energy, the network lifetime is still a vital problem. Many of the WSN (wireless sensor network) techniques designed to extend the network lifetime are concentrated on modified routing protocols
[4–6], in-network processing [7,8], node sleep scheduling
[9,10], and aggregation strategies [11–13]. Recent studies
have shown that radio communication is significantly more expensive than computation or sensing in most existing sensor node platforms, hence the main consideration is to minimize the communication overhead of forwarding queries and transmitting queried data between gateway and
source nodes [14]. Thus, information aggregation is effective
to save energy and extend the network lifetime. According to the location where aggregation occurs, aggregation strategies can be divided into two main types: data aggregation and query aggregation. Data aggregation belongs to the category of in-network filtering and processing techniques,
which combine the data coming from different sources
and eliminate data redundancy to minimize the number
of transmissions, thus saving energy [15]. Most of the
existing work in this area focuses on data aggregation. Query aggregation occurs at a query manager node, which is usually located at the gateway, and has been the subject
applications, especially those with high query rates, for example, a large number of very similar queries are issued to the network within a short period, due to a large number of users, while the response data to each individual query is
comparatively simple [16]. If we assume that all the queries
are processed individually, this will lead to large amount of energy consumption due to query dissemination and data transmission within the network. Therefore, a proper query aggregation and management scheme should be used to reduce redundant queries in order to minimize wasted bandwidth, power, and energy.
The problem of efficient query aggregation on the
gateway side for a sensor database system has been treated
previously in the literature [14,16–19]. In order to provide
efficient data services for sensor network applications, an
overlay-based query aggregation approach including a query
manager and an effective query aggregation algorithm were
presented in [16]. The former defines the query aggregation
plan that is executed by the latter. In their query model, only spatial information is aggregated to minimize the number of queries that are actually sent out. A spatial- and attribute-based query aggregation method (SAQA) was introduced
in [19], which extends the aggregation to include also
attributes. However, their models assume that most queries are snap-shot (queries that ask for current value of the sensors), which may not be the case in practice, because users sometimes ask for sensor values during a period of time (continuous query). Similar to their work, several other models supporting continuous queries were discussed in
[14,17,18], which propose two significant ideas: exploiting
common subqueries in a group and using a proper routing algorithms to minimize the total system cost.
However, there are still two main limitations of the works mentioned above. One is that there is still some redundancy in the aggregated queries, due to time duration: for instance, two queries that ask for the same type of sensing data in the same region at an overlapping duration can be aggregated into one. The other is that the historical database is not fully utilized. We assume that all the (recent) query records are stored in a historical database located at the gateway side, where the query manager can check for already present information before injecting new queries into the network. Thus, in this paper we propose a complex query optimization framework to support historical and continuous queries, and we describe the corresponding query processing scheme.
In contrast to previous work, our contributions can be summarized as follows. We propose a multiquery opti-mization framework suitable for historical and continuous queries. In contrast to previously proposed query optimiza-tion schemes, the query partioptimiza-tion module, the aggregaoptimiza-tion module, and the result merging module are also included in the framework to optimize the objective function. A storage mechanism of historical query records is kept at the gateway side, and we propose an algorithm for querying it. Query partitioning, region aggregation and approximate processing, time partitioning and aggregation rules, as well multirate query processing algorithms are presented.
The rest of this paper is organized as follows.Section 2
presents some research works related to ours. Section 3
introduces the multiquery problem. InSection 4, we propose
our energy efficient framework including the query partition
module, query aggregation module, query result merging
module, and historical database module.Section 5presents
the corresponding algorithms to support our query
frame-work. InSection 6, we present simulation and experiment
results to demonstrate the efficiency of the work and
compare it with other query processing techniques. Finally, the advantages and disadvantages of the proposed scheme are
discussed, together with open research issues inSection 7.
2. Related Work
Generally, when the gateway node receives queries from applications by end-users to ask for sensor data they are interested in, it will directly forward them to the sensor network according to given query dissemination schemes. Within the network, the nodes must respond to these
queries in an energy-efficient manner using a variety of
in-network processing techniques and cross-layer optimizations to report answers to the end-users at the appropriate rates
[20]. A wireless sensor network can be regarded as a
distributed database, due to the fact that sensing information
is often reported from a number of different sources and
is often held in a number of databases that may be distributed among computing and communication facilities
at different locations [21]. Thus, the previous work related
to this paper consists of two main aspects, namely, complex query optimization in traditional distributed databases and multiquery aggregation in wireless sensor databases.
2.1. Complex Query Optimization in Traditional Distributed Databases. The problems of complex query optimization
[22,23] and multiquery aggregation have been studied in
the traditional database literature for more than 40 years. The core idea is to exploit the common tasks among groups of queries and perform them only once to reduce the
execution cost [24,25]. Most studies emphasized efficiently
generating alternative plans that maximize shared operations
and minimize system cost [26]. Several heuristic algorithms
[24,27] have been studied to identify common tasks and to
select a plan for each query. In order to solve the multiquery optimization problem, the partitioning of complex queries
was discussed in [28], which leads to a better interpretation
of complex aggregate queries and a better execution plan. The author also presented two algorithms to decompose a complex aggregate query into its group query components, and the experiments show the validity of complex query partitioning. The concept of sketch sharing for approximate
multiquery stream processing was presented in [29] to
optimize multiqueries. Given a collection of queries to be processed over incoming streams, the same sketches over their input streams are optimized by performing space allocation and coalescing rules. The final results clearly
demonstrate that sketch sharing is efficient to solve the
multiquery problem, especially with respect to the quality of query answering. Even though these studies cannot be
storage, communication, and energy constraints, the core idea about query partitioning and query aggregation is significant to our work.
2.2. Multiquery Aggregation in Sensor Databases. In order to
provide efficient data services for sensor network
applica-tions, an overlay-based query aggregation approach
includ-ing a query manager and an effective query aggregation
algorithm was presented in [16]. The query manager, located
at the base station, is mainly devoted to defining the global query aggregation plan, and the query aggregation algorithm is designed to aggregate and optimize queries issued by end-users. The corresponding protocols for query dissemination and data transmission are also included. Contrary to traditional query processing, in their framework, queries from applications cannot be directly forwarded to the network, but are collected and evaluated at the gateway, to be aggregated if possible according to zone merging rules. Only the merged queries are delivered to the access node in the network by an appropriate selection scheme using a query delivery overlay construction protocol. Finally the queried data would then be passed back from the access node to the gateway. However, their aggregation protocol is mainly based on region operation. As mentioned above, spatial- and attribute-based query aggregation (SAQA) was introduced
in [19], assuming that most queries are snap-shot queries.
Similar to above work, a kind of multiquery optimization
technique was also presented in [17], which supports
multi-ple users submitting both continuous and snapshot queries. The query optimizer groups queries from applications with the same aggregate operator and optimizes each group separately. All queries gathered during the previous epoch are sent to the network together for evaluation in the query preparation phase, and query answers are forwarded back to the gateway in the result propagation phase. The query preparation protocol and result propagation protocol are
also described. The effect of multiquery optimization in
sensor networks was discussed in [30] to study the benefit
of exploiting common subexpressions among these queries, with significant performance improvements. The author also presented a two-tier query framework for optimizing multiple queries to improve the service quality of the sensor
networks [18].
A related aspect in sensor networks is query rate. Support for multiple rates plays a significant role for the performance of sensor networks. If source nodes disseminate the data streams to users at the frequency that they request, the
result is very costly in terms of energy. A more efficient
framework to process multirate queries was proposed in [31],
where, the construction of a path-sharing routing tree was also discussed. Another related aspect is the query/storage techniques for sensor networks in real applications the
author in [32] describes an effective middleware that was
specifically designed for proactive urban monitoring and
exploits node mobility to opportunistically diffuse sensed
data summaries among neighboring vehicles and to create a low-cost index to query monitoring data. To make their works more persuasive, the related protocols were validated
and their effectiveness in terms of indexing completeness,
harvesting time, and overhead are demonstrated. To avoid the content redundancy and storage imbalance in distributed storage system, a cooperative storage solution for mobile
surveillance in vehicular sensor networks [33] called VStore
is presented in [34] to maximize the average lifetime of
sensory data in sensor networks.
We conclude this section by observing that there are two key ideas among these works: exploiting the common tasks among groups of queries and using proper routing algorithms to minimize the total system cost. As noted above, most of these solutions are unaware of query time duration and historical database. The former is useful to reduce query redundancy, while the latter contributes to energy saving. Therefore, this paper presents a generic query management scheme including query partitioning, common task optimization exploiting a historical database, and query result merging to further improve the performance.
3. Problem Definition
We consider a multihop sensor network with one gateway
node at the centre and L sensors distributed randomly
in a rectangular field. The gateway node receives queries from users and processes them by using its query manager component, then sends queries into the appropriate regions of the sensor network. Eventually sensors in the region may respond to one of the queries. In this paper, we assume that all the sensors have the same fixed transmission range and
the same minimum connectivity transmission range [35].
We consider a sensor network similar to the network model
used in [1,35], with the following assumptions
(i) There areLenergy constrained sensor nodes that are
distributed randomly in a rectangle-shaped region. The batteries cannot be changed after the sensors are deployed.
(ii) Each node, including the gateway node, can obtain its own location information.
(iii) There is no coverage hole in the sensor network and all the sensors can communicate with the gateway node through a routing protocol.
The goal of this study is to reduce the total number of queries and the energy consumption. Similar to prior work
in [16,17,19], we use the following definitions.
Definition 1 (Query Region). Query region R indicates the geographical area that the application is interested in. Without loss of generality, we assume query regions to be a union of rectangular shapes. A two-dimensional query region element is thus represented by a bounding box, for example, the minimum and maximum values of the
coordinates. For any query point, its coordinates (x,y)
should satisfyx ∈ [x1,x2] and y ∈ [y1,y2], wherex1 and
x2 are the minimum and maximum values on the x-axis
of the bounding box, and y1 andy2are the minimum and
Definition 2(Query Time Duration). Query time durationT is the duration of the query. For example, it is often needed to continuously report the temperature and humidity value
of the monitoring area fromt1tot2, soT = {t1tot2}. It is
noted that ifTis a time point, rather than a time duration, it
represents a snap-shot query.
For the query model in [16, 17, 19], the attribute
informationAand frequency information F are two other
important elements to be considered. The attribute infor-mation indicates the list of attributes that the application is interested in, and the period information is the inverse of the frequency at which the data should be reported. In this work we also consider the query identifier, defined as follows.
Definition 3(Query ID). Each query must have a query ID
denoted byID, which is the information used by the gateway
node to analyze and identify which user the query is from. After the query is injected into the sensor network from a gateway node, the corresponding information the user is interested in will be sent back by the routing protocol via the gateway node to the user, and throughout the process the query ID is its unique identifier. Furthermore, the query ID is also used by query partitioning, aggregation, and result merging.
Definition 4 (Query: Q). A query consists of five types of information: query ID, query region, query time, attribute information, and query period, so it can be denoted by a 5-tuple.
Q= ID,R,T,A,F, (1)
whereIDis query ID, seeDefinition 3,Ris Query Region, see
Definition 1,Tis Query Time, seeDefinition 2,Ais Attribute information, the list of attributes which the application is
interested in, andFis Query period, at which the attribute
information should be reported.
Example 1. User 1 wants to know the temperature and
humidity of regionsR1,R2, and R4fromt1tot2 every five
seconds.
So the queryq1can be represented as follows:
Q1=
User 2 is interested in the wind speed of regionsR2and
R3fromt3tot4every two seconds. So
For simplicity, the query ID is omitted in the rest of the paper, because it is usually related to the header information of a packet.
In order to produce better execution plans and improve query performance, performing complex analysis at the gateway side is essential and requires nontrivial partitioning
and aggregation operations over different attribute sets,
query time durations, and query regions.
Definition 5 (Attribute Partitioning). For each query Q =
R,T,A,F, the attribute setAcan be disjointly partitioned
Definition 6 (Query Region Partitioning). For each query
Q = R,T,A,F, the query region setRcan be disjointly
Definition 7(Query Time Partitioning). For each queryQ=
R,T,A,F, the query time setTcan be disjointly partitioned
Definition 8 (Query Partitioning). Given N queries: Q1,Q2,. . .,QN, the overall objective of query partitioning is to divide them into disjoint subqueries, in order to find the
common parts between them. EachQj can be partitioned
into a group of subqueries denoted by set {Qj1,Qj2,. . .,
QjKj}. Hence given a query set{Q1,Q2,. . .,QN}, the output
partition is also a set.
The overall objective of query aggregation is to reduce the overall energy consumption in both query transmission and data delivery by eliminating and merging queries whenever possible. So query aggregation can be divided into two steps: (1) finding the common subqueries; (2) Merging and recombination of these subqueries according to query ID, query region, query time, and query attributes.
Definition 9 (Query Aggregation). Given W partitioned
queries Q1,Q2,. . .,QW, through the aggregation
opera-tion set {Q1,Q2,. . .,QW} can be merged into another set
Query 2
Queryn User queries
Query collector
Query partitioning
Query aggregation Common task evaluation
History database
Sensor networks
Query result merging
User 1
User 2
Usern . . . .
. .
Users
Query evaluation Query 1
Query manager
N Y
Figure1: Query management framework.
represents the output of query aggregation. Motivated by
[16], we also define the + as the aggregation operator, that
is,Qi =Q1+Q2+· · ·+QW means thatQi(1≤i≤P) is
aggregated from the partitioned queriesQ1,Q2,. . .,QW .
4. Query Management Framework
In this section, we present our framework and a number of components for multiquery optimization at the gateway side. Our framework quantifies the performance impact of processing multiple queries with our query management
scheme. To perform an effective decision making to produce
a better query plan is vital in an energy-efficient query
management system, and the core of such system is a query management scheme and a historical database which stores historical query records and consolidated data from the sensor network, supporting complicated queries that return
interesting information [36]. The basic idea of the proposed
query optimization framework is to minimize the number of queries injected into the sensor network by querying the historical database and aggregating queries to improve the query processing performance.
Our energy-efficient framework for multiquery
opti-mization in sensor network is built upon a number of components, including query collector, query partitioning, common task evaluation, query aggregation, query result merging, and historical database, and the first five compo-nents are integrated into a query manager. Query collector
collects queries from different users within a given time
duration. The complex queries are partitioned into several subqueries by the query partitioning module. We evaluate these subqueries and recognize the common tasks between them in a centralized way through the process of common task evaluation. The process of query aggregation eliminates the duplicate common tasks of a collection of queries through merging and aggregating them according to query region, query attribute, query time duration, and query frequency. Query result merging collects the answers from
both the sensor network and the historical database, merges them according to the query ID, and sends them back to the users.
The historical database contains records of user queries and query results. These are often captured automatically by the system and may be manually complemented or annotated by the database manager after query answers are sent back to the query manager. A query record, as described in this paper, is one type of interaction history which specifically records user queries. It typically contains search queries, result sets, and relevant contextual information, such as user profiles, system settings, and statistics. By searching the historical database, full or partial query results may be obtained without sending these queries into the sensor network, thus saving energy and reducing network
traffic.
In order to eliminate the duplicated common tasks, when the gateway node receives queries from end-users to ask for sensor data they are interested in, the query manager collects and processes them first to produce an optimal query plan for a collection of queries. The processing of the initial queries is
as follows (SeeFigure 1).
Step 1. Query collector receives queries from the applications within a given time duration.
Step 2. Check all the collected queries. If a complex query is included, partition it into subqueries according to the query partitioning scheme, as described more in detail below.
subqueries between them; (3) if the historical query records partially meet the query requirements, the query is reduced to the part that cannot be answered by historical database
according toDefinition 7.
Step 4. The queries not answered by historical database are evaluated to exploit their common tasks.
Step 5. Aggregate these queries and eliminate the duplicated parts among them, and then produce an optimal query plan.
Step 6. Route the queries to the appropriate regions to achieve the query results.
Step 7. Query results from both the historical database and the sensor network are merged according to query ID, and forwarded to the end-users.
Step 8. In order to ensure the accuracy and reliability of the data stored in the historical database, only the elementary queries without aggregation, together with their data, are stored into the historical database.
The query manager translates the application queries to the format that sensor network understands. Generally, the outputs of the query manager are complex queries which may include several attributes, regions, frequencies,
or different time durations [16]. For each complex query,
the query manager calculates an access point of the queried region which is defined as the geometrical centre of the region in this paper. A heuristic routing protocol is also adopted by multihop transmission from the gateway node to the access point, by which the sensor node closest to the access point called access node receives the complex query, reroutes it to the other sensor nodes in the region. When data is sent back from the sensor nodes, the reverse process is used.
We can summarize the main features of the framework as follows:
(1) The system provides an energy efficient query
man-agement framework for sensor networks, which
allows their components to effectively cooperate with
others to manage and optimize the complex queries received from users.
(2) It uses a historical database, which makes full use of query records and their results. It is especially suitable for the applications with many queries and comparatively simple query answers.
5. Query Management Scheme
The query management scheme is designed to support the
framework described in Section 4. It includes schemes for
partitioning the initial queries according to time and region partitioning and aggregation rules, approximate processing, multirate processing, historical database query, and routing protocol.
5.1. Initial Query Partitioning. Query region, query time, and query attributes are three important components to be
considered when analyzing how different queries overlap in
terms of these three components. In the query framework that we discussed in this paper, the historical database is a vital part for the users to directly access the sensing data that they are interested in at the gateway side, without the need for the queries to be transmitted to the sensor networks. But the historical database only includes the data reported by a subset of past queries, since not all the sensing data are transmitted from the sensor network to the historical database in time or kept forever. Sometimes the historical database cannot fully answer one query, but some subqueries may be answered in terms of query regions, query time, and query attributes. In order to fully utilize the data in the historical database, we partition a collection of queries according to specific granularity. Another important aspect of query partitioning is that it is useful for the query manager to evaluate the common subqueries.
For example, one query asks for the temperature and
humidity value of regionR1,R2andR4fromt1tot2and from
t3tot4every five seconds, so it can be represented as follows:
Q= {R1,R2,R4},{t1tot2,t3tot4},{T&H}, 5s. (8)
Here, a step-by-step partitioning strategy is adapted (See
Table 1).
5.2. Region Aggregation and Approximate Processing. Query region is the most significant component in our framework, and it is the main criterion to select sensor nodes for query execution and data forwarding. Therefore, all the queries sent to the sensor networks should follow the regional priority rule, meaning that region overlap is the first and foremost criterion to decide about query merging. Other types of operations, including query time merging, attribute aggregation, and multirate query processing, are all based on the fact that these operations occur approximately in the same region. Otherwise, there is no advantage in aggregating the queries. The regional priority rule is also adopted even if we search the historical database to check the previous query record for one query. For instance, consider two queries
Q1= R1,{0 to 10},H, 2sandQ2 = R2,{0 to 10},H, 2s.
If their query regions are completely different, even though
the query time, attribute, and query frequency ofQ1are in
full accord with that of Q2, it is useless to merge the two
queries.
Adopting the main idea in [16] about query region
processing, we divide the rules of processing query region into two basic types: approximate region aggregation and overlapped region aggregation.
Consider two queries Q1 = R1,{4 to 20},H, 2s and
Q2 = R2,{0 to 10},H, 2s, if R1 andR2 satisfy R1 ⊂ R2,
sending out both queries to the sensor network would be
redundant as the result ofQ1can be inferred from that ofQ2.
So the rule of approximate region processing can be defined as follows (this case is also suitable for searching historical
Table1: Process of query partitioning.
Initial query Region partitioning Time partitioning Attribute partitioning
{R1,R2,R4},{t1tot2,t3tot4},{T&H}, 5s
R1,{t1 tot2,t3tot4},{T&H}, 5s
R1,{t1tot2},{T&H}, 5s R1,{t1tot2},T, 5s R1,{t1tot2},H, 5s R1,{t3tot4},{T&H}, 5s R1,{t3tot4},T, 5s R1,{t3tot4},H, 5s
R2,{t1 tot2,t3tot4},{T&H5s},
R2,{t1tot2},{T&H}, 5s R2,{t1 tot24},T, 5s R2,{t1tot2},H, 5s R2,{t3tot4},{T&H}, 5s R2,{t3tot4},T, 5s R2,{t3tot4},H, 5s
R4,{t1 tot2,t3tot4},{T&H}, 5s
R4,{t1tot2},{T&H}, 5s R4,{t1tot2},T, 5s R4,{t1tot2},H, 5s R4,{t3tot4},{T&H}, 5s R4,{t3tot4},T, 5s R4,{t3tot4},H, 5s
in the historical query record satisfyR1 ⊂ R2, the result of
Q1can be inferred from the historical query record.
If any two queries Qi = Ri,Ti,Ai,Fi and Qj =
Rj,Tj,Ai,Fi, are such thatRiandRjsatisfyRi ⊂Rj, then
they can be merged to
Qi+j=
Rj,
Ti,Tj ,Ai,Fi
. (9)
Like the rule of approximate region processing, the rule of region overlapped aggregation can be defined as follows.
If any two queries Qi = Ri,Ti,Ai,Fi and Qj =
Rj,Tj,Ai,Fi, are such thatRiandRjsatisfyRi∩Rj =Ri j
andSRi∩Rj/SRi∪Rj≥β, then the two queries can be merged to
Qi+j=
Ri j,
Ti,Tj ,Ai,Fi
. (10)
Here,β is a constant, 0 ≤ β ≤ 1, SRi∩Rj/SRi∪Rjis the
region overlapping degree, namely, the ratio between the
intersection and the union area ofRiandRj.
5.3. Multirate Query Processing. In a multirate query system, the sensor network serves multiple queries to send data at
different frequencies to users. The data sources disseminate
the data streams to the users at the frequencies they request. In order to reduce the amount of transmitted data, we can modify the data streams according to a multirate processing rule which is illustrated as follows.
For example, user 1 requests the data from all the nodes
in region R with period F1. At the same time, user 2
requests the data from all the nodes in the same region with
periodF2. Without loss of generality, we find an appropriate
time unit such that all frequencies can be represented as integers. Without aggregation, the gateway node initiates independently each data query by sending out a query request to the data sources; the query request is routed to the appropriate source nodes within the queried region, and the source nodes will start sending data back to the gateway node. However, this method is prone to produce redundant data transmission.
Querytimes of user 1 Querytimes of user 2
0 1 2 3 4 5 6 7 8 9 10 11 12
Redundant querytimes
Figure2: Example of multirate query.
LetFi(1≤i≤n) be the requested periods of all the user
queries to the same regionR. Then the aggregate periodFof
thesenqueries can be described by the next equation.
F=GCD(F1,F2,. . .,Fn), (11)
where the GCD (Greatest Common Divisor) function returns the greatest common divisor of one or more integers; for instance, if a sensor network is used for collecting the temperature of the environment, user 1 might need the temperature every 2 minutes, and user 2 might need the temperature every 3 minutes. Assuming that these two queries are issued at time 0, this will result in a multirate
query in the sensor network. Given thatF1=2, andF2=3,
F = GCD(F1,F2) = 1, a simplistic method would request
data at times 0,1,2, 3, 4, 5, 6, 7, 8, 9, 10, 11, 12, and so on, while it can be seen clearly that the data sent at time 1, 5, 7,11
are not needed (SeeFigure 2).
To avoid the redundant queries resulting by multirate processing, the query time interval is set by each user at one of several discrete values, according to the next equation.
F=2k(k=1, 2,. . .,i,. . .). (12)
For instance, if a sensor network is used for collecting the temperature of the environment, user 1 might need the newest temperature every 2 minutes, and user 2 might need the newest temperature every 4 minutes. Assuming that these two queries are issued at time 0, this will result in multirate
0 2 4 6 8 10 12 14 16 18 20 22 24 Querytimes of user 1 Querytimes of user 2
Figure3: Example for processing redundant data.
F=GCD(F1,F2)=2, demanding data at times 0, 2, 4, 6, 7,
8, 10,12,. . .(SeeFigure 3). Thus no redundant query time is
produced.
The choice of query time interval is based on two aspects: (1) each user selects a discrete time interval according to his requirement, based on the rate of change of the sensed quantity and the user’s required precision; (2) for any two time intervals, one is exactly divided by another, so no redundant query time is yielded, which therefore saves energy consumption in data transmission.
5.4. Time Partitioning and Aggregation Rules. Consider
the case where the gateway receives the query Q =
R,{0 to 10},H, 2s, that is, the user wants to know the
humidity value of region R from t1 = 0 to t2 = 10
every two seconds, while there is information about the
humidity value of region R from t1 = 0 to t2 = 4 only
every two seconds in the historical database. Hence we
partition the query in time, asQ1= R,{0 to 4},H, 2sand
Q2= R,{4 to 10},H, 2s, so that without sendingQ1to the
sensor networks, the queried information is available in the local historical database.
As we discussed in the query framework, the partitioned queries are not directly evaluated and aggregated, but used for direct search in the historical database to check whether there are historical query records that partially or fully satisfy each partitioned query.
Consider another case where the gateway nodes receives
two queries Q1 = R,{0 to 10},H, 2s and Q2 =
R,{6 to 20},H, 2sfrom two different users. There exists a
common time interval {6 to 10}between the two queries.
Therefore, the common query time interval can be found by partitioning these two queries as follows:
Q1= R,{0 to 10},H, 2s
Query time aggregation only occurs in the sub-query
evalu-ation process, if any two different queries have a common
time interval and have the same query region and query attributes. In our query management scheme, the rules of time partitioning are designed to follow exactly these two cases.
5.5. Search of Historical Database. One of the most
impor-tant components of the framework illustrated in Figure 1
is the historical database. Storage techniques for query processing in sensor networks can be divided into two categories, one storage method is to send raw data of sensors to the gateway through a network routing tree rooted at the gateway node. Another possible storage approach is local storage, for example, sensors collect and store data local. When queries are injected from gateway node, sensors
send back their reply [37]. However, two traditional storage
techniques mentioned above cannot be directly applied to
the scenario of energy effective multiple similar queries. The
first method is more costly because energy is needed for sending data to the gateway where it may never be used, while the second method does not insert query records into historical database. Therefore, in this paper, in order to ensure the accuracy and reliability of the data stored in the historical database, only the elementary queries without aggregation, together with their answering data, are stored into the historical database, when a partitioned query arrives, the historical database is checked to see if the query had been executed previously, by searching the historical database, full or partial query results may be obtained without sending these queries into the sensor network, which is helpful to energy saving and data accuracy.
The motivation of storing historical data is to support historical data queries for various applications and most of existing approaches to historical data storage of sensor
networks are distributed [38]. The proposed storage
mech-anisms are mainly focused on local storage of historical data. Therefore, in this paper, we propose a centralized storage method that stores historical query and their answers at the
gateway side, which makes queries processing more efficient
in terms of energy consumption by using historical database. Since a query consists of five types of information as defined in Section 3, we also use it as the basic data format for the historical database. Thus, the query manager translates the user requirements and their answers into the format according to query definition. For instance, one query asks
for the temperature of regionR1fromt1tot2every 2 seconds,
Q1 = R1,{t1 to t2},T, 2s, and R1 can be represented by
two zones [0,20] and [0,10], which means that for any point
(x,y)∈R1satisfies 0≤x≤20 and 0≤y≤10,t1=2,t2 =
10. Assumed that three sensors (node 1, node 4, and node 10) in this region, for each sensor, the location information and the temperature value at time 2, 4, 6, 8, 10 should be sent back to the gateway node. After the gateway node receive the
answers forQ1, it creates a storage index forQ1based on the
received data asFigure 4shows. Clearly, queryQ1and their
answers are stored in the historical database.
We compare each partitioned query with each recorded query, only if the query region, query attribute, query time
duration, and query frequency satisfyRi⊂Rj,Vi=Vj,Fi≥
Fj andTi∩Tj=/φ, that is, if full or partial results can be
obtained from historical database. The algorithm is as follows inAlgorithm 1.
As for the partial query result, consider the case where
the gateway receives the query Q = Ri,{0 to 10},H, 2s,
Input: a simple query and a historical query record set withnqueries.
Output: initial simple query or partial query results and sub-query or query results Begin // compare the initial query with historical query record
// (the initial queryQi= Ri,Vi,Ti,Fiand any historical query // recordQj= Rj,Vj,Tj,Fjuse the same query model.) ifRi⊂RjandVi=VjandFi≥Fj
ifTi∩Tj=/φ
ifTi⊂Tj,Qioutput full results, else output partial results
Qi= Ri,Vi,Ti−Ti∩Tj,Fi
else
Qi= Ri,Vi,Ti,Fi
end if else
Qi= Ri,Vi,Ti,Fi
end if
Algorithm1: Query historical database.
Node 1 Node 4 Node 10
t=2
t=4
t=6
t=8
t=10
25.1
25.1 25.1 25.1
25.1 25.1
25.1 25.2
25.2
25.2
25.2
25.2 25.3 25.3
25.3 Temperature value
T= {2 to 10}
F=2s
regionR1[0, 20][0, 10]
Figure4: An example storage structure for historical queries.
Ri fromt1 = 0 tot2 = 10 every two seconds, while there
is information about the humidity value of regionRj from
t1 = 0 tot2 = 4 only every two seconds in the historical
database. Hence we partition the query in time, as Q1 =
R,{0 to 4},H, 2sandQ2 = R,{4 to 10},H, 2s, if Ri ⊂
Rjor Ri = Rj, so that without sending Q1 to the sensor
networks, the queried information is available in the local
historical database, thus, partial query result of Q can be
obtained.
5.6. Query Aggregation Scheme. The main idea of the pro-posed query aggregation scheme is to exploit and eliminate the duplicated common tasks of a collection of queries for minimizing the cost of processing multiple queries. However, a number of system considerations have to be taken into account to apply it to a real sensor network. In this section, we develop a multiquery optimization scheme for these
queries according to query region, query attribute, query time interval, and query period.
The input of the query aggregation scheme is a set of
partitioned queries Q from users, each partitioned query
Qi ∈ Q is denoted by Ri,Vi,Ti,Fi, where Ri represents
the query region,Virepresents the query attribute,Tiis the
query time interval, andFi is the query period. It is noted
that these partitioned queries has been compared with each recorded query stored in the historical database, only those queries cannot be answered by the historical query records have to be evaluated with other queries to find common subqueries between them by our proposed query aggregation scheme. The output of the query aggregation scheme is
another set of queries Q where each queryQi ∈ Q(1 ≤
i ≤ M)(M ≤ N) is denoted byRi,Vi,Ti,Fi, where
Rirepresents the combined region,Virepresents the query
attribute set, Ti is the new query time interval, and Fi is
the query period determined from several initial queries.
According to Definition 9 and the region aggregation and
approximate processing rules, Qis approximately equal to
Qin that the rules of approximate region aggregation and
overlapped region aggregation are applied to our query aggregation scheme.
The operatorQuerAggregation() is used to perform the
aggregation function, which is the main idea of the proposed query aggregation scheme to exploit and reduce the common
tasks among groups of queriesQ, then recombine them into
another set of queries Q. For any two partitioned queries
QiandQj in Q,QuerAggregation() offers the algorithm to
mergeQiandQj into one to perform optimization if these
two queries satisfy all of the next 4 conditions. First, if Ri
ofQi andRj of Qj can be overlapped, that is,Ri∩Rj=/ φ
andRi∩Rj=Ri j, meanwhile, the region overlapping degree
of Ri and Rj satisfy SRi∩Rj/SRi∪Rj ≥ β, which means that
only those queries asking for information of the approximate same region may possibly be merged into one and the
aggregated region isRi j. Second, if two partitioned queries
ask for the same or different attribute information of the
approximate same region, they can be possibly merged into
Input: A set of partitioned queriesQfrom users, each partitioned queryQi∈Qis denoted by
Ri,Vi,Ti,Fi, whereRirepresents the query region,Virepresents the query attribute,Tiis the query time interval andFiis the query period.
Output: A set of queriesQwhere each queryQ
i∈Q(1≤i≤M)(M≤N) is denoted by
Ri,Vi,Ti,Fi, whereRirepresents the combined region,Virepresents the query attribute set,
Tiis the new query time interval andFiis the query period determined from several initial queries. Begin:
fori=1 toN−1 forj=i+ 1 toN
(Qi,Qj)=QueryAggregation(Qi,Qj) // for any two queries, aggregate them according to
Ri,Vi,Ti,Fi
end for end for
//description of query aggregation scheme (Qi,Qj)=QueryAggregation(Qi,Qj) for any two initial queries
Algorithm (Qi,Qj)=QueryAggregation(Qi,Qj) Input:Qi= Ri,Vi,Ti,FiandQj= Rj,Vj,Tj,Fj Output:Qi= Ri,Vi,Ti,FiandQj= Rj,Vj,Tj,Fj Begin:
ifRi∩Rj=φ/ andSRi∩Rj/SRi∪Rj ≥β ifVi=Vj
Tj=Ti∪Tj
Vj =Vi=Vj
Fj=GCD(Fi,Fj) // Multirate processing
Rj=Ri∩Rj
Qi=φ;Qj= Rj,Vj,Tj,Fj// Merging two queries into one else //Vi=V/ j
ifTi=Tj
Tj=Ti=Tj
Vj =
Fj=GCD(Fi,Fj) // Multirate processing
Rj=Ri∩Rj
Qi=φ;Qj= Rj,Vj,Tj,Fj// Merging two queries into one else //Ti=T/ j
Qi= Ri,Vi,Ti,Fi
Qj= Rj,Vj,Tj,Fj
end if end if else //Ri∩Rj=φ
Qi= Ri,Vi,Ti,Fi
Qj= Rj,Vj,Tj,Fj
end if
Algorithm2: Query region, attribute, and time- and frequency-based query aggregation scheme.
is,Vi = Vj, the attribute in merged query isVi, otherwise,
the attribute in merged query is Vi ∪Vj, therefore, two
or more answers to different attributes information can be
obtained through forwarding only one combined query into the sensor network. Third, if two partitioned queries ask
for the same attribute information at the same or different
time interval of the approximate same region, and ifTi of
QiandTj ofQjare the same time interval, that is,Ti =Tj,
the time interval in merged query isTi, otherwise, the time
interval in merged query isTi∪Tj. Forth, if two partitioned
queries ask for the same attribute information at the same
or different time interval of the approximate same region
with different frequencies, and ifFiofQiandFjofQjsatisfy
the condition we set inSection 5.3, the frequency in merged
query is GCD(Fi,Fj).
The proposed query aggregation scheme is given in
Algorithm 2.
5.7. Routing Protocol. The process of query dissemination and data transmission is greatly influenced by energy considerations. Multihop routing will often consume less
energy than direct communication [39]. Here, we adopted
the main idea of GPSR (greedy perimeter stateless routing)
in this paper. GPSR [40] is a geographic routing protocol
that eliminates the need to maintain state information while performing routing, and assumes that every sensor node in the field knows the geographical location of its neighbors. In this paper, we also assume that sensors including the gateway node know the geographical location of all sensor nodes
Frame control
Sequence
number Commandtype
Command
payload FCS MAClayer
Preamble sequence
Start of frame delimiter
Frame/ length reserved
MHR MAC payload MFR
PSDU PHYlayer
PHY dependent 1
SHR PHR PHY payload
Octets: 2 1 4 to 20 1 n 2
Addressing fields
Auxiliary security
header
6+ (4 to 34) +n 0, 5, 6, 10, 14
Figure5: MAC command frame and the PHY packet.
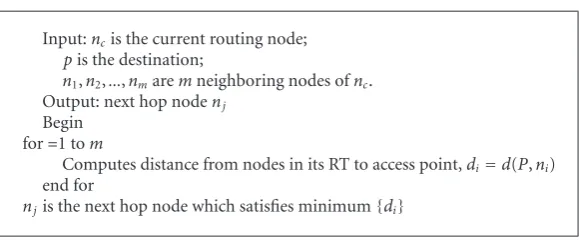
Input:ncis the current routing node;
pis the destination;
n1,n2,...,nmaremneighboring nodes ofnc. Output: next hop nodenj
Begin for=1 tom
Computes distance from nodes in its RT to access point,di=d(P,ni) end for
njis the next hop node which satisfies minimum{di}
Algorithm3: Next hop selection scheme within neighbours.
in this work is the reverse process of GPSR. Each node in sensor network maintains a RoutingTable (RT) which contains information about the nodes from which the node has heard directly, that is to say, the RT of one node maintains the information about all its neighboring nodes. When a packet arrives, for each hop between the gateway node and the access point, a node chooses its neighbor within radio range that is closest (in terms of geometric distance) to the access point as the next hop destination and forwards the message to it. When data is sent back from the sensor nodes, the reverse process applies.
After all the paths from the gateway node to each sensor node in the field are confirmed, the whole routing of the sensor network is build. In this approach, if a sensor node is selected to be the next potential routing node, but it has been in the routing path, it should go back to the last step and select another neighboring node inferior to routing node selected in last step. The purposes that we use GPSR-based routing scheme is to compare the total energy consumption with other query processing techniques, there are many routing protocols to handle both query packets and data packets, and they all performs better in energy consumption under our query management scheme in our previous study, we adopt GPSR-based routing scheme in this paper only because it is easy implemented.
6. Performance Evaluation
We first describe the assumed system settings and the energy model used to evaluate the proposed query management scheme, and then discuss the simulation results.
6.1. System Setting and Energy Model. In this section, we evaluate the performance of the proposed scheme via simulations. Unless otherwise specified, we assume that 200 sensor nodes are randomly scattered in a field with
dimensions 200×200 where the gateway node is located
at positionx=100, and y=100. We assume that the ratio
radius for the sensor nodes is 20 m. Every result shown is an
average of 25 experiments, each using a different randomly
generated position for each node. In addition, all the queries are randomly generated by a query generator.
To validate the performance of the proposed scheme, we consider a static and homogeneous sensor network. In our simulations, we calculate the query packet and data packet size according to the IEEE 802.15.4 standard, as shown in
Figure 5. The size of the preamble sequence is 4 bytes, the size of the start of frame delimiter is 1 byte, the size of the addressing field is 4 bytes and the size of the auxiliary security header is 0 bytes. As a data delivery model, we simulate a query-driven sensor network in which sensor nodes report information only if a query occurs.
In our simulation, we utilize a simple model [1,16,42,
43] for radio hardware energy dissipation, where the energy
dissipation is mainly from transmitting and receiving data. The energy consumption of transmitting each k-bit packet is calculated as
Etx(k,d)=Eelec·k+Eamp·k·dα (14)
The energy consumption of receiving a k-bit packet is calculated as
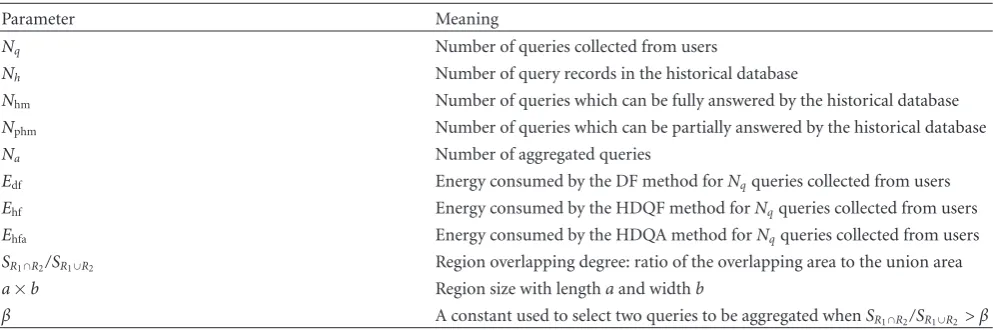
Table2: Simulation parameter settings.
Parameter Meaning
Nq Number of queries collected from users
Nh Number of query records in the historical database
Nhm Number of queries which can be fully answered by the historical database Nphm Number of queries which can be partially answered by the historical database Na Number of aggregated queries
Edf Energy consumed by the DF method forNqqueries collected from users
Ehf Energy consumed by the HDQF method forNqqueries collected from users
Ehfa Energy consumed by the HDQA method forNqqueries collected from users
SR1∩R2/SR1∪R2 Region overlapping degree: ratio of the overlapping area to the union area
a×b Region size with lengthaand widthb
β A constant used to select two queries to be aggregated whenSR1∩R2/SR1∪R2> β
where dis the message transmission distance between the
sender and receiver, k is the packet size, and α is a value
between 2 and 4; and in this paper,α=2,Eelec=50 nJ/bit,
Eamp=100 pJ/(bit∗m2).
The energy consumed for processing queries and sensing data is usually a very small portion of the total (in a common scenario, the energy consumed to process 100 million instructions is comparable to the energy required to transfer 10 bits of data). Therefore, we do not take it into consideration.
It is also important to note that the radio channel is symmetric, which means that the cost of transmitting a message from A to B is the same as the cost of transmitting a
message from B to A [44].
In order to analyze the performance of our query man-agement scheme, we compare the following query processing
approaches [19] with our historical database supported
query aggregation scheme (HDQA)
Direct forwarding (DF): in this approach, the gateway node just simply forwards queries to the sensor network without any aggregation.
Historical database supported query forwarding
(HDQF): In this approach, the gateway node acts as a centralized database system that for each query, searches the historical database first, then forwards it to the network.
In this paper, all the initial queries are produced by a Random Query Generator (RQG) that conforms to
Definition 4.
6.2. Simulation Results. We conduct four sets of experiments with the objective of evaluating the impact of the number of queries collected from users, the number of query records in historical database, and the ratio of the overlapping area to
the union area and the region size.Table 2summarizes the
simulation parameter settings for all the experiments. Before evaluating the impact of these parameters on the
proposed query management scheme, we obtainNhm,Nphm,
Na, Edf, Ehf, and Ehfa through 25 experiments using our
algorithm, with the following parameters setting:
Nq=50;Nh=500;β=0.3;a×b=20×10. (16)
The values of Ehf and Ehf obtained by the other two
methods and the improvement ofEhfaVSEhfandEhfaVSEdf
are also listed inTable 3. We ran each algorithm 25 times.
Table 3 summarizes the overall performance of the proposed algorithm. Notice that the energy consumption of HDQA is smaller than that of both DF and HDQF. HDQA reduces the energy consumption between 15% and 37% (26% on average) with respect to HDQF, and between 31% and 52% (42% on average) with respect to DF. The energy reduction comes from both historical query and
query aggregation; Table 3 also shows an average of 6.64
queries which can be fully answered by historical database, an average of 7.84 queries which can be partially answered by historical database and an average of 7.44 aggregated queries.
However, the variance of the values of Nhm,Nphm, and Na
obtained from our algorithm is high, because the initial queries and the historical query records are all randomly generated.
6.2.1. Impact of Query Number. By varying the number of queries collected from users, we can validate the impact of the query number on the performance of the proposed query system, and further control query redundancy and data reduction after aggregation. For example, a small number of queries have the less probability to be aggregated, while an extremely large number of queries has more redundancy among them, therefore, more aggregation will
occur. In this simulation, we fix Nh = 500, β = 0.3,
anda×b = 20×10. The query number Nq varies from
40 to 100.
Figure 6 compares the impact of Nq to Nhm, Nphm,
and Na using the proposed method. Observe that Nhm,
Nphm, and Na increase with Nq since more queries are
processed by thus query manager and thusNhm,Nphm, and
Na also increase. Moreover, the increase ofNhm,Nphm and
Na with Nq is nearly linear. Figure 7 compares the energy
consumption using the three approaches presented above.
Of course, energy consumption increases with Nq since
Table3: Comparison of the Energy consumption obtained by HDQA, DF, and HDQF.
No. Nhm Nphm Na Edf(MnJ) Ehf(MnJ) Ehfa(MnJ) ImprovementEhfaVSEhf(%) ImprovementEhfaVSEdf(%)
1 5 6 5 6676 5607 4489 20 33
2 12 6 9 6574 4602 3619 21 45
3 7 8 6 5769 4500 3404 24 41
4 9 9 10 6317 4612 3137 32 50
5 6 10 3 6074 4738 3836 19 37
6 10 12 8 6233 4114 3464 16 44
7 10 10 7 6756 4729 3855 18 43
8 4 7 10 7312 6215 4030 35 45
9 6 12 6 6877 5227 4022 23 42
10 3 6 13 6121 5387 3524 35 42
11 8 12 7 6724 4841 4043 16 40
12 8 3 7 6607 5352 3892 27 41
13 7 7 8 6251 4938 3295 33 47
14 4 6 7 7512 6310 4365 31 42
15 5 11 8 6231 4923 3461 30 44
16 6 3 6 5539 4708 3683 22 34
17 7 8 5 6245 4871 3293 32 47
18 6 8 8 6472 5177 3532 32 45
19 6 5 6 7259 6025 4540 25 37
20 4 7 5 6115 5197 4074 22 33
21 10 9 5 6392 4539 3661 19 43
22 7 11 11 7279 5168 3501 32 52
23 7 5 8 6548 5304 3718 30 43
24 2 6 7 6518 5866 4472 24 31
25 7 9 11 6809 5243 3257 38 52
40 50 60 70 80 90 100 2
4 6 8 10 12 14 16 18 20 22 24
Number of query collected from users
Nhm
Nphm
Na
N
umber
of
Nhm
,
Nphm
and
Na
Figure6: Impact ofNhonNhm,NphmandNphm,Na.
6.2.2. Impact of Historical Query Record. In this experiment, we first evaluate the impact of the number of historical query
records onNhm,NphmandNaobtained by our algorithm, and
40 50 60 70 80 90 100 Number of query collected from users 3000
4000 5000 6000 7000 8000 9000 10000 11000 12000 13000 14000
Energ
y
consumption
(M
nJ)
DF HDQF HDQA
Figure7: Energy sensitivity of total query.
then evaluate the total energy consumption by HDQA, DF,
and HDQF. Here, we fixNq=50,β=0.3, anda×b=20×10.
400 500 600 700 800 900 1000
Number of historical query record
Nhm
400 500 600 700 800 900 1000 Number of historical query record 3000
Figure9: Energy sensitivity of historical query record.
Table4: Setting query region size.
No. Region sizea×b
Nausing the proposed algorithm. We can observe thatNhm
andNphm increases with Nq, while Na decreases. This can
be explained by the following two reasons. First, with the
increase ofNh, each query has more probability to find full
or partial answers from the historical database, therefore
1 2 3 4 5
Figure11: Energy sensitivity of query region size.
Nhm andNphm increase with Nq. Second, queries with full
answer from historical database will not participate in the process of query aggregation, which reduces the number of queries that participate in query aggregation, even if those queries with partial answer from historical database will be partitioned into subqueries, which have less probability to be
aggregated with others. Thus,Nadecreases with the increase
ofNh.
Figure 9 compares energy consumption using HDQA, DF, and HDQF. Observe that energy consumption using
HDQA and HDQF decreases with the increase ofNh, since
more queries get answers from the historical database. The energy consumption using DF does not change with the
increase of Nh, because this method does not use the
0.2 0.25 0.3 0.35 0.4 0.45 0.5 0.55 0.6 0.65
Figure13: Energy sensitivity ofβ.
6.2.3. Impact of Region Size. In this analysis, we first evaluate
impact of region size onNhm,Nphm, andNaby our algorithm,
and then evaluate the total energy consumption by HDQA,
DF, and HDQF. In this experiment, we fixNq = 50,Nh =
500, andβ=0.3, The query region size is set asTable 4.
Figure 10illustrates the impact of region size on Nhm,
Nphm, and Na on our approach. By changing query region
size from 16×8 to 24×12,Nhm,Nphm, andNashow different
trends. Nhm andNphm decrease, while Na increases. Since
a strict limit is used for the query region in our historical database, the region of one query must be inside in the region of one record query in the historical database. Moreover, the region size of the record query is randomly generated
within a certain range. It is more difficult for a query with
larger region size to find full or partial answer than a query
with small region size. Thus,Nhm,Nphm decreases with the
increase of query region size. However, two queries with
larger query region size are prone to be aggregated, so Na
increases with the increase of query region size. Figure 11
shows the energy consumption by HDQA, DF, and HDQF
with the change of query region size from 16×8 to 24×12.
The energy consumed using DF and HDQA does not change
with the control of query region size. SinceNhm andNphm
decreases andNa increases with the change of query region
size, more energy is required by HDQF, and less energy is required to process queries by aggregation.
6.2.4. Impact of Region Overlapping Degree. The region overlapping degree is only used in the query aggregation phase, and it is possible for two queries to be aggregated
when SR1∩R2/SR1∪R2 > β, therefore, we only evaluate the
impact of β on Na. In this experiment, we fix Nq = 50,
Nh=500 and a×b=20×10,βis from 0.25 to 0.6.
It can be seen from Figure 12 that Na decreases with
the increase ofβ, because it becomes more difficult for two
queries to satisfy the aggregation condition with the increase
ofβ. Therefore,Nadecreases, while the energy consumption
increases (SeeFigure 13). Only an average of 2 queries are
aggregated whenβis 0.6 while an average of 7.5 queries are
aggregated whenβis 0.25.
6.2.5. Comparison with IQAF and SAQA. In order to further demonstrate our proposed scheme (HDQA), we compared the performance of our scheme with that of IQAF (IQAF: Integrated Query Aggregation-based Framework) and SAQA (SAQA: Spatial and Attribute Based Query Aggregation) by applying them to our query record and query set. IQAF is an overlay-based query aggregation approach including a query
manager and an effective query aggregation algorithm that
was presented in [16], and the main idea of the proposed
aggregation scheme is mainly based on region operation of user queries. SAQA is a region- and attribute-based query aggregation for sensor networks which was introduced
in [19]. Through the process of experiments, our routing
protocol was applied to IQAF and SAQA, meanwhile, both of these two approaches support our historical database query.
In this experiment, we first evaluate the total energy consumption and query latency by HDQA, IQAF, and SAQA under the impact of the number of queries from users, here,
we fix Nh = 500, β = 0.3 and a ×b = 20 ×10. The
query numberNqvaries from 40 to 100. Second, we evaluate
the total energy consumption and query latency by HDQA, IQAF, and SAQA under the impact of the number of query
record; here, we fixNq =50,β=0.3 and a×b=20×10.
The historical query recordNhvaries from 400 to 1000.
Figure 14 shows the data on the sensitivity of energy
performance for different query number. In this figure, the
x-axis represents the different query number, and y-axis
40 50 60 70 80 90 100
Number of queries fromusers
IQAF SAQA HDQA
Figure14: Energy sensitivity of total query.
0 Number of queries fromusers
IQAF
Figure15: Query latency sensitivity of total query.
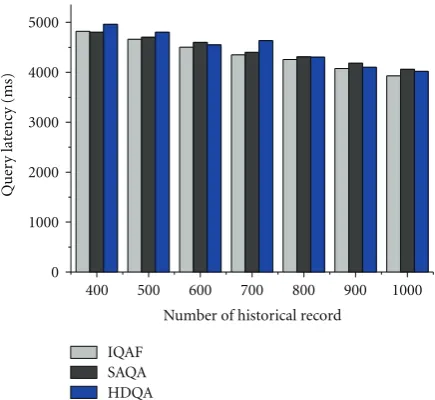
Figure 15 compares the query latency under different query number by HDQA, IQAF, and SAQA, it is noted that query latency here means the average elapsed time between a query being issued and results being received. In this figure,
the x-axis represents the different query number and y-axis
represents the query latency. As the query number increases, the query latency by three approaches also increases in that more aggregations are performed and less data and queries are issued in sensor networks. However, for any fixed query number, the query latencies caused by three approaches are almost equal because more time is used for aggregations by HDQA which simultaneously reduced the latency for data and query transmissions, while it reduces the aggregations time by IQAF which simultaneously increases the data and query delivery.
Figure 16evaluates the sensitivity of energy performance
for different historical query record by HDQA, IQAF, and
0
Number of historical record
400 500 600 700 800 900 1000
Figure16: Energy sensitivity of historical query record.
0
400 500 600 700 800 900 1000
Number of historical record
Figure17: Query latency sensitivity of historical query record.
SAQA. In this figure, the x-axis represents the different
historical query record and y-axis represents the total energy consumption. As the historical query record increases, the overall energy consumption by three approaches decreases. This is because more query answer can be obtained from historical database and less query/data transmissions are performed. Given a fixed number of user query, our HDQA performs better than the other two schemes in that HDQA performs more aggregation operations which contributes to energy saving.