International Journal of Nanomedicine
Biofunctionalization of a titanium surface with a
nano-sawtooth structure regulates the behavior
of rat bone marrow mesenchymal stem cells
Wenjie Zhang1,2
Zihui Li3
Yan Liu1,2
Dongxia Ye4
Jinhua Li3
Lianyi Xu1,2
Bin Wei1
Xiuli Zhang2
Xuanyong Liu3,*
Xinquan Jiang1,2,*
1Department of Prosthodontics, Ninth People’s Hospital Affiliated to Shanghai Jiao Tong University, School of Medicine, 2Oral Bioengineering Laboratory, Shanghai Research Institute of Stomatology, Ninth People’s Hospital Affiliated to Shanghai Jiao Tong University, School of Medicine, Shanghai Key Laboratory of Stomatology, 3State Key Laboratory of High Performance Ceramics and Superfine Microstructure, Shanghai Institute of Ceramics, Chinese Academy of Sciences, 4Shanghai Research Institute of Stomatology, Ninth People’s Hospital Affiliated to Shanghai Jiao Tong University, School of Medicine, Shanghai Key Laboratory of Stomatology, Shanghai, China
*Joint principal authors of this work
Correspondence: Xinquan Jiang Ninth People’s Hospital, Shanghai Jiaotong University School of Medicine, No 639 Zhi-zaoju Road, Shanghai, China, 200011 Tel +86 21 6313 5412
Fax +86 21 6313 6856 Email [email protected]
Xuanyong Liu
Shanghai Institute of Ceramics, Chinese Academy of Sciences, No 1295 Ding-xi Road, Shanghai, China, 200050 Tel +86 21 52412409
Fax +86 21 52412409 Email [email protected]
Background: The topography of an implant surface can serve as a powerful signaling cue for attached cells and can enhance the quality of osseointegration. A series of improved implant surfaces functionalized with nanoscale structures have been fabricated using various methods.
Methods: In this study, using an H2O2 process, we fabricated two size-controllable sawtooth-like nanostructures with different dimensions on a titanium surface. The effects of the two nano-sawtooth structures on rat bone marrow mesenchymal stem cells (BMMSCs) were evaluated without the addition of osteoinductive chemical factors.
Results: These new surface modifications did not adversely affect cell viability, and rat BMMSCs demonstrated a greater increase in proliferation ability on the surfaces of the nano-sawtooth structures than on a control plate. Furthermore, upregulated expression of osteogenic-related genes and proteins indicated that the nano-sawtooth structures promote osteoblastic differentiation of rat BMMSCs. Importantly, the large nano-sawtooth structure resulted in the greatest cell responses, including increased adhesion, proliferation, and differentiation.
Conclusion: The enhanced adhesion, proliferation, and osteogenic differentiation abilities of rat BMMSCs on the nano-sawtooth structures suggest the potential to induce improvements in bone-titanium integration in vivo. Our study reveals the key role played by the nano-sawtooth structures on a titanium surface for the fate of rat BMMSCs and provides insights into the study of stem cell-nanostructure relationships and the related design of improved biomedical implant surfaces.
Keywords: nanotechnology, surface modification, osteogenic differentiation, BMMSCs, implants, osseointegration
Introduction
Titanium and its alloys have been extensively used for endosseous implants because of their superior biocompatibility and excellent mechanical strength. In the osseointegration process, the formation of a direct interface between an endosseous implant and new bone produced by bone marrow mesenchymal stem cells (BMMSCs) is widely accepted in clinical implant medicine.1,2 Implant osseointegration, the critical
factor for success of an endosseous implant, can be investigated at both the histological and cellular levels. Many studies have concluded that certain characteristics of the implant surface play an important role in altering the quality of osseointegration.3,4 At
the cellular level, the ability of bone marrow mesenchymal stem cells to participate in both osteoid formation and the subsequent mineralization processes is intricately regulated by the surface features of the implant.5–7 When the implant is installed into
the bone, stem cells initially adhere to the implant surface, after which it becomes important to facilitate differentiation of those cells along the osteoblast line to
Dove
press
O R I g I N A L R E S E A R C H
open access to scientific and medical research
Open Access Full Text Article
International Journal of Nanomedicine downloaded from https://www.dovepress.com/ by 118.70.13.36 on 23-Aug-2020
For personal use only.
Number of times this article has been viewed
This article was published in the following Dove Press journal: International Journal of Nanomedicine
improve osseointegration.8,9 Because the topography of the
implant surface can serve as a powerful signaling cue for the attached cells, various approaches have been developed for fabrication of a series of improved implant surfaces, amongst which nanostructure designs have been of great interest, due to their favorable biofunctionalization.9,10
Nanostructures located on titanium and its alloys can be synthesized by various techniques, such as chemical treatment, plasma spraying,11 anodic oxidation,12 physical vapor
deposition,13 and chemical vapor deposition.14 Chemical
treatment is a simple and effective approach and has been widely used in recent years.15 For example, hydrogen peroxide
(H2O2) has been used to treat titanium implants to promote the deposition of apatite.16 Additionally, other studies have shown
that several nanoscale structures can be produced when the titanium surface is treated with H2O2 alone or synergistically under different conditions.17–19 In our experiments, we
prepared two size-controllable sawtooth-like nanostructures on titanium surfaces by incubation with H2O2 for different time periods as part of our continuous efforts to fabricate such surfaces. These fabricated nano-sawtooth structures represent two nanosurfaces with similar appearances but different dimensions. Interestingly, although these structures have different size ranges, the appearance of both sawtooth-like structures is analogous to the acid-etched cross-sectional layer of the tooth enamel, which is the hardest and most highly
mineralized substance in the human body.20,21
Just as niches provide complex chemical and topographical stimuli for living cells, topographies with different dimensions, ranging from the macroscale to the nanoscale, are involved in controlling cell behavior and function to mimic the stem cell niches.22,23 The fact that microscale topography affects
the adhesion, migration, proliferation, and differentiation of a large range of cell types has been well documented.24 More
recent research has shown a broad range of cell responses to
nanotopography.25–27 Nanostructures have recently become
of particular interest due to their advantageous high surface-to-volume ratio. These structures have the potential to elicit additional gratifying biological effects on stem cells.28
In addition, the nanostructure dimension may play an important role in dictating the fate of stem cells. A recent study revealed that the adhesion and differentiation abilities of BMMSCs on nanotubes can be altered solely by adjusting
the nanotube dimension.29 BMMSCs can differentiate into
various cell types, including osteoblasts.30 However, in
previous research, those differentiated cell lineages could also be achieved by applying various chemical differentiation factors, including dexamethasone or other growth factors,
such as bone morphogenetic proteins.31 However, at present,
it is valuable to know that topography alone can elicit such effects with sufficient proof.29 Oh et al noted that
the osteoinductive ability of nanotubes on BMMSCs was enhanced as the dimension was increased from 30 nm to 100 nm. However, the adhesion ability was observed to decrease following the dimensional changes. From this standpoint, there is no agreement that a small dimension (15 nm) is a superior length scale for cell differentiation in comparison with larger dimensions (70 nm and 100 nm).
This observation was put forth by von der Mark et al32 and
leaves room for clarification by successive experiments on the possible influence of different nanoscales.
In this work, the attachment, proliferation, and osteo-differentiation abilities of rat BMMSCs cells on two nano-sawtooth structures with different dimensions were evaluated without the addition of osteoinductive chemical factors. To our knowledge, it is the first report to evaluate the biofunctionalization of two sawtooth-like nanostructures on modified titanium surfaces. We hope that the results of this work will be a useful and significant reference for stem cell-nanostructure relationship studies and endosseous implant surface modification design.
Materials and methods
Preparation of nanotopography
on a titanium surface
Commercially available pure titanium plates (purity . 99.85%, Grade 1, Baoji Shi Shenghua Nonferrous Metal Materials Co, Ltd, Baoji City, Shaanxi Province, China) with dimensions of 10 × 10 × 1 mm or 23 × 23 × 1 mm (for apoptosis analysis and Western blot analysis, respectively) were ultrasonically cleaned in ethanol and deionized water, then pickled in a 5 wt% oxalic acid solution at 100°C for 2 hours.33 Using
this process, clean homogeneous and rough surfaces were obtained, and the pretreated samples were used as the control group in this experiment, denoted as the titanium sample in this work. The pretreated titanium plates were immersed in 5 mL of 30 wt% H2O2 in a reaction vessel with a Teflon
liner at 80°C for 6 hours and 24 hours, and denoted as the
Ti-6 and Ti-24 samples, respectively. Next, the hydrothermal products were gently rinsed with deionized water, dried in
an ambient atmosphere, and calcined at 450°C for one hour
to obtain the nanostructured titanium samples.
Surface characterization analysis
The surface morphologies and components of the samples were characterized by field emission scanning electron Dovepress
Zhang et al
International Journal of Nanomedicine downloaded from https://www.dovepress.com/ by 118.70.13.36 on 23-Aug-2020
microscopy (SEM, JEOL JSM-6700F, Japan) and thin-film x-ray diffractometry (Rigaku, D/max2500PC, Japan). An acceleration voltage of 10 kV was used in the field emission
SEM analysis, and a Cu Kα (k = 1.5406 Å) x-ray source was
used in the thin-film x-ray measurement. The scans were performed from 15° to 80° 2θ at 2° min−1 with a scanning
step of 0.02 and 2° glancing angles of the incident beam against the surface of the specimen. The surface elemental compositions of the samples were determined by x-ray photoelectron spectroscopy using a Physical Electronics PHI 5802 system with a monochromatic aluminum x-ray source and a 58.7 eV pass energy. The surface roughness of the films was quantified using atomic force microscopy (SPI3800N, Seiko, Japan). All measurements were collected in triplicate at different locations on each sample to ensure the validity of the data.
Contact angle measurement
The surface wettability of the samples was measured by contact angle measurements (Automatic Contact Angle Meter Model SL200B, Solon Information Technology Co, Ltd, Shanghai, China) conducted in an ambient environment using 2 µL of sessile distilled water droplets.
Surface zeta potential measurements
The surface zeta potentials of the samples were measured using a Surpass electrokinetic analyzer (Anton Parr, Graz, Austria) equipped with a special cell for membrane samples.
Samples with a size of 20 mm × 10 mm and a thickness of
less than 1 mm were fixed on the sample holders with double-sided adhesive tape. A 0.9% NaCl electrolyte solution was used as the medium, and the pH was set to approximately 7.0 for the measurements. The pH value was adjusted using hydrochloric acid and sodium hydroxide. In the streaming potential measurements, the electrolyte solution was forced (pumped) to flow along the solid surfaces, and the potentials resulting from the motion of ions in the diffusion layer were measured according to the Helmholtz-Smoluchowski equation:34
ζ = × η ε ε ×
dU
dP × 0 K,
where ζ is the zeta potential, dU/dP represents the slope of the streaming potential versus pressure, and η, ε0, ε, and K denote the electrolyte viscosity, vacuum permittivity, dielectric constant of the electrolyte, and conductivity, respectively. During the measurement process, the measurements for
the listed parameters were collected by the SurPASS control and evaluation software, and the obtained final zeta potential value resulted from automatic SurPASS control and evaluation software treatment with the appropriate parameters (η, ε0, ε, and K).
Culture and identification of BMMSCs
Six-week-old male Fisher 344 rats were obtained from the Ninth People’s Hospital Animal Center (Shanghai, China). The animal process protocols were approved by the animal research committee of the Ninth People’s Hospital Affiliated with Shanghai Jiao Tong University School of Medicine. Rat BMMSCs were isolated and cultured according to our previously published procedures.35 Briefly, both ends of rat
femurs were cut off at the epiphysis, and the marrow was quickly rinsed out with Dulbecco’s Modified Eagle’s medium (Gibco BRL, Gaithersburg, MD) supplemented with 10% fetal bovine serum (Hyclone, Logan UT), 100 U/mL streptomycin, 100 U/mL penicillin, and 200 U/mL heparin (Sigma,
St Louis, MO). Primary cells were cultured at 37°C in a 5%
CO2 atmosphere in Dulbecco’s Modified Eagle’s medium
supplemented with 10% fetal bovine serum, 100 U/mL streptomycin, and 100 U/mL of penicillin. Nonadherent cells were removed by changing the medium after 24 hours, and the culture medium was changed three times each week. When 80%–90% confluence was reached, the BMMSCs were subcultured into new dishes at a density of 1.0 × 10⁵ cells/mL
using trypsin-ethylenediamine tetra-acetic acid (EDTA, 0.25% w/v trypsin, 0.02% EDTA). The following experiments were carried out with 2–3 passages of cells.
Rat BMMSCs were identified for cell surface antigens CD90, CD105, CD31, and CD34 via flow cytometry assay as described previously.36 Cells adhered to the substrate
were detached with trypsin-EDTA and centrifuged at 350 g for 5 minutes. The cellular pellets were washed with phosphate-buffered saline, and 1.0 × 10⁶ cells were incubated
in a solution of CD105-PE (eBioscience, San Diego, CA), CD90-FITC (Invitrogen, Grand Island, NJ), CD31-PE (Becton Dickinson, Franklin Lakes, NJ) and CD34-PE (BD)
separately for 30 minutes at 37°C in the dark. The samples
were analyzed using FACS Calibur flow cytometry (Becton Dickinson). All of the isotype controls used in this experiment were purchased from Becton Dickinson.
Adhesion assay
For the adhesion ability assay, cells were seeded on the substrates in 24-well plates at a density of 5.0 × 10⁴ cells
per mL, and the nonadhered cells were removed by washing
Dovepress Titanium and bone marrow mesenchymal stem cells
International Journal of Nanomedicine downloaded from https://www.dovepress.com/ by 118.70.13.36 on 23-Aug-2020
three times with phosphate-buffered saline after 4 hours of culture. The remaining cells were fixed in 4% paraformalde-hyde for 30 minutes at 4°C and stained with 4′, 6-diamidino-2-phenylindole dihydrochloride (DAPI, Invitrogen) for 5 minutes at room temperature. The cell numbers in five
random fields of each sample at 200× magnification were
counted under a confocal laser scanning microscope.37,38
Cell viability assay
The cell viability on three different substrates was assessed using cell apoptosis and live/dead assays. For the apoptosis assay, 5.0 × 10⁴ cells per mL were seeded on the substrates
in 24-well plates. After 24 hours and 4 days of incubation, the cells on the substrates were washed twice with cold phosphate-buffered saline and collected in tubes. The cells were then subjected to a flow cytometry assay after staining with Annexin V-FITC (fluorescein isothiocyanate) for 3 minutes and mixing with propidium iodide for an additional 10 minutes (Annexin V-FITC kit, Becton Dickinson). The live/dead numbers were measured using a Live/Dead cell-mediated cytotoxicity kit (Invitrogen) according to the standard protocols. Briefly, 5.0 × 10⁴ cells per mL were
seeded on those substrates, and after three days of culture, DiOC18 staining solution was added into the complete culture medium, and the samples were incubated for another 24 hours. After rinsing with phosphate-buffered saline, a propidium iodide counterstaining solution was used to interact with the cells for 5 minutes. The percentage of viable cells was counted under the confocal laser scanning
microscope (Leica, Solms, Germany).39
Cell proliferation assay
For the cell proliferation assay, 2.0 × 10⁴ cells per mL were
initially plated on each sample in a 24-well plate. After one, 4, and 7 days of culture, the cells were gently rinsed once with phosphate-buffered saline and then fixed with 4% paraformaldehyde. Next, the nuclei were stained with DAPI,
and five random fields of each sample at 200× magnification were chosen to count the cell nuclei under the confocal laser scanning microscope. All experiments were performed in triplicate.
Real-time quantitative PCR analysis
The cells were cultured on the substrates in regular cell growth medium, and the total RNA was extracted using Trizol reagent (Invitrogen) at days 5 and 10. The RNA was dissolved in DEPC water (Sigma) and quantified with a Thermo Scientific NanoDrop™ 1000 ultraviolet-visible spec-trophotometer (NanoDrop Technologies, Wilmington, DE). One microgram of RNA was used to generate cDNA in a 20 µL standard reaction system using the PrimeScript 1st Strand cDNA Synthesis kit (TaKaRa, Shiga, Japan). Three
osteogenesis-related genes, including Runx2, osteopontin
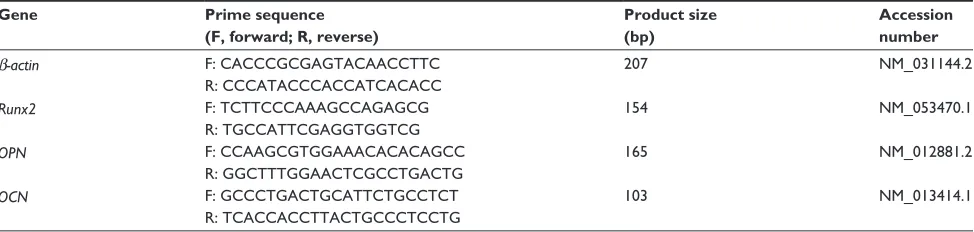
(OPN), and osteocalcin (OCN), were assayed via real-time polymerase chain reaction (PCR) techniques using a real-time PCR system (Bio-Rad). The gene expression levels were calculated by the ∆∆Ct method, and the results were expressed as transcript levels relative to the β-actin housekeeping gene. All assays were carried out in triplicate. The PCR primer sequences used in this project are listed in Table 1.
Osteopontin and osteocalcin protein
expression assay
For immunofluorescence analysis, the BMMSCs were fixed
with 4% paraformaldehyde at 4°C after culturing for 14 days
in Dulbecco’s Modified Eagle’s medium. The samples were permeabilized with 1% Triton X-100 for 30 minutes and blocked in 3% bovine serum albumin for one hour. Next, specific primary antibodies targeting rat osteocalcin (Abcam, Cambridge, MA) or rat osteopontin (Abcam) were added at 1:200 dilutions to the fixed cells and coincubated overnight at 4°C. Phycoerythrin fluorescent-labeled goat antimouse secondary antibody (Invitrogen) at 1:100 dilutions in blocking buffer was added for 30 minutes at room temperature in the dark.
Table 1 Primers for real-time polymerase chain reaction
Gene Prime sequence (F, forward; R, reverse)
Product size (bp)
Accession number β-actin
Runx2
OPN
OCN
F: CACCCgCgAgTACAACCTTC R: CCCATACCCACCATCACACC F: TCTTCCCAAAgCCAgAgCg R: TgCCATTCgAggTggTCg F: CCAAgCgTggAAACACACAgCC R: ggCTTTggAACTCgCCTgACTg F: gCCCTgACTgCATTCTgCCTCT R: TCACCACCTTACTgCCCTCCTg
207
154
165
103
NM_031144.2
NM_053470.1
NM_012881.2
NM_013414.1
Dovepress
Zhang et al
International Journal of Nanomedicine downloaded from https://www.dovepress.com/ by 118.70.13.36 on 23-Aug-2020
The cytoskeleton was stained with FITC-phalloidin, and the cellular nuclei were stained with DAPI. All of the specimens were examined using the Leica confocal laser scanning microscope. Western blot analysis was performed to detect the expression of osteopontin and osteocalcin proteins. Cells were seeded on 23 × 23 × 1 mm titanium specimens in 6-well plates and collected after 14 days of incubation. The total proteins were extracted using a Mammalian Cell Extraction Kit according to the manufacturer’s instructions (Biovision, Mountain View, CA). Twenty micrograms of proteins were separated by sodium dodecyl sulfate polyacrylamide gel electrophoresis and transferred to the nitrocellulose membranes. Nonspecific binding was blocked in Tris-buffered saline containing 5% skimmed milk and 0.05% Tween-20 for 2 hours at 37°C before the membranes were incubated with the primary antibodies at a 1:2000 dilution for β-actin (Abcam), 1:1000 dilution for osteopontin, and 1:1000 dilution
for osteocalcin, all overnight at 4°C. The membranes were
washed three times with Tris-buffered saline for 10 minutes each to remove unbound antibodies and then incubated with secondary antibodies diluted at 1:2000 in Tris-buffered saline for one hour at room temperature. Finally, the membranes were treated with chemiluminescence reagent (Thermo Fisher Scientific Inc, Waltham, MA) and exposed to Kodak x-ray film. The gray levels of all protein bands were quantified using Quantity One software (Bio-Rad, Hercules, CA), and the results were normalized to the β-actin levels.
Statistical analysis
The data were analyzed using SPSS version 14 (SPSS Inc, Chicago, IL) via one-way analysis of variance followed by the Student-Newman-Keuls post hoc test. The statistical analysis significance level was set to P, 0.05.
Results
Surface structure and composition
analysis of samples
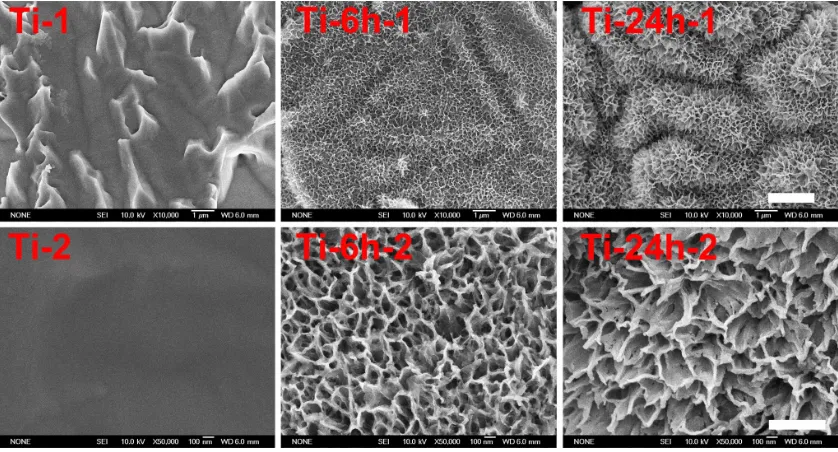
Figure 1 shows the surface views of a control sample (titanium) and the experimental group samples (Ti-6 and Ti-24). The homogeneous microscale rough structure of the control sample surface, as shown in Figure 1 (Ti-1), resulted from pickling via the oxalic acid solution. However, the surface of the titanium sample appears as a flat topography under higher magnification (Figure 1, Ti-2). Only the char-acteristic peaks of titanium were observed in the thin-film x-ray pattern of the titanium sample (Figure 2). After 6 hours of hydrothermal treatment and subsequent calcination, the surface of the titanium (Ti-6 sample) appears as a nano-scale sawtooth-like structure (Figure 1, Ti-6 h-1). Under higher magnification, the nano-sawtooth structures become entangled and form an interconnected network (Figure 1, Ti-6 h-2). The width of the nano-sawtooth is approximately 10 nm, with a gap distance between the nano-sawteeth of 100–200 nm. Figure 2 (Ti-6) shows that peaks corresponding to crystalline anatase and rutile are present at approximately
Figure 1 Scanning electron micrographs of three samples at different magnifications.
Notes: Upper panel (Ti-1, Ti-6 h-1 and Ti-24 h-1) displays at 10, 000x magnification. Lower panel (Ti-2, Ti-6 h-2 and Ti-24 h-2) displays at 50,000x magnification.
Abbreviations: Ti, control titanium surface; Ti-6 h, small size nano-sawtooth surface, treated with 30 wt% H2O2 for 6 hours; Ti-24 h, large size nano-sawtooth surface, treated with 30 wt% H2O2 for 24 hours.
Dovepress Titanium and bone marrow mesenchymal stem cells
International Journal of Nanomedicine downloaded from https://www.dovepress.com/ by 118.70.13.36 on 23-Aug-2020
25.2°, 48° and 27.5°, respectively, indicating that the nano-sawtooth structure on the surface of the Ti-6 sample is composed of crystalline titanium. Figures 1 (Ti-24 h-1) and 2 (Ti-24 h-2) indicate that the nano-sawtooth is approxi-mately 30 nm wide, while the gap distance between the nano-sawteeth increased to 200–300 nm after a hydrothermal treatment time up to 24 hours. The root mean square values for surface roughness and the surface area ratios of the titanium, Ti-6, and Ti-24 samples measured using atomic force microscopy are summarized in Table 2. The surface roughness and surface area ratio of the Ti-24 sample are higher than those of the Ti-6 sample. The thin-film x-ray pattern shown in Figure 2 suggests that there is no significant difference in the constituent composition between these two nanoscale structures. Figure 3 shows the x-ray photoelectron
spectra obtained from the surfaces of the titanium, Ti-6, and Ti-24 samples. From the results, it can be observed that only titanium and oxygen are detected on the surface of the titanium, Ti-6, and Ti-24 samples. The oxygen on the pure titanium sample comes from the natural oxide layer on its surface. The x-ray photoelectron spectroscopy results also
35000
30000
25000
20000
15000
10000
5000
60000
50000
40000
30000
20000
10000
0
60000
C B A
50000
40000
30000
20000
10000
1200 1000 800 600 400 200 0 1200 1000 800 600 400 200 0 1200
Ti O
O1
s
Ti2s Ti2p
O1
s
Ti2s
Ti2p
O1s
Ti2s
Ti2p
Ti
Ti O Ti
Ti O Ti
1000 800 600 400
Binding energy (eV)
Binding energy (eV)
Binding energy (eV)
Intensity [Arb]
Intensity [Arb]
Intensity [Arb]
200 0
0 0
Table 2 Atomic force microscopy surface parameters of Ti, Ti-6 h, and Ti-24 h
Ti Ti-6 h Ti-24 h
Ra (nm) 61.66 109.5 155.9
S ratio 1.00394 1.05649 1.86489
Abbreviations: Ti, control titanium surface; Ti-6 h, small size nano-sawtooth surface, treated with 30 wt% H2O2 for 6 hours; Ti-24 h, large size nano-sawtooth surface, treated with 30 wt% H2O2 for 24 hours.
10 20 30
A A: anatase
A AA A
T T: titanium
T
T
T T
T R
R: rutile
40 50
2-theta (degree)
Ti
Ti-6 h
Ti-24 h
60 70 80
Figure 2 X-ray diffraction patterns for three samples.
Note: Sample titanium shows only the characteristic peaks of titanium, while the Ti-6 h and Ti-24 h samples display characteristic peaks of anatase, rutile, and titanium. Abbreviations: Ti-6 h, small size nano-sawtooth surface, treated with 30 wt% H2O2 for 6 hours; Ti-24 h, large size nano-sawtooth surface, treated with 30 wt% H2O2 for 24 hours.
Figure 3 Full x-ray photoelectron spectra of titanium surfaces after H2O2 hydrothermal treatment for different times, ie, (A) Ti, (B) Ti-6 h, and (C) Ti-24 h. Abbreviations: Ti, control titanium surface; Ti-6 h, small size nano-sawtooth surface, treated with 30 wt% H2O2 for 6 hours; Ti-24 h, large size nano-sawtooth surface, treated with 30 wt% H2O2 for 24 hours.
Dovepress
Zhang et al
International Journal of Nanomedicine downloaded from https://www.dovepress.com/ by 118.70.13.36 on 23-Aug-2020
indicate that there are no obvious differences in the surface chemistry of the Ti-6 and Ti-24 samples.
Surface contact angle analysis
The contact angles of the titanium plate and hydrothermally treated samples are shown in Figure 4. It can be observed that the hydrothermal-treated samples exhibit superhydrophilicity compared with the control sample (titanium). In addition, the contact angles of the hydrothermally treated samples
gradually diminish from 19° to 0° with increasing
hydrothermal reaction time. This observed behavior can be ascribed to such sample surface properties as topography,
porosity, and roughness.40–42 Similar to the aforementioned
surface topography discussion (Figure 1), the surfaces of the hydrothermally treated samples corresponding to different reaction times were covered by a nano-sawtooth layer; however, the differences in the nano-sawtooth layers on the Ti-6 and Ti-24 samples lie in the gap distance between the nano-sawteeth, which plays an important role in changing the wettability of the hydrothermally treated samples. As shown in Figure 1, the gap distance of 100–200 nm between the nano-sawteeth for the Ti-6 sample is smaller than that of the Ti-24 (200–300 nm) sample. It can be concluded from this result that the porosity of the Ti-6 sample is higher than that of the Ti-24 sample, which is beneficial for increasing the contact angle of the sample.
Surface zeta potential analysis
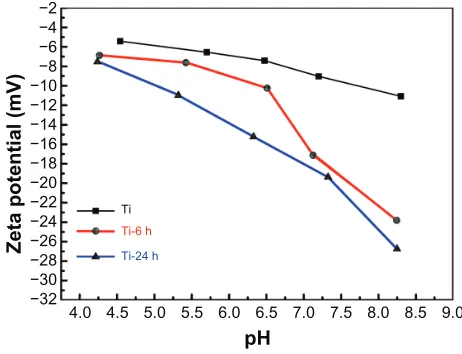
The zeta potentials were measured for titanium before and after hydrothermal treatment to investigate the surface properties. Figure 5 plots the zeta potentials versus pH values
Figure 4 Contact angle measurement.
Notes: The contact angles of titanium plate and hydrothermally treated samples are displayed. The hydrothermally treated samples exhibit superhydrophilicity compared with the control titanium sample.
0
Ti
Contact angle (degree)
Ti-6 h Ti-24 h
20 40 60 80 100 120
−2 −4 −6 −8 −10 −12 −14 −16 −18 −20
−22 Ti
Ti-6 h
Ti-24 h
−24 −26 −28 −30 −32
4.0 4.5 5.0 5.5 6.0 6.5 pH
Zeta potential (mV)
7.0 7.5 8.0 8.5 9.0
Figure 5 Surface zeta potential measurement.
Notes: The zeta potentials versus pH values for each individual sample are shown. All the curves show a descending trend with increasing pH. The zeta potentials become more negative in the order of pure Ti, Ti-6 h, and Ti-24 h at the same pH value.
Abbreviations: Ti, control titanium surface; Ti-6 h, small size nano-sawtooth surface, treated with 30 wt% H2O2 for 6 hours; Ti-24 h, large size nano-sawtooth surface, treated with 30 wt% H2O2 for 24 hours.
for each individual sample, and all of the curves show a descending trend with the increase in pH. Additionally, the zeta potentials become more negative in the order of pure titanium, Ti-6, and Ti-24 at the same pH value, which may be attributed to differences in surface topography. As the zeta potentials of the materials become more negative, the
corresponding materials surface becomes more hydrophilic.43
Further, the contact angles from the hydrothermally treated samples (Figure 4) are in agreement with the above result.
Isolation, culture, and identification
of rat BMMSCs
Clones of rat BMMSCs were observed on the fourth day after initial incubation (Figure 6A). Primary cells were subcultured at 80%–90% confluence, and the spindle-shaped cells after passage are shown in Figure 6B. Surface molecular markers of the expanded cells were examined by flow cytometry, and high expressions of CD90 (99.42%, Figure 6C) and CD105 (94.55%, Figure 6D) were observed, with only a small number of cells expressing the endothelial marker CD31 (2.17%, Figure 6E) and the hematopoietic marker CD34 (0.36%, Figure 6F).
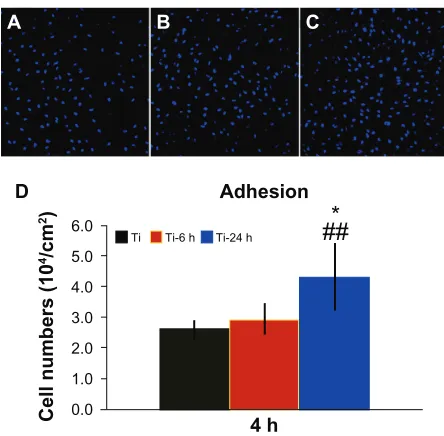
Adhesion ability of BMMSCs on different
surfaces
Figure 7 shows the cell adhesion ability results for the three samples. A greater number of cells remained attached to
Dovepress Titanium and bone marrow mesenchymal stem cells
International Journal of Nanomedicine downloaded from https://www.dovepress.com/ by 118.70.13.36 on 23-Aug-2020
100 101 102
FL2-H 10
3 104 100
0
20
40
60
Count
s 80
100
120
0
20
40
60
Counts
80
100
120
0
20
40
60
Count
s 80
100
120
0
20
40
60
Count
s 80
100
120
101 102
FL2-H 10
3 104
100 101 102
FL1-H
103
CD90 CD105
CD34 CD31
M1
M1 M1
M1
104 100 101 102
FL2-H
103 104
A B
C D
E F
Figure 6 Rat BMMSC culture and identification. A single cell clone is found on the fourth day of primary cell culture (A) and spindle-shaped cells are found after passage (B). Flow cytometry results show that BMMSCs are positive for CD90 and CD105, but negative for CD31 and CD34 (C–F).
Abbreviation: BMMSCs, bone marrow mesenchymal stem cells.
the large nano-sawtooth surface (Ti-24) after rinsing with phosphate-buffered saline, as shown in Figure 7A–C. Additionally, the quantitative data measured by counting of cellular nuclei demonstrate that there are significantly more adhesive cells on the large nano-sawtooth substrate than on
the small nano-sawtooth specimen (Ti-6, P, 0.05) or the
control titanium surface (P, 0.01, Figure 7D).
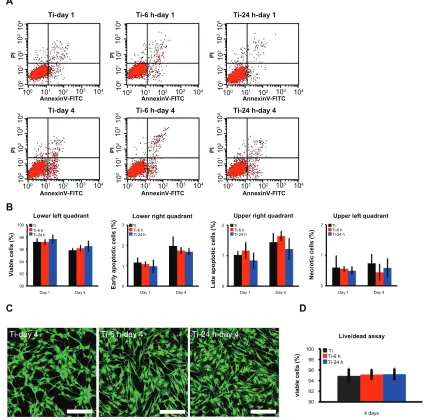
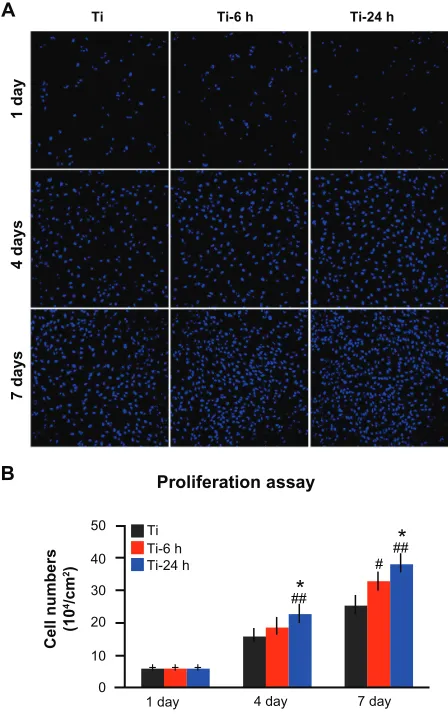
Cell viability and proliferation ability
on substrates
Annexin V-propidium iodide-based flow cytometry analysis indicated that there were no significant differences among
the percentages of viable cells, early apoptotic cells, late apoptotic cells, and necrotic cells after incubation on the three substrates for 24 hours and 4 days (Figure 8A and B). Those results were further confirmed by the live/ dead assay results, which revealed no obvious differences in the percentages of viable cells following culturing on the different substrates for 4 days (Figure 8C and D). The cell proliferation assay results, as measured by the nuclei counting method, are shown in Figure 9. There are no statistically significant differences observed among the three samples at day 1. However, at days 4 and 7, the cell numbers on the nano-sawtooth structures are significantly higher than those Dovepress
Zhang et al
International Journal of Nanomedicine downloaded from https://www.dovepress.com/ by 118.70.13.36 on 23-Aug-2020
A B C
0.0
4 h
Cell numbers (1
0
4/c
m
2)
Adhesion
1.0 2.0 3.0 4.0 5.0
Ti Ti-6 h Ti-24 h
6.0 D
*
##
Figure 7 Cell adhesion ability assay. Adhesion ability of BMMSCs was analyzed by counting stained nuclei with DAPI under a confocal laser scanning microscope after 4 hours of incubation. The upper panel shows CLSM images of BBMSCs on three substrates (A–C). Statistical results for adhesive cell numbers is shown in the lower panel (D).
Notes: ##P,0.01versus Ti control group; *P, 0.05 versus Ti-6 h group.
Abbreviations: DAPI, 4′, 6-diamidino-2-phenylindole dihydrochloride; Ti, control titanium surface; Ti-6 h, small size nano-sawtooth surface, treated with 30 wt% H2O2 for 6 hours; BMMSCs, bone marrow mesenchymal stem cells; CLSM, confocal laser scanning microscope.
on the control titanium surface. Moreover, the highest cell numbers are observed on the large nano-sawtooth structure (Ti-24) at both 4 and 7 days.
Osteogenic-related gene expressions
The ALP staining and alizarin red S staining results are shown in Figure 10A. According to the upper panel in Figure 10A, more pronounced ALP-positive areas are observed on the nanoscale structures than on the controls. Calcium deposition, as measured using alizarin red S staining, is shown in the lower panel. The matrix mineralization on the large nano-sawtooth substrate is higher than that on the two other structures.
Three selected osteogenic-related genes were analyzed using a real-time PCR quantitative technique, and the results are shown in Figure 10B–D. On the different samples, all four genes were upregulated from days 5 to 10, and the levels of expression of those genes are higher on the nanoscale substrate than on the control titanium surface at both 5 and 10 days. The large nano-sawtooth topography
displays the highest upregulation for Runx2, OPN, and
OCN gene expression over the three surfaces at both 5 and
10 days.
Osteogenic protein expression
To observe the expression of osteogenic-related proteins, rat BMMSCs cultured on the three substrates were terminated at 14 days, and the cells were stained for osteopontin and osteocalcin using an immunofluorescence method. As shown in the upper panel of Figure 11A, the expression of osteopontin on two nanoscale samples is stronger than that on the control sample, and the large nano-sawtooth group displays the strongest expression of osteopontin. In the lower panel, similar results are seen for osteocalcin. Western blot analysis was also performed to verify the expression levels of osteopontin and osteocalcin. As shown in Figure 11B, both the osteopontin and osteocalcin expression levels on the two nanoscale substrates are higher than those on the control plate, and cells cultured on the large nano-sawtooth topography express the highest level of the two proteins. The results shown in Figure 11C are
normalized to the internal β-actin control and, therefore,
the higher protein expression levels indicate that osteogenic ability of the cell is upregulated. In addition, a greater number of cells were observed on the nano-sawtooth structure with higher proliferation ability, and both the increased cell numbers and the upregulated cell osteogenic ability would have then contributed to stronger staining in the immunofluorescence results.
Discussion
In the current study, titanium was treated with H2O2, which is a relatively simple approach to prepare nanotopogra-phies on a titanium surface. Two size-controllable nano-sawtooth surfaces were fabricated with incubation times of 6 hours and 24 hours, respectively, and the surfaces were observed to share similar nano-sawtooth topographies with differences only in the dimension of the nanostructures. Moreover, the phase compositions and surface chemistry of the two nano-sawtooth structures were nearly identical. Thus, we were able to evaluate the effects of the two nano-sawtooth structures alone on rat BMMSCs without needing to add any osteoinductive factors.
BMMSCs are recognized as ideal seed cells for tissue engineering of bone. The proliferation and osteogenic differentiation abilities of BMMSCs play a key role in the
bone regeneration process,44 so adherence of BMMSCs
on an implant surface represents the initial step for full participation in osseointegration.9 In previous studies,
the adhesion, proliferation, and differentiation abilities of BMMSCs could be enhanced when seeded on certain nanoscale topographies.45–48
Dovepress Titanium and bone marrow mesenchymal stem cells
International Journal of Nanomedicine downloaded from https://www.dovepress.com/ by 118.70.13.36 on 23-Aug-2020
In this work, BMMSCs displayed higher adhesion activity on surfaces functionalized with a nano-sawtooth structure. First, sharp ridges in the nanoscale range are known to facilitate formation of focal adhesions due to high surface energy.29,49,50 Surface energy and roughness are closely related
to the wettability of the biomaterial surface, which is of
importance for adhesion activity.51 A hydrophilic titanium
surface with a high surface energy will thus display a small contact angle. Our results show that the large nano-sawtooth structure produced a smaller water contact angle compared
with the small nano-sawtooth structure. Accordingly, the large nano-sawtooth was observed to facilitate adhesion of BMMSCs. Additionally, the difference in the structures also changed the zeta potential of the sample surface, and the zeta potential may have controlled the charge interac-tions on the material surfaces. It has been reported that the higher the absolute value of the zeta potential of a surface, the higher the adsorption of serum proteins52 on that surface.
The large nano-sawtooth structure results in a higher absolute value for the zeta potential compared with that of the small
1010 0 101 102 103 104
0 10 1 10 2 10 3 10 4 10 0 10 1 10 2 10 3 10 4 10 0 10 1 10 2 10 3 10 4 10 0 10 1 10 2 10 3 10 4 10 0 10 1 10 2 10 3 10 4 10 0 10 1 10 2 10 3 10 4
100 101 102 103 104 100 101 102 103 104 100 101 102 103 104
100 101 102 103 104
100 101 102 103 104
100
Lower left quadrant AnnexinV-FITC
Ti-day 4 Ti-6 h-day 4 Ti-24 h-day 4 Ti-day 1
A
B
C D
Ti-6 h-day 1 Ti-24 h-day 1
AnnexinV-FITC AnnexinV-FITC
AnnexinV-FITC AnnexinV-FITC AnnexinV-FITC
Lower right quadrant Upper right quadrant Upper left quadrant
Live/dead assay 98 96 94 92 90 3 2 1 0 2 1 0 2 1 0 Day 1
Viable cells (%
)
Early apoptotic cells (%
)
Late apoptotic cells (%
)
Necrotic cells (%
)
viable cells (%
)
Day 4
Ti-day 4 Ti-6 h-day 4 Ti-24 h-day 4
Day 1 Day 4 Day 1 Day 4 Day 1 Day 4
4 days 100 Ti Ti-6 h Ti-24 h Ti Ti-6 h Ti-24 h Ti Ti-6 h Ti-24 h Ti Ti-6 h Ti-24 h Ti Ti-6 h Ti-24 h 98 96 94 92 90
PI PI PI
PI PI PI
Figure 8 Cell viability assay. (A) Cellular apoptosis on different substrates were measured by flow cytometry at one and 4 days after culturing. Lower left quadrant
represents viable cells, lower right quadrant represents cells at an early stage of apoptosis, upper right quadrant represents cells at a late stage of apoptosis, and upper left quadrant represents necrotic cells. (B) No statistically significant difference is found for apoptosis among the three groups at either time point. (C) After 4 days of culture, a live/dead assay was observed under the CLSM (scale bar, 200 µm), cytoplasm of viable cells is stained with green by DiOC18 and the nuclei of dead cells are stained with red by propidium iodide. (D) According to the statistical analysis of live/dead assay result, there are no statistically significant differences of the percentage of viable cells
among the three groups.
Abbreviation: CLSM, confocal laser scanning microscope.
Dovepress
Zhang et al
International Journal of Nanomedicine downloaded from https://www.dovepress.com/ by 118.70.13.36 on 23-Aug-2020
nano-sawtooth structure, which may also promote a higher level of serum protein adsorption. Thus, the enhanced adhe-sion of BMMSCs on the large nano-sawtooth structure may be due to its favorable conductivity for the facilitation of serum protein absorption when compared with that of the small nano-sawtooth.
We also tested the viability of BMMSCs on three samples, with no significant differences found among them. Nanotopographic modification did not result in a negative influence on the viability of cells. However, the nanostructures were able to stimulate cell proliferation activity. In this work, cells seeded on the large nano-sawtooth structure showed the highest proliferation activity. Both the initial numbers of attached cells and the adhesion activity of adhesive cells may have promoted the observed proliferation
activity. In addition, cell adhesion activity may be modulated by the nanotopography cues, and changes in adhesion activity might be linked to changes in cell differentiation.5,29,53
We compared the osteogenic differentiation ability of rat BMMSCs on different samples at both the mRNA and protein levels. Three osteogenic markers, Runx2, osteocalcin and osteopontin, were selected to analyze differentiation activities.35 Runx2 is an important transcription factor
necessary for osteoblast differentiation and is expressed in the early stages of osteogenic differentiation. Osteopontin is largely recognized as a mediate marker of osteogenic differentiation and is mainly associated with the relatively early stages of osteoblast maturation. Osteocalcin directly participates in the process of mineralization and is a late marker of osteogenic differentiation. Quantitative PCR results
showed that Runx2, OPN, and OCN were all upregulated
by modification of the nanoscale structures. The results from the protein expression analysis revealed that the
nano-sawtooth structures upregulated the expression of OPN
and OCN to a larger extent than the control titanium sample, and the cells on the large nano-sawtooth exhibited the highest expression among the three groups. Moreover, the calcium deposition analysis from the alizarin red S staining was in agreement with these results. Changes in the cell adhesion and differentiation activities remained consistent when responding to the nano-sawtooth cues. A likely explanation for this finding is that more contact locations between the cell and substrate were exposed when the cells were tightly adhered. Stimuli from the nanotopography and extracellular matrix were transmitted into the nucleus and resulted in expression changes in the osteogenic markers at both the gene and protein levels.
In this study, titanium pretreated with oxalic acid, the precursor used to prepare the two nano-sawtooth structures, was used as a control to evaluate the efficiency of the nanosurface modification. The bioactivity differences between the control group and nano-sawtooth samples are considered to be caused mainly by structural changes, although we cannot exclude the possibility of minor constituent differences. However, the two nano-sawtooth samples share a similar constituent, and the different biofunctionalization on these surfaces should be caused mainly by the size difference in the nanostructures.
Conclusion
Two size-controllable sawtooth-like nanostructures were produced on a titanium surface by incubation with H2O2 for different time periods. Rat BMMSCs demonstrated
50
A
B
Ti Ti-6 h Ti-24 h
Ti Ti-6 h Ti-24 h
1 day 4 day
Proliferation assay
7 days
4 day
s
1 day
*
##*
## #7 day 40
30
20
10
0
Cell numbers (10 4/c
m
2)
+ + +
Figure 9 Cell proliferation assay. (A) After one, 4, and 7 days of incubation, the proliferation ability of rat BMMSCs on different substrates was measured by a nuclei counting assay under CLSM. (B) Statistical analysis for nuclei counting assay. Notes: ##P,0.01 versus Ti control group; *P, 0.05 versus Ti-6 h group.
Abbreviations: Ti, control titanium surface; Ti-6 h, small size nano-sawtooth surface, treated with 30 wt% H2O2 for 6 hours; BMMSCs, bone marrow mesenchymal stem cells; CLSM, confocal laser scanning microscope.
Dovepress Titanium and bone marrow mesenchymal stem cells
International Journal of Nanomedicine downloaded from https://www.dovepress.com/ by 118.70.13.36 on 23-Aug-2020
Cytoskeleton OPN/OCN Nuclei
Ti
Ti Ti-6 h Ti-24 h
Ti-6 h
β-actin
OPN
OCN
Ti-24
h
OCN
OPN
Ti-6
h
Ti
Ti-24
h
Ti-6
h
Ti
OPN OCN
2.5
2
1.5
0.5
Normalized OPN/OCN relative
expression rati
o
0 1
Ti-24 h
A
B
C
Figure 11 Osteopontin and osteocalcin protein expression. (A) Upper panels show osteopontin immunofluorescence results for cells incubated on samples for 14 days and
lower panels show those for osteocalcin. green (actin cytoskeleton), blue (nuclei), red (osteopontin, osteocalcin) and yellow (merged color of green and red). (B) Protein expression of osteopontin and osteocalcin was detected by Western blot analysis. (C) gray levels of osteopontin and osteocalcin protein bands were normalized to the β-actin level.
70 Ti
Ti-6 h Ti-24 h
Ti Ti-6 h Ti-24 h
Ti Ti-6 h Ti-24 h 60
50 40 30 20 10 0
Day 5
Runx2
A
B C D
Alizarin
AL
P
OPN OCN
Ti Ti-6 h Ti-24 h
Relative transcript level
s
to
β
-actin (x1
0
−6)
Relative transcript level
s
to
β
-actin
Relative transcript level
s
to
β
-acti
n
Day 10
0.00 0.02 0.04 0.06 0.08 0.10 0.12 0.14 0.16
0.12 0.10 0.08 0.06 0.04 0.02 0.004 0.003 0.002 0.001 0.000 0.14 0.16
Day 5 Day 10
Day 5 Day 10
*
##
*
#
*
##
**##
**##
**##
##
## #
Figure 10 Cell differentiation assay. (A) After 14 days of culture on substrates, the cells were stained with ALP and alizarin red S. After 5 and 10 days of incubation on the substrates, total mRNA was extracted and expression of Runx2 (B), osteopontin (C), and osteocalcin (D) was measured by real-time polymerase chain reaction.
Notes: Results are expressed as relative transcript levels to β-actin (n = 3). #P, 0.05; ##P, 0.01 versus Ti control group; *P, 0.05; **P, 0.01 versus Ti-6 h group.
Dovepress
Zhang et al
International Journal of Nanomedicine downloaded from https://www.dovepress.com/ by 118.70.13.36 on 23-Aug-2020
enhanced proliferation and osteogenic differentiation abilities when cultured on the surfaces with the nano-sawtooth structure compared with the control surface. The large nano-sawtooth with a width of approximately 30 nm produced the largest cell responses, including adhesion, proliferation, and differentiation properties. The enhanced adhesion, proliferation, and osteogenic differentiation abilities of rat BMMSCs on the nano-sawtooth structures suggest the potential for induction of improved bone-titanium integration in vivo.
Acknowledgments
This work was jointly supported by the National Basic Research Program of China (973 Program, 2012CB933601, 2012CB933604), the National Natural Science Foundation of China (51071168, 30772431, 30973342), Science and Technology Commission of Shanghai Municipality (08410706400, 08JC1414400, 08JC1420800, 08DZ2271100, S30206, 10430710900, 10dz2211600) and Program for New Century Excellent Talents in University (NCET-08-0353).
Disclosure
The authors report no conflicts of interest in this work.
References
1. Xu B, Zhang J, Brewer E, et al. Osterix enhances BMSC-associated
osseointegration of implants. J Dent Res. 2009;88(11):1003–1007.
2. Branemark PI, Adell R, Breine U, Hansson BO, Lindstrom J, Ohlsson A. Intra-osseous anchorage of dental prostheses. I. Experimental studies.
Scand J Plast Reconstr Surg. 1969;3(2):81–100.
3. Cooper LF. Biologic determinants of bone formation for osseointegration:
clues for future clinical improvements. J Prosthet Dent. 1998;80(4):
439–449.
4. Nanci A, Wuest JD, Peru L, et al. Chemical modification of titanium
surfaces for covalent attachment of biological molecules. J Biomed
Mater Res. 1998;40(2):324–335.
5. Park J, Bauer S, von der Mark K, Schmuki P. Nanosize and vitality: TiO2
nanotube diameter directs cell fate. Nano Lett. 2007;7(6):1686–1691.
6. Lavenus S, Berreur M, Trichet V, et al. Adhesion and osteogenic differentiation of human mesenchymal stem cells on titanium nanopores.
Eur Cell Mater. 2011;22:84–96.
7. Sjostrom T, Dalby MJ, Hart A, Tare R, Oreffo RO, Su B. Fabrication of pillar-like titania nanostructures on titanium and their
interac-tions with human skeletal stem cells. Acta Biomater. 2009;5(5):
1433–1441.
8. Wang N, Li H, Lu W, et al. Effects of TiO2 nanotubes with different
diameters on gene expression and osseointegration of implants in
minipigs. Biomaterials. 2011;32(29):6900–6911.
9. Mendonca G, Mendonca DB, Aragao FJ, Cooper LF. Advancing dental
implant surface technology – from micron- to nanotopography.
Bioma-terials. 2008;29(28):3822–3835.
10. Webster TJ, Ahn ES. Nanostructured biomaterials for tissue engineering
bone. Adv Biochem Eng Biotechnol. 2007;103:275–308.
11. Wang H, Eliaz N, Xiang Z, Hsu HP, Spector M, Hobbs LW. Early bone apposition in vivo on plasma-sprayed and electrochemically
deposited hydroxyapatite coatings on titanium alloy. Biomaterials.
2006;27(23):4192–4203.
12. Li Y, Lee IS, Cui FZ, Choi SH. The biocompatibility of nanostructured
calcium phosphate coated on micro-arc oxidized titanium. Biomaterials.
2008;29(13):2025–2032.
13. Kunzler TP, Drobek T, Schuler M, Spencer ND. Systematic study of osteoblast and fibroblast response to roughness by means of
surface-morphology gradients. Biomaterials. 2007;28(13):2175–2182.
14. Brama M, Rhodes N, Hunt J, et al. Effect of titanium carbide coating
on the osseointegration response in vitro and in vivo. Biomaterials.
2007;28(4):595–608.
15. Shi GS, Ren LF, Wang LZ, Lin HS, Wang SB, Tong YQ. H2O2/HCl
and heat-treated Ti-6Al-4V stimulates pre-osteoblast proliferation and
differentiation. Oral Surg Oral Med Oral Pathol Oral Radiol Endod.
2009;108(3):368–375.
16. Pan J, Liao H, Leygraf C, Thierry D, Li J. Variation of oxide films on titanium induced by osteoblast-like cell culture and the influence of an
H2O2 pretreatment. J Biomed Mater Res. 1998;40(2):244–256.
17. Wang XX, Hayakawa S, Tsuru K, Osaka A. Bioactive titania-gel layers
formed by chemical treatment of Ti substrate with a H2O2/HCl solution.
Biomaterials. 2002;23(5):1353–1357.
18. Wu J, Zhang T, Zeng Y, Hayakawa S, Tsuru K, Osaka A. Large-scale preparation of ordered titania nanorods with enhanced photocatalytic
activity. Langmuir. 2005;21(15):6995–7002.
19. Liu X, Chu P, Ding C. Surface nano-functionalization of biomaterials. Available at: http://www.sciencedirect.com/science/article/pii/ S0927796X10000756. Accessed July 22, 2012.
20. Shinchi MJ, Soma K, Nakabayashi N. The effect of phosphoric acid concentration on resin tag length and bond strength of a photo-cured
resin to acid-etched enamel. Dent Mater. 2000;16(5):324–329.
21. Habelitz S, Marshall SJ, Marshall GW Jr, Balooch M. Mechanical
properties of human dental enamel on the nanometre scale. Arch Oral
Biol. 2001;46(2):173–183.
22. Wojciak-Stothard B, Curtis A, Monaghan W, MacDonald K, Wilkinson C. Guidance and activation of murine macrophages by nanometric scale
topography. Exp Cell Res. 1996;15;223(2):426–435.
23. Curtis A, Wilkinson C. Nantotechniques and approaches in biotechnology.
Trends Biotechnol. 2001;19(3):97–101.
24. Dalby MJ, Gadegaard N, Curtis AS, Oreffo RO. Nanotopographical
control of human osteoprogenitor differentiation. Curr Stem Cell Res
Ther. 2007;2(2):129–138.
25. Berry CC, Campbell G, Spadiccino A, Robertson M, Curtis AS. The influence of microscale topography on fibroblast attachment and
motility. Biomaterials. 2004;25(26):5781–5788.
26. Dalby MJ, Riehle MO, Johnstone HJ, Affrossman S, Curtis AS. Polymer-demixed nanotopography: control of fibroblast spreading and
prolifera-tion. Tissue Eng. 2002;8(6):1099–1108.
27. Kantawong F, Burgess KE, Jayawardena K, et al. Whole proteome analysis of osteoprogenitor differentiation induced by disordered
nanotopography and mediated by ERK signalling. Biomaterials. 2009;
30(27):4723–4731.
28. Ferreira L, Karp JM, Nobre L, Langer R. New opportunities: the use
of nanotechnologies to manipulate and track stem cells. Cell Stem Cell.
2008;3(2):136–146.
29. Oh S, Brammer KS, Li YS, et al. Stem cell fate dictated solely by
altered nanotube dimension. Proc Natl Acad Sci U S A. 2009;106(7):
2130–2135.
30. Pittenger MF, Mackay AM, Beck SC, et al. Multilineage potential
of adult human mesenchymal stem cells. Science. 1999;284(5411):
143–147.
31. Chrzanowski W, Neel EA, Armitage DA, Zhao X, Knowles JC, Salih V. In vitro studies on the influence of surface modification of Ni-Ti alloy
on human bone cells. J Biomed Mater Res A. 2009;93(4):1596–1608.
32. von der Mark K, Bauer S, Park J, Schmuki P. Another look at “stem cell
fate dictated solely by altered nanotube dimension”. Proc Natl Acad Sci
U S A. 2009;106(24):E60.
33. Wu Y, Long M, Cai W, et al. Preparation of photocatalytic anatase
nanowire films by in situ oxidation of titanium plate. Nanotechnology.
2009;20(18):185703.
Dovepress Titanium and bone marrow mesenchymal stem cells
International Journal of Nanomedicine downloaded from https://www.dovepress.com/ by 118.70.13.36 on 23-Aug-2020
International Journal of Nanomedicine
Publish your work in this journal
Submit your manuscript here: http://www.dovepress.com/international-journal-of-nanomedicine-journal
The International Journal of Nanomedicine is an international, peer-reviewed journal focusing on the application of nanotechnology in diagnostics, therapeutics, and drug delivery systems throughout the biomedical field. This journal is indexed on PubMed Central, MedLine, CAS, SciSearch®, Current Contents®/Clinical Medicine,
Journal Citation Reports/Science Edition, EMBase, Scopus and the Elsevier Bibliographic databases. The manuscript management system is completely online and includes a very quick and fair peer-review system, which is all easy to use. Visit http://www.dovepress.com/ testimonials.php to read real quotes from published authors. 34. Fairbrother F, Mastin H. CCCXII. Studies in electro-endosmosis. Part I.
J Chem Soc Trans. 1924;125:2319–2330.
35. Jiang X, Zhao J, Wang S, et al. Mandibular repair in rats with premineralized silk scaffolds and BMP-2-modif ied bMSCs.
Biomaterials. 2009;30(27):4522–4532.
36. Delorme B, Charbord P. Culture and characterization of human bone
marrow mesenchymal stem cells. Methods Mol Med. 2007;140:67–81.
37. Webster TJ, Ejiofor JU. Increased osteoblast adhesion on nanophase
metals: Ti, Ti6Al4V, and CoCrMo. Biomaterials. 2004;25(19):
4731–4739.
38. Zhao L, Mei S, Chu PK, Zhang Y, Wu Z. The influence of hierarchical hybrid micro/nano-textured titanium surface with titania nanotubes on
osteoblast functions. Biomaterials. 2010;31(19):5072–5082.
39. Aita H, Att W, Ueno T, et al. Ultraviolet light-mediated photofunc-tionalization of titanium to promote human mesenchymal stem cell
migration, attachment, proliferation and differentiation. Acta Biomater.
2009;5(8):3247–3257.
40. Barthlott W, Neinhuis C. Purity of the sacred lotus, or escape from
contamination in biological surfaces. Planta. 1997;202(1):1–8.
41. Banerjee D, Mukherjee S, Chattopadhyay K. Controlling the surface topology and hence the hydrophobicity of amorphous carbon thin films.
Carbon. 2010;48(4):1025–1031.
42. Gao X, Jiang L. Biophysics: water-repellent legs of water striders.
Nature. 2004;432(7013):36.
43. Khorasani M, Mirzadeh H. Effect of oxygen plasma treatment on
surface charge and wettability of PVC blood bag – in vitro assay. Rad
Phys Chem. 2007;76(6):1011–1016.
44. Sun H, Wu C, Dai K, Chang J, Tang T. Proliferation and osteoblastic differentiation of human bone marrow-derived stromal cells on
akermanite-bioactive ceramics. Biomaterials. 2006;27(33):5651–5657.
45. Popat KC, Leoni L, Grimes CA, Desai TA. Influence of engineered
titania nanotubular surfaces on bone cells. Biomaterials. 2007;28(21):
3188–3197.
46. Kaur G, Wang C, Sun J, Wang Q. The synergistic effects of multivalent ligand display and nanotopography on osteogenic differentiation of rat
bone marrow stem cells. Biomaterials. 2010;31(22):5813–5824.
47. Kaur G, Valarmathi MT, Potts JD, Wang Q. The promotion of osteoblastic differentiation of rat bone marrow stromal cells by a polyvalent plant
mosaic virus. Biomaterials. 2008;29(30):4074–4081.
48. Dalby MJ, McCloy D, Robertson M, et al. Osteoprogenitor response to
semi-ordered and random nanotopographies. Biomaterials. 2006;27(15):
2980–2987.
49. Luthen F, Lange R, Becker P, Rychly J, Beck U, Nebe JG. The influence of surface roughness of titanium on beta1- and beta3-integrin adhesion and the organization of fibronectin in human osteoblastic cells.
Biomaterials. 2005;26(15):2423–2440.
50. Diener A, Nebe B, Luthen F, et al. Control of focal adhesion
dynam-ics by material surface characteristdynam-ics. Biomaterials. 2005;26(4):
383–392.
51. Johnson K, Kendall K, Roberts A. Surface energy and the contact of
elastic solids. Proc R Soc Lond A. 1971;324(1558):301.
52. Cai K, Frant M, Bossert J, Hildebrand G, Liefeith K, Jandt KD. Surface functionalized titanium thin films: zeta-potential, protein adsorption and
cell proliferation. Colloids Surf B Biointerfaces. 2006;50(1):1–8.
53. Guilak F, Cohen DM, Estes BT, Gimble JM, Liedtke W, Chen CS. Control of stem cell fate by physical interactions with the extracellular
matrix. Cell Stem Cell. 2009;5(1):17–26.
Dovepress
Dove
press
Zhang et al
International Journal of Nanomedicine downloaded from https://www.dovepress.com/ by 118.70.13.36 on 23-Aug-2020