Copyright1998 by the Genetics Society of America
A New Approach to the Problem of Multiple Comparisons in the
Genetic Dissection of Complex Traits
Joel Ira Weller,* Jiu Zhou Song,* David W. Heyen,
†Harris A. Lewin
†and Micha Ron*
*Institute of Animal Sciences, Agricultural Research Organization, the Volcani Center, Bet Dagan 50250, Israel and †Laboratory of Immunogenetics, Department of Animal Sciences, University of Illinois, Urbana, Illinois 61801
Manuscript received June 1, 1998 Accepted for publication September 11, 1998
ABSTRACT
Saturated genetic marker maps are being used to map individual genes affecting quantitative traits. Controlling the “experimentwise” type-I error severely lowers power to detect segregating loci. For prelimi-nary genome scans, we propose controlling the “false discovery rate,” that is, the expected proportion of true null hypotheses within the class of rejected null hypotheses. Examples are given based on a granddaugh-ter design analysis of dairy cattle and simulated backcross populations. By controlling the false discovery rate, power to detect true effects is not dependent on the number of tests performed. If no detectable genes are segregating, controlling the false discovery rate is equivalent to controlling the experimentwise error rate. If quantitative loci are segregating in the population, statistical power is increased as compared to control of the experimentwise type-I error. The difference between the two criteria increases with the increase in the number of false null hypotheses. The false discovery rate can be controlled at the same level whether the complete genome or only part of it has been analyzed. Additional levels of contrasts, such as multiple traits or pedigrees, can be handled without the necessity of a proportional decrease in the critical test probability.
M
ANY studies have demonstrated that individual segments are tested, several null hypotheses will meet these rejection criteria by chance (Lander andBot-loci affecting quantitative traits (QTL) can be
detected via linkage to genetic markers (Sax 1923; stein 1989;Landerand Kruglyak1995). The tradi-tional approach to dealing with multiple comparisons
Lander and Botstein 1989; Georges et al. 1995;
LanderandKruglyak1995;Weller1996). Tradition- has been to control the “familywise (or experimentwise) error rate” (FWER), instead of controlling the “compari-ally, application of these techniques was limited by the
paucity of segregating genetic markers in most species sonwise error rate” (CWER). The FWER is controlled by setting the rejection threshold sufficiently strictly so of economic interest. In the last decade this problem
has been solved by the development of new classes of that the probability that any of the null hypotheses tested are erroneously rejected is below a specified low level, highly polymorphic DNA-level genetic markers, such as
microsatellites. Moderate- to high-density genetic maps usually 0.05 (LanderandBotstein1989;Landerand
Kruglyak1995). A demanding threshold for hypothe-have been developed for a wide range of species
sis rejection will result in the “acceptance” of many false (LanderandKruglyak1995;Weller1996), and it is
null hypotheses, and many true effects will not be de-now possible to rapidly scan a complete genome for
tected. As noted previously, determination of the appro-genes affecting any trait of interest.
priate rejection threshold is a choice “between Scylla Most studies have used either maximum likelihood or
and Charybdis” (LanderandKruglyak1995). regression models to test for segregating QTL (Simpson
Among multiple comparison situations, determina-1989;HaleyandKnott1992;MartinezandCurnow
tion of rejection thresholds for QTL detection is espe-1992). Generally, a likelihood ratio or a t or F statistic
cially problematic. First, a putative QTL could lie any-is computed for each marker or pair of markers on the
where along the genetic map. Thus, the possible basis of the null hypothesis that no segregating loci
number of “sites” (hypotheses) tested is virtually unlim-affecting the trait of interest are linked to the genetic
ited. On the other hand, all positions along a single markers. Ordinarily, a null hypothesis is rejected when
chromosome are genetically linked and therefore not the probability of the test statistic under the null
hypoth-statistically independent. Second, several correlated esis is below a predetermined level, generally either
traits are often analyzed using the same genotype infor-5 or 1%. However, if many markers or chromosomal
mation (Welleret al. 1997). Should multiple traits be
analyzed jointly or separately? And how should the criti-cal values for rejection be determined? Third, a number
Corresponding author: J. I. Weller, Institute of Animal Sciences,
of pedigrees are often included in the analysis. Should
A.R.O., The Volcani Center, P.O. Box 6, Bet Dagan 50250, Israel.
E-mail: [email protected] the individual pedigrees be analyzed jointly or
ling the “false discovery rate” (FDR) as an alternative
Botstein(1989) developed analytical formula for two
to controlling the FWER for the general problem of specific situations: a “dense” map and a “sparse” map.
multiple testing. They defined the FDR as: “The ex-In the latter case, it is assumed that the genetic markers
pected proportion of true null hypotheses within the are spaced far enough apart so that they can be
consid-class of rejected null hypotheses.” We will demonstrate ered to be independently assorted, while in the former
that controlling the FDR is more appropriate than con-case they are sufficiently close so that all “sites” along
trolling the FWER for multiple marker QTL detection. the chromosome are being tested for segregating QTL.
Derivation of rejection thresholds, based on controlling For a dense map scan of the human genome, a
compari-the FDR, and important properties of this method will sonwise probability of 231025is required to obtain an
be described. Examples from an actual QTL detection FWER of 0.05!
experiment that illustrate the advantages of controlling
ChurchillandDoerge(1994) proposed empirically
have been presented previously (Weller et al. 1997,
estimating FWER rejection thresholds by generating
1998). In the current study we have extended the analy-many different samples from the actual data by
“shuf-ses based on actual data and also present results from fling” the trait values with respect to the marker
geno-application of the method to simulated data sets. types. Because the trait value for each individual is now
random with respect to marker genotypes, the null
hy-pothesis of no linkage between the genetic markers and MATERIALS AND METHODS QTL is correct by design. The appropriate rejection
Definition and properties of the false discovery rate:Assume threshold for any desired type I error is then derived
that m, multiple comparisons, are tested. For each null hypoth-from the empirical distribution of the test statistic. This esis; H
1, H2, . . . , Hm, a test statistic and the corresponding method has the advantage of making no assumptions P-values, P1, P2, . . . , Pm, are computed. Let P(1)#P(2)#. . .#P(m)
be the ordered P-values and denote by H(i)the null hypothesis with respect to distributional properties of either the
corresponding to P(i). If all null hypotheses are true, but k quantitative traits or the genetic markers. Rejection
hypotheses, H(1)to H(k), are rejected, then the expectation of thresholds are computed on the basis of the actual
num-the number of hyponum-theses rejected should be approximately ber and genomic distribution of markers genotyped. equal to the actual number of hypotheses rejected for any Contrary toChurchillandDoerge(1994),Lander value of k. If, in fact, some of the null hypotheses are false, then the expectation of the number of hypotheses rejected and Kruglyak (1995) maintain that whole genome
should be ,k. That is, the number of hypotheses rejected thresholds should be used even if only a limited number
should be greater than the expectation under the null hypoth-of markers have been genotyped. Because hypoth-of the severity esis. The expectation of the number of hypotheses rejected, of whole genome FWER thresholds,LanderandKrug- assuming that all null hypotheses are true, is mP(k). Defining
q5mP(i)/i,BenjaminiandHochberg(1995) prove that the
lyak(1995) propose several classifications for
evaluat-FDR can be controlled at some level, q *, by determining the ing results. Suggestive linkage, the least restrictive
crite-largest i for which q *#mP(i)/i. That is, out of k hypotheses rion, is defined as “statistical evidence that would be rejected, it is expected that the proportion of erroneously expected to occur one time at random in a genome rejected hypotheses is no greater than q *. Illustrative examples scan.” This criterion is problematic for two reasons. and important properties of the FDR will be considered below. Analysis of actual data:In the “granddaughter design” sons First, if only a single null hypothesis is rejected by the
of sires heterozygous for genetic markers are genotyped, and criterion of suggestive linkage, there is no reason to
records of the granddaughters are compared to detect a segre-assume that a QTL has been located. One event of gating QTL (Welleret. al. 1990;Ronet al. 1994;Georgeset suggestive linkage is expected by chance! Second, the al. 1995). A total of 1555 sons of 18 U.S. grandsires were genotyped for 128 microsatellites. There was at least one null hypothesis of no segregating QTL throughout the
marker on all 29 autosomes. Each bull genotyped had at least genome is not realistic, as noted above. However, if many
10 daughters with milk records. The dependent variable was hypotheses are rejected by this criterion, then some, but the daughter-yield deviation of each sire, which is a weighted not all, should be due to segregating QTL. Although the mean of the daughter records corrected for fixed effects (
Figure1.—F-values for a simulated genome scan of backcross population. The simulated genome consisted of 10 chromosomes, each of 100 cM. Locations of the eight simulated QTL are denoted by arrows.
effect of the sire and paternal allele within sire, was used to a segregating QTL affecting the trait in question linked to the marker (Welleret. al. 1990).
analyze each marker for seven quantitative traits: milk, fat,
and protein production, fat and protein percentage, milk so- Even if a particular F-value was significant over all families, not all grandsires need be heterozygous for the linked QTL. matic cell score, and herd life. The total number of analyses
sites, as determined by the Haldane mapping function. loci affecting the quantitative trait were simulated at random Zero or one segregating QTL was simulated per chromo-throughout the genome. An effect of between 0.2 and 0.4 some. Locations of segregating QTL were determined by sam-residual standard deviations was simulated for each QTL. No pling from a uniform distribution corresponding to the chro-QTL were simulated on the remaining 6 chromosomes. FDR mosome length. QTL substitution effects were determined by results are presented in Figures 8, 9, and 10. sampling from a uniform distribution between 0 and 0.4. If
a value,0.2 residual standard deviations was obtained, then the substitution effect was set at 0. Thus, the expectation was for five segregating QTL per genome. The trait value for each heterozygous for each marker. A total of 1309 paternal allele
BC1individual was computed as the sum of its QTL effects contrasts were included in this analysis. Thus, in addition to
and a random residual computed by sampling from a normal multiple QTL sites along the genome there are the additional
distribution with a variance of unity. Presence of segregating levels of multiple traits and multiple families.
QTL was tested by a one-way ANOVA for each of the 110 Both the F- and t -test analyses were also performed on
per-markers in the genome. Because per-markers were linked, these muted data (Churchill and Doerge 1994). Within each
tests were not independent. Results are presented for two family, the seven trait values were permuted against the vector
typical simulated populations of 500 individuals each, with of genotypes. Therefore, the correlations among traits, the
eight and two segregating QTL, respectively. The distribution grandsire effects, and any linkages among markers were
main-of F-values by chromosome for the population with eight QTL tained, while relationships among markers and the trait values
is given in Figure 1. were randomized. The FDR was computed as described above.
Five simulated populations with four segregating QTL given The CWER was assumed equal to P(i), the probability of the
in Table 1 were also analyzed. In addition, five populations test statistic under the null hypotheses for comparison i. The
simulated with two QTL set to zero and five populations simu-FWER appropriate for each value of P(i), was computed as the
lated with all four QTL set to zero were also analyzed. The probability of rejecting at least one hypothesis, assuming a
110 tests of each set of five populations were ordered by P(i).
Poisson distribution for the number of rejected hypotheses
For each i the means of the five simulations were computed with an expectation of mP(i), where m is the total number of
for P(i), the FWER, q, and the true FDR (TFDR), computed as
tests.
the number of tests among all tests with probability,P(i)not Analysis of simulated data:Simulated data were generated
for a cross between two inbred lines assumed to differ in both genetically linked to a simulated QTL divided by i.
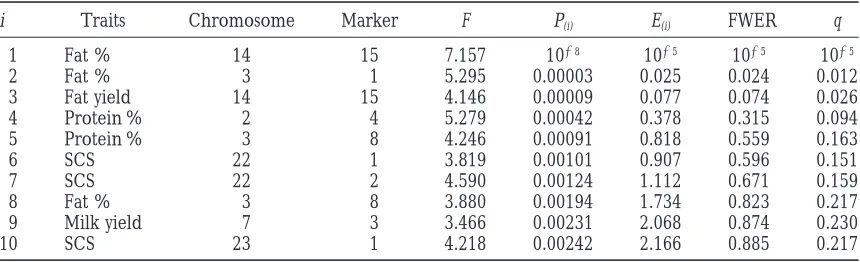
TABLE 2
Computation of the false discovery rate for granddaughter design analyses of variances across families
i Traits Chromosome Marker F P(i) E(i) FWER q
1 Fat % 14 15 7.157 1028 1025 1025 1025
2 Fat % 3 1 5.295 0.00003 0.025 0.024 0.012
3 Fat yield 14 15 4.146 0.00009 0.077 0.074 0.026
4 Protein % 2 4 5.279 0.00042 0.378 0.315 0.094
5 Protein % 3 8 4.246 0.00091 0.818 0.559 0.163
6 SCS 22 1 3.819 0.00101 0.907 0.596 0.151
7 SCS 22 2 4.590 0.00124 1.112 0.671 0.159
8 Fat % 3 8 3.880 0.00194 1.734 0.823 0.217
9 Milk yield 7 3 3.466 0.00231 2.068 0.874 0.230
10 SCS 23 1 4.218 0.00242 2.166 0.885 0.217
Seven milk production traits were analyzed for 128 markers in the U.S. Holstein population. i, number of null hypothesis ranked by descending P ; SCS, somatic cell score; Chromosome, bovine chromosome number; marker, anonymous designation of DNA-microsatellite; F, F-value for the effect of paternal marker allele nested within grandsire; P(i), probability of corresponding F-value; E(i), expected number of rejected true null hypotheses
with rejection probability P(i), computed as 896P(i); FWER, experimentwise type I error rate, computed as the
Figure 3.—The false discovery rate (q) (—),
experi-Figure 2.—The false discovery rate (q) (—),
experi-mentwise type I error rate (FWER) (· · ·), and comparisonwise mentwise type I error rate (FWER) (· · ·), and comparisonwise
type I error rate (CWER) ( - - - ) for the F-values computed type I error rate (CWER) ( - - - ) for the F-values computed
from the across-family analysis of the granddaughter design from the across-family analysis of the actual granddaughter
data from a typical random permutation of trait values within design data for each of 896 marker-trait combinations.
families.
RESULTS
With i5 9, CWER is still 0.01, which is almost exactly The F-values and their corresponding probabilities the expectation by chance (0.013 896 comparisons). from the granddaughter design analysis with the 10 Thus, by the criterion of CWER, 0.01, 9 hypotheses smallest probabilities out of the 896 marker-trait associa- would be rejected, as compared to 17 for the actual tion tests computed are given in Table 2. The expected data (Figure 2), this illustrates how unreliable the CWER number of rejected hypotheses assuming no segregating criterion is.
QTL, the FWER, and q values are also presented. Assum- Results from separate analysis of all within-family con-ing uncorrelated tests, only two F-values have a FWER trasts are plotted in Figure 4 for i# 30. The number ,0.05. Using the criterion of “suggestive linkage” of comparisons was 1309. Only two hypotheses would (FWER, 0.5 for a complete genome scan) only four be rejected by the criterion of FWER,0.5. There is a null hypotheses would be rejected. peak for q with i55. If only five hypotheses are rejected, If all 10 hypotheses are rejected, q, and thus FDR, are q 5 0.69. However, for i 5 11, q 5 0.47. As in the still,0.25, even though FWER50.88. Thus, seven or previous example, FDR can be decreased by rejecting eight marker-trait combinations should represent “true” more hypotheses. At i 5 30, P5 0.025, which is very effects and can be expected to repeat on a second popu- close to the expected level of 0.022 (30/1309). lation sample. Unlike FWER, q 5 mP(i)/i is not mono- Results for within-family comparisons from a typical tonic. For example, as i increases from 5 to 6 and from permutation of the data are plotted in Figure 5. As 9 to 10, q decreases. A decrease in q occurs when the expected, the FWER is close to 0.5 for the lowest t -test increase in successive probabilities is low. probability and increases to nearly unity for i.2. q is
Results for q, FWER, and CWER, computed as the individual F probabilities up to i5 30, are plotted in Figure 2. For i.20, q.0.4. For i530, CWER is still ,0.02. Thus, in this case, the criterion of controlling the FDR at 0.5 and CWER at 0.02 give similar results.
Results computed from a typical permutation of the genotype data against the trait data are plotted in Figure 3. Because the relationships among the markers and the traits have been randomized, no null hypotheses should be rejected. For the lowest F probability, FWER was 0.45, and q was 0.31. Thus, 1 hypothesis would be rejected with FWER controlled at 0.5, but not with FDR controlled at any reasonable level. For i values.5, the FWER is nearly equal to unity. By theory, the expectation
Figure 4.—The false discovery rate (q) (—), experi-of q is unity for all values experi-of i, but this criterion is much
Figure 7.—The false discovery rate (q) (—),
experi-Figure 5.—The false discovery rate (q) (—),
experi-mentwise type I error rate (FWER) (· · ·), and comparisonwise mentwise type I error rate (FWER) (· · ·), and comparisonwise
type I error rate (CWER) ( - - - ) for a simulated whole genome type I error rate (CWER) ( - - - ) for the t-values computed
scan of a backcross population. Two segregating QTL were from the within-family analysis of the granddaughter design
simulated. data from a typical random permutation of trait values within
families.
these can therefore be considered “true” effects. With
i550, the expectation was,0.1 standard deviations in nearly equal to unity for i 5 1, increases rapidly, but
only five cases, or 10%. As noted above, all QTL simu-then settles close to unity for i.15. As in the previous
lated had effects.0.2. Thus, q controlled the FDR as case, this is probably due to random fluctuation. The
predicted, while many true effects would have been graph of the CWER with permuted data is very similar
missed by the “weak” criterion of FWER,0.5. to the plot in Figure 4 with the actual data. This example
Results for the whole genome scan with only two again demonstrates that controlling the CWER is
virtu-simulated effects is plotted in Figure 7. The four markers ally meaningless if many hypotheses are tested.
with the lowest probabilities were all linked to the QTL The FDR, FWER, and CWER computed from the F
with a simulated effect of 0.31 standard deviations lo-probabilities from the backcross population simulated
cated on chromosome 6. Expectations of the effects with eight QTL are plotted in Figure 6 for i up to 50.
associated with these markers were all .0.18 standard Although only eight QTL were simulated, many more
deviations. The six next lowest probabilities were all markers gave relatively high test values because of
link-associated with markers located on chromosomes with-age. The expectation for the effect associated with a
out simulated QTL. The second QTL simulated on chro-given marker as estimated by a linear model is 1 22r
mosome 9 with an effect of 0.24 standard deviations of the simulated effect, where r is the recombination
was not detected. For i 5 4, q 5 0.11, FWER 5 0.37, frequency between the marker and the simulated QTL
and CWER50.004. At i5 5, q5 0.74, FWER50.98, (Weller et al. 1990). At i 5 50, FDR 5 0.18, FWER
and CWER 5 0.034. Again the FDR is controlled by 5 0.999, and CWER 5 0.08. However, with i 5 16,
the q statistic, while spurious effects are detected by FWER50.44. For all these 16 tests, the expectation of
controlling CWER. With few true effects, FWER and q the estimated effect was.0.13 standard deviations and
are similar, and controlling FWER or FDR yields similar results.
Results are presented in Figures 8, 9, and 10 for i up to 30 for the means of CWER, FWER, q, and TFDR from five runs simulated with four, two, and zero segregating QTL, respectively. Because these curves are the means of five runs, the q values and FDR are nearly monotonic, except for q with no QTL simulated. As predicted, TFDR is,q except for a few low values of i in Figure 10. Thus q was able to control the actual FDR, in the sense that
TFDR#q. However, the expectations for some of the
“true” effects were relatively small, because of incom-plete linkage, and would therefore have relatively low power of detection on a repeat sample. As expected
Figure 6.—The false discovery rate (q) (—), experi- with repeat random samples, the probability rankings mentwise type I error rate (FWER) (· · ·), and comparisonwise
for the individual markers were different among runs. type I error rate (CWER) ( - - - ) for a simulated whole genome
With four and two QTL simulated, three and one null scan of a backcross population. Eight segregating QTL were
Figure 8.—The mean estimated false discovery rate (q) Figure 10.—The mean estimated false discovery rate (q) (—), experimentwise type I error rate (FWER) ( — · · — ), (—), experimentwise type I error rate (FWER) ( — · · — ),the
comparisonwise type I error rate (CWER) (· · ·), and the true the comparisonwise type I error rate (CWER) (· · ·), and the true FDR (TFDR) ( - - - ) for whole genome scans of five FDR (TFDR) ( - - - ) for whole genome scans of five backcross
populations with four segregating QTL simulated as shown backcross populations with no segregating QTL simulated. in Table 1. TFDR, the number of tests among the set of rejected
hypotheses for which no linked QTL was simulated, divided
by i. eses tested can be considered a direct function of the number of markers genotyped.
The examples presented demonstrate the following the criteria of FWER,0.05. Thus, not all of the four
important properties of the FDR. or two QTL simulated would have been detected by the
criterion of FWER,0.05. With four and two QTL, the 1. If all null hypotheses are true, controlling FDR is
q values reached 0.5 for i527 and i525, respectively. equivalent to controlling FWER (Benjamini and For these i values the TFDR values were 0.12 and Hochberg1995).
0.34, respectively. With no QTL simulated (Figure 10) 2. If some of the null hypotheses are false, then the TFDR5 1 for all i values, and q was .1 except for a FDR is smaller than the FWER. The difference be-few low values of i. For i56, CWER50.05, which was tween the two criteria increases with increase in the very close to the expected value of 6/11050.055. For number of false null hypotheses. Thus, any
proce-i.7 the FWER and TFDR curves overlap. dure that controls the FDR at a given level will also control the FWER at this level.
3. Unlike FWER, FDR can be controlled without the DISCUSSION
assumption that relationships among the test statis-Although theoretically an infinite number of chromo- tics are known. As demonstrated, the FDR can be somal sites can be tested between linked markers, power readily controlled both for multiple linked markers with interval mapping is not greater than power ob- and linked traits.
tained by testing each marker individually (Simpson 4. Even though P(i) increases monotonically with i, q
1992;Darvasiet al. 1993). Thus, the number of hypoth- does not. Thus, it may be necessary sometimes to increase i to control the FDR at the desired level.
5. If there are QTL segregating, then the true FDR,
q. The discrepancy increases with increase in the
genomic density of segregating QTL.
6. Through control of the FDR, the number of hypothe-ses rejected, that is, the QTL detected, is a function of the actual number of segregating QTL in the pop-ulation, but not if either the FWER or CWER are controlled.
7. The dilemma of the appropriate rejection criterion for a partial genome scan is solved. The FDR can be controlled at the same level whether the complete genome or only part of the genome has been ana-lyzed.
Figure 9.—The mean estimated false discovery rate (q) 8. Additional levels of contrasts, such as multiple traits (—), experimentwise type I error rate (FWER) ( — · · — ),
or multiple populations, can be handled without the the comparisonwise type I error rate (CWER) (· · ·), and the
necessity of a proportional increase in the critical true FDR (TFDR) ( - - - ) for whole genome scans of five
markers. Heredity 69: 315–324.
represent true effects. Weaknesses of the FDR are that
Lander, E. S.,andD. Botstein,1989 Mapping Mendelian factors
it tends to fluctuate widely for low i if the total number underlying quantitative traits using RFLP linkage maps. Genetics of hypotheses tested is very large and that with many 121:185–190.
Lander, E.,andL. Kruglyak,1995 Genetic dissection of complex
true effects q overestimates TFDR. Further study is
re-traits: guidelines for interpreting and reporting linkage results.
quired to determine whether the information derived Nature Genet. 11: 241–247.
from the preliminary analysis can be used to augment Martinez, O.,andR. N. Curnow,1992 Estimating the locations and the size of the effects of quantitative trait loci using flanking
probabilities obtained in the confirmation study.
markers. Theor. Appl. Genet. 85: 480–488.
Other methods for determining rejection rates with Ron, M., M. Band, A. YanaiandJ. I. Weller,1994 Mapping quanti-multiple testing, most based on Bonferroni-type proce- tative trait loci with DNA microsatellites in a commercial dairy
cattle population. Anim. Genet. 25: 259–264.
dures, are summarized by Benjamini andHochberg
Sax, K.,1923 The association of size differences with seed-coat
pat-(1995). They also considered the advantages and
disad-tern and pigmentation in Phaseeolus vulgaris. Genetics 8: 552–560.
vantages of these methods.BenjaminiandHochberg Simpson, S. P.,1989 Detection of linkage between quantitative trait loci and restriction fragment length polymorphisms using inbred
(1995) proposed to apply the FDR after data collection.
lines. Theor. Appl. Genet. 77: 815–819.
Recently, Southey and Fernando (1998) developed
Simpson, S. P.,1992 Correction: detection of linkage between
quan-a method bquan-ased on the squan-ame principles to estimquan-ate quan-a titative trait loci and restriction fragment length polymorphisms
using inbred lines. Theor. Appl. Genet. 85: 110.
rejection threshold prior to data collection. Thus, they
Southey, B. R.,andR. L. Fernando,1998 Controlling the
propor-require a well-defined alternative hypothesis with a
tion of false positives among significant results in QTL detection.
known prior probability and must set the required Proc. 6th World Cong. Genet. Appl. Livest. Prod. 26: 221–224. power. Theoretically, their method can be used to de- VanRaden, P. M.,andG. R. Wiggans,1991 Derivation, calculation,
and use of national animal model information. J. Dairy Sci. 74:
cide how large an experiment is required to obtain a
2737–2746.
given power. However, prior information on QTL ef- Weller, J. I., 1996 Introduction to QTL detection and marker-fects is generally very vague. assisted selection, pp. 259–275 in Beltsville Symp. Agric. Res. XX:
Biotechnology’s Role in the Genetic Improvement of Farm Animals.
Amer-This study was supported by the U.S.-Israel Binational Agricultural ican Society of Animal Science, Savoy, IL.
Research and Development fund (BARD) and the Israel Milk Market- Weller, J. I., Y. KashiandM. Soller,1990 Power of “daughter”
ing Board. We thank G. R. Wiggans, P. M. VanRaden, and Yang Da and “granddaughter” designs for genetic mapping of quantitative
for providing data used in this study. traits in dairy cattle using genetic markers. J. Dairy Sci. 73: 2525–
2537.
Weller, J. I., J. Z. Song, Y. I. RoninandA. B. Korol,1997 Experi-mental designs and solutions to multiple trait comparisons. Anim.
LITERATURE CITED Biotechnol. 8: 107–122.
Weller, J. I., J. Z. Song, D. W. Heyen, H. A. LewinandM. Ron, Benjamini, Y.,andY. Hochberg,1995 Controlling the false discov- 1998 A new approach to the problem of multiple comparisons
ery rate: a practical and powerful approach to multiple testing. for detection of quantitative trait loci. Proc. 6th World Cong.
J. R. Statist. Soc. B. 57: 289–300. Genet. Appl. Livest. Prod. 26: 229–232.
Churchill, G. A.,andR. W. Doerge,1994 Empirical threshold