CORN, JENIFER O’SULLIVAN. Investigating the Quality of the School Technology Needs Assessment (STNA) 3.0: A Validity and Reliability Study. (Under the direction of Ellen Vasu and Kevin Oliver.)
Schools and districts should use a well-designed needs assessment to inform important decisions about a range of technology program areas. Presently, there is a lack of valid and reliable instruments available to schools to effectively assess their educational needs to better design and evaluate their projects and initiatives. The School Technology Needs Assessment (STNA) is a free, user-friendly online survey tool that meets this need for planning and formative evaluation of technology projects in educational settings. This study used existing data from a robust sample (n=1918) of educators from across North Carolina to examine the reliability and validity of STNA. A collective review of study results including the literature review, exploratory factor analysis (EFA), confirmatory factor analysis (CFA), and internal consistently reliability analysis indicate that STNA is a high quality instrument. The
literature supports the selection and inclusion of STNAs subconstructs. Items in STNA cluster together into 10 factors that support the reliability of the existing constructs identified in STNA. Factors focusing on technology program objectives (Teacher Technology Use, Student Technology Use, Teacher Impact, and Student Impact) were identified as stable, reliable, and invariant across multiple school-level response groups. Additionally, the pattern of responses across school-level groups was the same for 30 out of 49 STNA items related to technology program strategies. A copy of the survey is included in the appendix (see
Appendix A) and is available online at
Investigating the Quality of the School Technology Needs Assessment (STNA) 3.0: A Validity and Reliability Study
by
Jenifer O’Sullivan Corn
A dissertation submitted to the Graduate Faculty of North Carolina State University
in partial fulfillment of the requirements for the Degree of
Doctor of Philosophy Curriculum and Instruction
Raleigh, North Carolina 2008
APPROVED BY:
_________________________ _________________________ Ellen Vasu Kevin Oliver
Co-Chair of Advisory Committee Co-Chair of Advisory Committee
BIOGRAPHY
Jenifer O’Sullivan Corn was born in California in 1975, but spent a good deal of her childhood in Greensboro, North Carolina. She graduated from Page High School in May of 1993 and enrolled at the University of North Carolina at Chapel Hill (UNC) in August of that same year. During her studies at UNC, Ms. Corn worked as a research assistant in the
Psychology department for three semesters. Ms. Corn also participated in a study abroad program in the spring of 1996 in Florence, Italy where she studied the Italian language and culture. Ms. Corn earned her Bachelor of Arts degree in Psychology in May 1997.
After graduation, Ms. Corn worked as a 4-H Program Associate with the Wake County Cooperative Extension Service in Raleigh, North Carolina. While working full-time with the Wake County 4-H program, she enrolled as a part-time student at UNC to earn a graduate degree in education. She graduated with a Masters of Education in Educational Psychology, Measurement, and Evaluation in December 2002. Her graduate studies focused on education, instructional psychology, integrating technology in the classroom, and
educational research.
In 2003, Ms. Corn was hired as an Education Technology Specialist with the
assistance, and resource development and dissemination in the areas of curriculum and instruction, leadership for technology, policy, planning, and evaluation. Promotion to the TiL Program Coordinator, provided an opportunity to manage various aspects of on-going
programs at SERVE including: collecting and analyzing data to determine reliability and validity of TiL instruments; conducting qualitative research and evaluation studies to gain a better understanding of how innovative technology use in the classroom facilitates 21st century learning; and providing data analysis and synthesis for the external evaluation of state-level technology professional development grant.
In January 2008, Ms. Corn was hired as Senior Research Associate at the Friday Institute for Educational Innovation at North Carolina State University. Ms. Corn serves as the project coordinator for the evaluation of the implementation and impact of technology-enabled innovations in K-12 classrooms.
Ms. Corn is currently enrolled as a doctoral candidate in the School of Education at North Carolina State University, in Curriculum and Instruction with an emphasis in
TABLE OF CONTENTS
LIST OF TABLES... vi
LIST OF FIGURES ... viii
CAPTER I INTRODUCTION...1
Research Problem...1
Potential Contribution...2
Background...4
Research Questions...8
CHAPTER II REVIEW OF LITERATURE ...10
Program Evaluation Models...10
CAPE Evaluation Framework...12
Technology Needs Surveys...19
STNA Constructs and Subconstructs...21
Needs Assessment Instruments...27
Online Surveys...28
CHAPTER III RESEARCH METHOD ...31
Research Design...32
Participants...33
Instrument Development Process...35
Procedure...45
Data Analysis...46
Strengths and Weaknesses of the Design...51
CHAPTER IV RESEARCH FINDINGS...54
Participants...54
Item Analysis...57
Results...63
CHAPTER V DISCUSSION...87
Study Summary...87
Study Limitations...97
Recommendations...98
Further Areas of Study...102
Conclusion...103
REFERENCES ...104
APPENDICIES...122
Appendix A. School Technology Needs Assessment...123
LIST OF TABLES
Table 1
CAPE Conceptual Framework for Change in Schools ...19 Table 2
Demographic Data for Existing Response Set ...34 Table 3
Pilot Test Factor Loadings for STNA 2.0 Items ...38 Table 4
Demographic Data for Existing Response Set...54 Table 5
Demographic Data for Certified North Carolina School-Level Educators...55 Table 6
Results of Chi Square Tests to Determine Representativeness of Study Sample to North Carolina Educators...56 Table 7
Descriptive Statistics for STNA Items...58 Table 8
Factor Loadings for STNA 3.0 Items ...67 Table 9
Alignment between Hypothesized STNA Subconstructs and Factors Identified in the Exploratory Factor Analysis ...71 Table 10
STNA Factor Correlations Identified through the Confirmatory Factor Analysis ...73 Table 11
Results of Configural Test for Elementary, Middle, and High School Response Groups.75 Table 12
Table 13
Results of Pairwise Comparison Tests for Factor Structure A ...77 Table 14
Results of Pairwise Comparison Tests for Factor Structure C ...77 Table 15
Results of Posthoc One-Degree of Freedom Tests for Factor Structure A...77 Table 16
Results of Posthoc One-Degree of Freedom Tests for Factor Structure C ...79 Table 17
Factor Loadings for Items Identified as Variant across Response Groups...81 Table 18
LIST OF FIGURES
Figure 1. Logic model of the constructs included in STNA ...3
Figure 2. CAPE Professional Development Model ...15
Figure 3. Logic model of the constructs included in STNA ...22
CHAPTER I INTRODUCTION Research Problem
The No Child Left Behind (NCLB) Act requires educational project accountability to demonstrate impact on student learning objectives and/or teaching practices (U.S.
Department of Education, 2002b). In as much, many states are requiring that schools and districts plan and implement an evaluation of their on-going education projects, especially those tied to federal monies allocated through NCLB (McNabb, Hawkes, & Rouk, 1999). Presently, there is a lack of research sharing valid and reliable instruments available to schools to effectively assess their education technology needs to better design and evaluate their projects and initiatives. In fact, a recent search of the Educational Resources
Information Center (ERIC) database produced only 60 journal-article citations containing the terms needs assessment, school, and technology for Pre-K-12 settings. The School
Technology Needs Assessment (STNA) (see Appendix A), described in this study, provides a free, user-friendly online tool that meets this need for planning and formative evaluation of technology projects in educational settings. This study addresses the potential contribution of STNA, provides background on the development of the instrument, shares related research, and investigates the validity and reliability of the instrument.
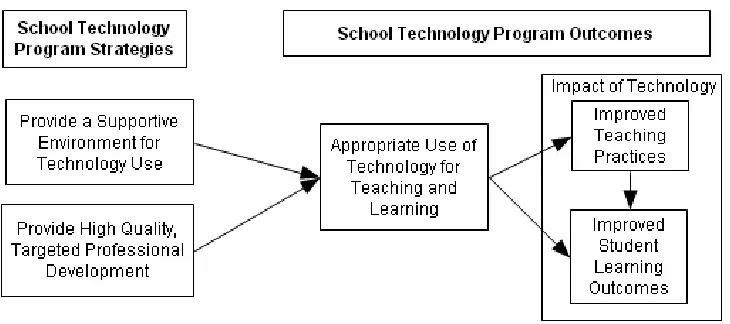
supportive environment for technology use; provision of high quality, targeted professional development for technology; frequency of appropriate technology use for teaching and learning; and changes in instructional practices and student learning. These data can help school-level leaders make planning and evaluative decisions related to technology projects. Potential Contribution
STNA collects data about educators’ perceptions around a variety of areas to determine the collective needs of school staff related to the use of technology for teaching and learning. The model underlying STNA assumes that it can positively impact learning outcomes through effective utilization of the data collected, with regard to each of the constructs to inform decisions about school technology programs. As illustrated in Figure 1, STNA collects data on school technology program strategies (status of a supportive
Figure 1. Logic Model of the Constructs Included in STNA.
By collecting data from school staff about each of the construct areas, STNA data are intended to be utilized by decision-makers for the purpose of formative evaluation of the school technology program. Therefore, it is necessary to make an explicit distinction between formative and summative uses of evaluation (Scriven, 1967), based on the intended use of evaluation findings (Patton, 1994). Formative evaluation is used strictly for program improvement and decision-making purposes, rather than for accountability purposes or for making decisions about program continuation (Patton, 1997). Defined in this way, formative evaluation efforts focus on collecting and analyzing data to examine both implementation (i.e., the quality of the program strategies) and impact (i.e., how effectively desired outcomes are met).
STNA enables school staff to plan, implement, and evaluate their own technology programs by providing an easy-to-use data collection tool to make judgments and
“approach that helps achieve program success. By providing program developers with tools for assessing the planning, implementation and results of programs, community stakeholders have the opportunity to improve planning, implement with quality, [and] evaluate
outcomes…thereby increasing the probability of achieving results” (Wandersman, 1999, p.96).
Background
In 2003, the Instructional Technology Division of the North Carolina Department of Public Instruction (NCDPI) was one of 10 states to receive a federal grant to study the impact of a state-level instructional technology initiative. This grant, LANCET (Looking At North Carolina Educational Technology), included research and evaluation of the implementation and impact of the North Carolina’s Enhancing Education through Technology (EETT) sub-grants (North Carolina Department of Public Instruction, 2003b). Eleven North Carolina schools were awarded these three-year competitive sub-grants.
coordinator in place; developing a school-wide focus on flexible access to computer labs, mobile computer carts, and libraries; in combination with collaborative planning. Each of the 11 IMPACT schools was awarded approximately $450,000 a year for three years to fully implement each component of the IMPACT model (North Carolina Department of Public Instruction, 2003b).
The Technology in Learning program at the SERVE Center at the University of North Carolina at Greensboro (UNCG) was one of the principle collaborators with NCDPI on the LANCET grant, along with the College of Education at North Carolina State University and the Friday Institute for Educational Innovation. The SERVE contribution to the LANCET project included, providing professional development and technical assistance to the IMPACT schools on formative evaluation and guiding the development and validation of instruments for formative evaluation (North Carolina Department of Public Instruction, 2003b).
The North Carolina EETT IMPACT schools were not the only EETT projects required to conduct a program evaluation. According to the National Trends report
commissioned by the State Educational Technology Directors Association (SEDTA), 86% of all states require their EETT competitive award grantees to conduct an evaluation of their project (Lemke, Wainer, & Haning, 2006). This statistic clearly illustrates the need for high quality instruments and other evaluation resources for the EETT competitive award grantees.
three crucial components: a collection of evaluation resources; a professional development model; and a conceptual framework that guides SERVE’s work to support evaluation planning and implementation in schools and districts. SERVE has continued to revise and improve these components based on feedback from participants as well as state agency collaborators. SERVE’s role in the framework is one of collaborator, facilitator, and technical assistance provider. School and district teams serve as active participants in the professional development and ultimately as formative evaluators who use CAPE evaluation resources.
SERVE’s work with schools to facilitate planning and implementation of their evaluation plans, as well as data from recent interviews and focus groups with past CAPE participants, led to the identification of a number of essential sources of data for effectively evaluating the implementation and impact of technology projects in schools. These data sources include staff needs assessments, student surveys, teacher reflection logs, technology use logs, classroom observations, professional development questionnaires, rubrics and scoring guides for evaluating lesson plans and student projects, and family and community partnership surveys (Knestis, Byrom, Matzen, Corn, & Thrift, in press). One instrument developed as part of this process was STNA, the focus of this study.
evaluation efforts, improve project implementation, and facilitate discussions around the purpose and status of the school technology program. Additionally, schools have used STNA data to support the narrative for a technology grant proposal as evidence of technology needs. Other schools have incorporated STNA data into their School Improvement Plan or
Technology Plan to define priorities, plan professional development, and/or allocate resources. Finally, other schools have implemented STNA annually to track changes in the school STNA “profile” over time.
Results from two pilot studies were used to modify and improve previous versions of STNA (Corn, 2006, 2007). Based on a those results, SERVE staff implemented a careful review process where each existing STNA item was confirmed, revised, or removed; additional items were added; constructs and subconstructs were reorganized or renamed. Also, a new demographic section was added to the revised instrument, expressly for research purposes. The resulting instrument, STNA 3.0 is the focus of the current study. A sample of STNA 3.0 (see Appendix A) is available for review at
http://srvlive.serve.org/Evaluation/Capacity/EvalFramework/resources/STNA.php . STNA 3.0 is made up of 86 self-report, five-point Likert scale items. Based on the results of the pilot studies, national technology standards and best practices as recommended by research and specialists in the field of educational technology, STNA items were
organized into the following 4 constructs and 12 subconstructs: A. Supportive Environment for Technology Use
3. Flexible Scheduling (3 items) 4. Infrastructure (5 items) 5. Staff Support (3 items) 6. Media and Software (4 items) B. Professional Development
7. Professional Development Needs: Instruction (7 items) & Planning (8 items) 8. Professional Development Quality (7 items)
C. Use of Technology for Teaching and Learning
9. Teacher Use: Instruction (7 items) & Planning (8 items)
10.Student Use: Information and Communication Technologies (8 items) D. Impact of Technology
11.Teaching Practices (4 items) 12.Student Outcomes (5 items) Research Questions
The purpose of this study was to investigate the quality of STNA 3.0. Therefore, the central research question was: Is STNA a high quality instrument? The central research question can be further separated into the following five subquestions:
1. To what extent does the literature support the selection and inclusion of STNA’s constructs and subconstructs?
2. To what extent do the items in STNA cluster together into factors?
3. To what extent do those factors support the validity of the existing constructs identified in STNA?
4. Are the identified factors invariant among elementary, middle, and high school staff respondents? and
CHAPTER II
REVIEW OF LITERATURE
A review of literature relevant to the development and implementation of STNA is multifaceted in nature. Because the purpose of STNA is to provide a high quality resource to help schools and districts formatively evaluate their technology programs, it is important to understand how STNA fits into the larger context of program evaluation models.
Subsequently, STNA is but one tool identified within SERVE’s CAPE Evaluation
Framework. Therefore, it also is imperative that the CAPE Framework be explored, as well as other technology needs surveys available to schools and districts. Additionally, the research supporting the selection and inclusion of STNA’s constructs and subconstructs lies at the heart of determining the quality of the instrument itself. Finally, certain literature in the field of education that addresses needs assessment instruments as well as the use of online surveys also contributes to understanding how STNA can most effectively be utilized by educators.
Program Evaluation Models
decision-makers; 3) consumer-oriented approaches focus on helping consumers choose among
competing products and services; 4) expertise-oriented approaches use professional expertise to judge the quality of program of interest; 5) adversary-oriented approaches focus on the opposing points of view of different evaluators; and 6) participant-oriented approaches involve participants in determining the values, criteria, needs, and data for the evaluation (Fitzpatrick, Sanders, & Worthen, 2003). Determining which approach to use is dependent upon a number of factors such as the evaluation’s purpose and use, the evaluator’s
philosophy and training, and the context of the educational program.
The approach that best represents the philosophical intentions in which STNA was created is the participant-oriented approach. STNA involves the school and district staff in planning and implementing their evaluation. They are the ones deciding what evaluation questions to ask, which instruments to use, what data to collect, and how results should be reported. In this way, lessons about the value of the participants’ involvement in the
evaluation are taken from the participant-oriented approach (Fetterman, 2005a; Patton, 1997; Wandersman, Imm, Chinman, & Kaftarian, 2000). Several evaluation models, couched within the participant-oriented approach, align with this intended use of STNA in schools, including Empowerment and Utilization-Focused Evaluation.
Empowerment evaluation.
increase the chance the projects will achieve results (Wandersman, 1999). Increased
involvement of program stakeholders promotes buy-in for the participation in the evaluation process and confidence in the evaluation results (Cousins & Whitmore, 1998; King, 1998). In this case, STNA is an evaluative tool used by the educators in the schools, where technology projects and professional development programs are being evaluated. STNA is selected and deployed by the schools, and STNA results are used to inform project implementation.
Utilization-focused evaluation.
Utilization-focused evaluation “begins with the premise that evaluations should be judged by their utility and actual use” (p. 20, Patton, 1997). Utilization-focused evaluations are highly situational and influenced by the context in which they are conducted (Patton, 1997). Similarly, STNA was developed for individual schools to use for their own evaluative purposes. It is one part of a larger evaluation effort where its appropriateness is judged by the context. It is clear, however, that STNA is only as useful as the actions taken based on its results. In as much, SERVE staff work with STNA school site coordinators to impress upon the schools that the value of most instruments lies primarily in the use of results found. CAPE Evaluation Framework
designing an evaluation; 3) collecting information; 4) analyzing information; 5) reporting information; 6) managing evaluation activities; and, 7) evaluating evaluation efforts (Brinkerhoff, Brethower, Hluchyj, & Nowakoski, 1983). Each of these components is considered within the CAPE Framework. Subsequently, the CAPE Framework has evolved over time to also address the requirements of federally funded technology grant programs and to meet national program evaluation standards (Joint Committee on Evaluation Standards for Educational Evaluation, 1994). The CAPE Framework is composed of three crucial components: a collection of evaluation resources; a professional development model; and, a conceptual framework that guides SERVE’s work to support evaluation planning and implementation in schools and districts.
CAPE evaluation resources.
The CAPE Evaluation Resources contain three main elements: logic maps, detailed templates showing how each project strategy and objective will be evaluated, and an evaluation management plan. During professional development sessions, teams of
Next, participants fill in templates of charts showing how each project strategy and objective identified in their logic map will be evaluated (Frechtling, 2007). Participants identify and ask appropriate process-based implementation and outcome-based impact
evaluation questions; identify methods and measures for data collection; specify benchmarks; and describe what decisions will be made based on findings (Frechtling, 2002; Royse, Thyer, Padgett, & Logan, 2006). Collectively, the templates for each objective and strategy
comprise the evaluation plan. Once completed, participants review the plan in its entirety and identify a list of all the activities associated with implementing their evaluation (e.g.
evaluation committee meetings, data collection, data analysis, sharing results with stakeholders). This list of evaluation activities, as well as related timeframes, persons responsible, and necessary resources make up the Evaluation Management Plan (Worthen, Sanders, & Fitzpatrick, 2004).
SERVE’s work with schools and districts to develop and implement their evaluation plans using the CAPE Evaluation Resources led to the identification of a number of essential sources of data for effectively evaluating the implementation and impact of technology projects in schools. These data sources included staff needs assessments, student surveys, teacher reflection logs, technology use logs, classroom observations, professional
CAPE professional development model.
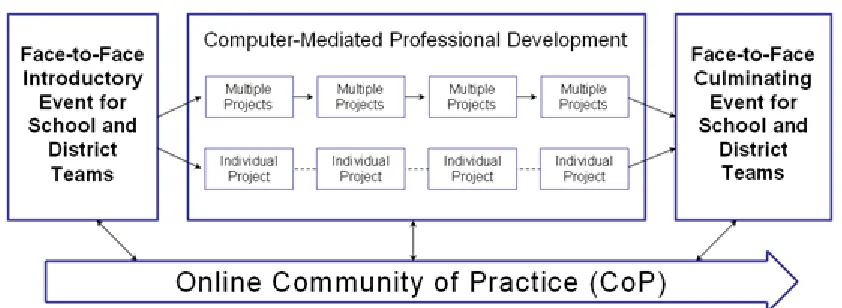
The CAPE Professional Development model is based on national standards and best practices of professional development for educators (National Staff Development Council, 2001) and is consistent with the guidelines of the Partnership for 21st Century Learning (2006b). An initial step in the model recommends working closely with state education agency (SEA) staff to determine how the CAPE Framework can best be tailored to the needs and contexts of the district and school teams. SERVE then designs atargeted evaluation support program based on those identified needs (Speck & Knipe, 2001). As shown in Figure 2, a typical CAPE professional development program begins with an intensive face-to-face event where educators work in teams, with guidance from SERVE staff (Joyce & Showers, 1995), in developing evaluation plans for their projects. This approach engenders buy-in and furthers a cohesive understanding of how the project and the evaluation work (Liberman & Miller, 1999).
The face-to-face event is followed by a variety of technical assistance services, according to the teams’ progress and the nature of challenges they may encounter (National Staff Development Council, 2001). SERVE utilizes a web-based collaborative meeting environment, Computer Mediated Professional Development (CMPD) to facilitate technical assistance sessions at a distance. CMPDs are designed to provide individual project support to a single team or provide an opportunity for multiple projects teams to come together to learn from one another (McLaughlin & Talbert, 1993). SERVE uses these follow-up work sessions to review and to provide feedback to teams on their evaluation plans and provide continued technical assistance for evaluation implementation (Loucks-Horsely, Love, Stiles, Mundry, & Hewson, 2003). The CMPDs also provide an environment for the teams to acquire additional information that will help them implement their evaluations (e.g., how to manage the implementation of the evaluation, how to collect baseline data, how to maximize school buy-in and community support, how to analyze and interpret data, etc.).
Over the entire course of the training, participants are enrolled in an online
Community of Practice (CoP) through which they have access to a full range of opportunities for furthering their understanding of the evaluation. These opportunities and resources
services staff. The follow-up sessions and CoP enable participants to network and provide mutual support (Wenger, McDermott, & Synder, 2002).
Throughout the professional development process, school teams receive information and guidance about a variety of evaluative instruments they can use to measure and assess the quality of their technology programs. STNA is one of these instruments. SERVE staff introduce STNA during the initial face-to-face event, provide follow-up support about the implementation of STNA at their schools, and then may help with analysis and interpretation of STNA data during the CMPDs.
Finally, SERVE organizes a culminating event for school and district teams to share their successes, challenges, and lessons learned from their experiences evaluating their technology projects. The format of this event is coordinated with the SEA staff and can take on a number of different formats. For example, the event could be held in conjunction with a state technology conference wherein CAPE participants present at a poster or concurrent session highlighting their work, or it could be a special reception held in the participants’ honor. Another option would be a separate event scheduled for the express purpose of bringing the teams together where each team has an opportunity to present and share.
CAPE conceptual framework.
development of the CAPE Framework, and subsequently the successful use of STNA as a tool for school-based evaluation of technology projects, is based on the research and literature on the change process, the adoption of educational innovations, and capacity building in education settings (Knestis, Byrom, Matzen, Corn, & Thrift, in preparation).
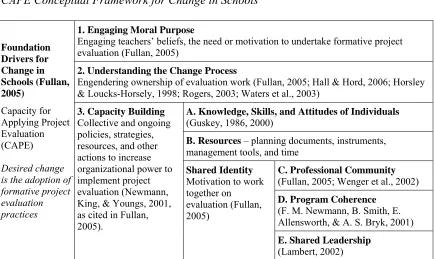
Table 1
CAPE Conceptual Framework for Change in Schools
1. Engaging Moral Purpose
Engaging teachers’ beliefs, the need or motivation to undertake formative project evaluation (Fullan, 2005)
2. Understanding the Change Process
Engendering ownership of evaluation work (Fullan, 2005; Hall & Hord, 2006; Horsley & Loucks-Horsely, 1998; Rogers, 2003; Waters et al., 2003)
A. Knowledge, Skills, and Attitudes of Individuals (Guskey, 1986, 2000)
B. Resources – planning documents, instruments,
management tools, and time
C. Professional Community (Fullan, 2005; Wenger et al., 2002)
D. Program Coherence (F. M. Newmann, B. Smith, E. Allensworth, & A. S. Bryk, 2001) Foundation Drivers for Change in Schools (Fullan, 2005) Capacity for Applying Project Evaluation (CAPE) Desired change is the adoption of formative project evaluation practices
3. Capacity Building Collective and ongoing policies, strategies, resources, and other actions to increase organizational power to implement project evaluation (Newmann, King, & Youngs, 2001, as cited in Fullan, 2005).
Shared Identity Motivation to work together on evaluation (Fullan, 2005)
E. Shared Leadership (Lambert, 2002)
This conceptual framework expands the traditional definition of capacity building beyond the knowledge, skills, and attitudes of individuals. Further it recognizes that the resources necessary to apply them to the desired end emphasize the importance of shared identity, professional community, program coherence, and shared leadership. This framework is limited to furthering change in terms of capacity to plan and implement formative evaluation; it might be applied to any education innovation—an idea perceived as new by an individual or group (Rogers, 2003).
Technology Needs Surveys
Association, 2004). Of these, over 100 were identified as surveys/questionnaires addressing everything from attitude to usage to efficacy to technology literacy of students, teachers, and administrators. However, only a few surveys identified in the SETDA database collected data on school technology needs across a large number of areas, which could then be used for formative evaluation purposes – ultimately to make decisions about technology whole program improvement. These multifaceted surveys included enGauge Online Assessment, Texas STaR Chart, Level of Technology Implementation Questionnaire (LoTiQ), School Climate Inventory (SCI), Teacher Technology Questionnaire, Teachers' Attitudes toward Computers Questionnaire (TAC), Learning with Technology Profile Tool, and Utah Technology Awareness Project Rubrics (UTAP).
The enGauge Online Assessment was developed to collect data on district, not school-level, technology needs, and although originally funded through federal education monies, currently a fee is associated with implementation and data collection (North Central Regional Educational Laboratory, 2000). Use of Texas STaR Chart by other states, districts, and schools is not viable because the survey aligns to the Texas Long Range Plan for
University of Memphis’ Center for Research in Educational Policy as part of the Formative Evaluation Process for School Improvement (FEPSI) project and are available to schools and districts only through contracted work with the center (Center for Research in Educational Policy, n.d.). Christensen and Knezek’s (1996, 2000) Teachers' Attitudes toward Computers Questionnaire (TAC) is a valid and reliable 105-item Likert instrument for measuring teachers' attitudes toward computers on seven subscales. However, the TAC only focuses on teachers’ perceptions of computer importance, enjoyment, anxiety, seclusion, etc. and does not give a complete picture of technology issues at the school level, such as administrator support of technology. Finally, the Learning with Technology Profile Tool (NCRTEC, 1997) and Utah Technology Awareness Project Rubrics (Utah Education Network, 1999) are both multidimensional scales that provide data for technology planning at the school level. However, these instruments are no longer supported by the organizations that developed them. Although each of these surveys addresses a variety of technology-focused constructs, none of them are easily accessible to schools and districts.
STNA Constructs and Subconstructs
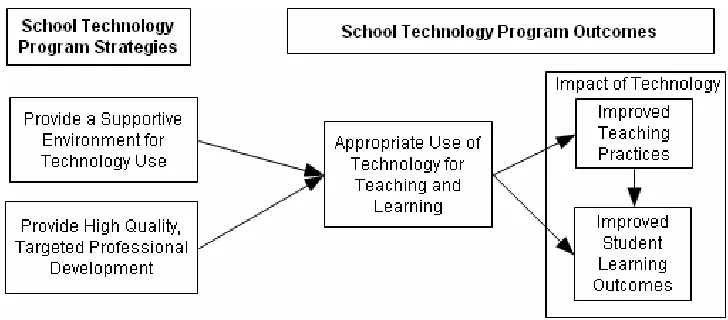
As shown in Figure 3, STNA provides an important formative evaluation tool for collecting data on the status of school technology program strategies (i.e., status of a supportive environment for technology use and provision of high quality, targeted
professional development for technology), and school technology program outcomes (i.e., appropriate technology use for teaching and learning, and changes in instructional practices and student learning). According to relevant research and professional literature, each of the constructs included in STNA is a vital component of a successful school technology
program.
Figure 3. Logic Model of the Constructs Included in STNA.
• Vision and Shared Leadership - administrators who effectively model and communicate a vision for technology use and support education technology innovators (Davis, Darling-Hammond, LaPointe, & Meyerson, 2005; International Society for Technology in Education, 2002; Interstate School Leaders Licensure Consortium, 1996; Lambert, 2002; Marzano, Waters, & McNulty, 2005; Stein & Gewirtzman, 2003);
• Organizational Conditions - having a stakeholder-supported long-range technology plan in place that includes an adequate budget for technology resources and
provisions for evaluation of the technology program (Bradshaw, 2002; Lemke et al., 2006; November, Costello, & Huske, 1998; Office of Technology Assessment, 1995; Ringstaff & Kelley, 2002; U.S. Department of Education, 2004);
• Flexible Scheduling - library and technology resources that are flexibly scheduled to allow students and teachers maximum access to education and technology resources (Public Schools of North Carolina, 2005; Ringstaff & Kelley, 2002)
• Infrastructure - a reliable technology infrastructure that facilitates electronic
communication (Culp, Honey, & Mandinach, 2003; Epstein, 2001; Otterbourg, 1998; Penuel et al., 2002)
• Media and Software - access to a wealth of electronic resources that consider both the needs of the learners and the curriculum (CEO Forum, 2001; Ertmer et al., 2001; Guha, 2001; Shelly, Cashman, Gunter, & Gunter, 2002)
The “Professional Development” construct is organized into two sections where respondents indicate level of need for specific professional development opportunities and quality of past professional development experiences. Items addressing potential professional development needs address the use of technology for both instruction and planning. These items align with items in the following section of STNA related to how often teachers use technology for both instruction and planning. Comparing response rates for these items across constructs can inform future professional development planning. The Professional Development Quality section provides a general description of the quality of the current professional development program at the school level.
STNA items that address high quality, targeted, technology professional development in a school setting include the provision of training for teachers targeted on effective,
professional development should be assessed using data on classroom practice and student learning (Darling-Hammond & McLaughlin, 1996; Guskey, 2000; Killion, 2002).
The items included in the “Use of Technology for Teaching and Learning” construct examine school staff’s current use of technology for instruction and planning practices. Items included here also examine how students use information and communication technologies for learning in the classroom. Items 1-15 in this section aligns with items 1-15 in the Instruction and Planning sections from the Professional Development Needs construct.
STNA items address the effective use of technology for teaching and learning by focusing on teacher implementation of research-based, technology-enhanced instructional strategies in the classroom, and student use of information and communication technologies in the classroom. As a result of targeted professional development and support, teachers should be able to use strategies such as performance-based student assessments (Pendersen & Liu, 2003), evaluate technology resources (Guha, 2001; Kerrigan, 2002), collect and analyze student assessment data (CEO Forum, 2001; Fuchs & Fuchs, 2002; Sands & Buchholz, 1997), design learner-centered, differentiated teaching strategies (Jonassen, 1999; Land & Hannafin, 2000), and emphasize both content standards and student technology standards (International Society for Technology in Education, 2000b; Kanaya, Light, & Culp, 2005a; Ringstaff & Kelley, 2002).
resources, work on technology-enhanced projects that involve real-world applications, solve problems, support higher-order thinking, and create new ideas and representations of
information (International Society for Technology in Education, 2000a; Partnership for 21st Century Skills, 2006a; Ringstaff & Kelley, 2002; Shelly et al., 2002).
Finally, STNA constructs include items that address the impact of technology use by teachers and students by focusing on improvements in teaching practices and student
learning outcomes. The items included in this construct examine school staff’s perception of the impact of technology on teaching practices and student outcomes. Examples of expected shifts include instructional practices that are student-centered and interactive, and emphasize student uses of technology for project-based or cooperative learning (Apple Computer Inc., 1995; Boethel & Dimock, 1999; Jonassen, 1999; Office of Technology Assessment, 1995; Pendersen & Liu, 2003). These changes in teacher practice will result in students who are more socially aware, confident, and positive about their future (Partnership for 21st Century Skills, 2006a); are independent learners and self-starters (Apple Computer Inc., 1995; Clements & Sarama, 2003); will work more collaboratively (Clements & Sarama, 2003; Tiene & Luft, 2001); are more engaged in their learning (Bangert-Drowns & Pyke, 2002); and, ultimately will achieve greater academic success (Brush, Armstrong, Barbrow, & Ulintz, 1999; Christmann & Badgett, 1999; Cotton, 1991; Joyce & Showers, 1995; Papanastasiou, Zemblyas, & Vrasidas, 2003; Powell, Aeby, & Carpenter-Aeby, 2003; Schacter, 1999).
technology program. However, it cannot be emphasized enough that the value of STNA lies in the use of the data collected about each of these constructs by school staff to make
adjustments for technology program improvement. Needs Assessment Instruments
Data from needs assessment surveys are intended to aid in effective decision making about educational program implementation (McKillip, 1987). In as much, STNA was specifically designed to assess the collective needs of a school staff related to the use of technology for teaching and learning, in order to make important decisions about a range of technology program areas including: environmental and contextual factors influencing technology use, the quality of professional development opportunities, and the impact of technology on classroom practice and student learning outcomes.
Research supports the use of a well-designed needs assessment to provide the
essential link between staff needs and professional development opportunities, hardware and software purchases, and resource allocation (Baylor & Ritchie, 2002; CEO Forum, 2000a; Kanaya, Light, & Culp, 2005b; Kocher & Moore, 2001; Loucks-Horsely et al., 2003). Hall and Hord (2001) supported the use of needs assessments and other reliable surveys to guide decisions about change in schools and districts. Weston (2004) found that tools used to support formative evaluation efforts of educational technology projects, such as STNA, should be used to improve project design. A series of studies commissioned by SRI
for the purpose of refining the design of the intervention (Haertel & Means, 2000).
Measuring the Impact of Technology on Classroom Teaching and Learning (Dirr, 2004), a monograph resulting from the collaborative work among two regional technology in education consortia, state education technology directors, and leaders in the field of
evaluation of education technology projects, made very specific recommendations regarding future evaluation efforts at the state and local level. One recommendation included the exploration of valid and reliable instruments, such as STNA, that any state and district could use to gather data for education technology project evaluation.
Online Surveys
Most experts agree that online surveys should adhere to sound principles of survey design and implementation, although there are specific issues and concerns that are particular to electronic assessment and data collection (Shannon, Johnson, Searcy, & Lott, 2002). These issues include sampling, access to technology, comfort level with technology and the
Internet, confidentiality, and authenticity of responses (Cook, Heath, & Thompson, 2000; Dillman, Tortora, & Bowker, 2001; Fetterman, 2002; Shannon et al., 2002; Solomon, 2001).
such as follow-up contact with non-respondents, personalized contacts, and contacting the sample prior to sending out a survey. Along with these recommendations, SERVE staff have suggested other strategies such as providing time during staff meetings to complete the survey in the computer lab, providing incentives, and keeping a record of who has and who has not completed the instrument.
Another major concern raised with online surveys is respondents’ access to
technology and the Internet (Fetterman, 2002; Solomon, 2001). According to the National Center for Educational Statistics (2004), by 2003 99.99% of public schools in the United States had access to the Internet. Since educators deploy STNA in their schools, it can only be assumed that the schools, and therefore the targeted sample, in fact do have access to the Internet. Some researchers are concerned that respondents who are not comfortable with technology might not respond to an online survey and recommend making the online survey as simple and user-friendly as possible (Dillman et al., 2001; Shannon et al., 2002). This issue was certainly a consideration when SERVE staff designed STNA. The only
technological skills required to use STNA are that respondents need to know how to open and access the Internet, go to a specific URL, and complete and submit online forms.
Although demographic information is collected for the purposes of conducting research on the STNA instrument, SERVE staff decided not to include items related to demographic information in the online reports provided to schools. This decision was intended to further protect the confidentiality of respondents. If demographic information is provided to the school sites, there is the distinct possibility of being able to identify individuals.
CHAPTER III RESEARCH METHOD
This chapter discusses the methodological aspects of the study, including the
description of the research design, existing data set, instrument development process, analytic procedures, and strengths and weaknesses of the study design. The central research question is as follows: Is STNA a high quality instrument? The central research question can be further separated into the following five subquestions:
1. To what extent does the literature support the selection and inclusion of STNA’s constructs and subconstructs?
2. To what extent do the items in STNA cluster together into factors?
3. If so, to what extent do those factors support the validity of the existing constructs identified in STNA?
4. Are the identified factors invariant among elementary, middle, and high school staff respondents? and
5. To what extent does STNA demonstrate internal consistency reliability both across constructs and within each of the subconstructs?
existing subconstructs identified in STNA. A comparison across elementary, middle, and high school response groups, using a multi-group CFA was used determine level of factor invariance. Finally, factors found to be stable were subjected to an internal consistency reliability analysis.
Research Design
As this study focuses on the constructs included within STNA and their relationships to one another, the appropriate research design is correlational (T. Cook & Campbell, 1979; Fraenkel & Wallen, 2003; Gall, Borg, & Gall, 1996). A correlational research design is used to study relationships between and among variables through the use of correlational statistics, such as factor analysis, and is used extensively in test construction and analysis (Gable & Wolf, 1993; Gall et al., 1996; Pett, Lackey, & Sullivan, 2003). A correlational study that simply observes the size and direction of the relationships among variables is considered a nonexperimental design or observational study approach (Shadish, Cook, & Campbell, 2002).
Often the quality of a correlational research study is determined by the depth of the rationale that guides the research design (Gall et al., 1996). In this study, a thorough literature review examining each of the constructs and subconstructs included in STNA provided the theoretical rationale that guided the statistical analysis for the study. In addition, the
likelihood of obtaining important research findings in correlational research studies is
of the current version of STNA and were used to inform the statistical analyses of the existing constructs.
The principal advantage associated with correlational research studies is that the researcher is able to analyze relationships among a large number of variables in a single study (Gall et al., 1996). This notion provides strong support for use of this research design for this study, as the current version of STNA includes 86 items organized into 4 main constructs and 12 subconstructs.
Participants
This study investigated the validity and reliability of STNA 3.0, using existing data from STNA respondents from schools that implemented STNA for their formative evaluation purposes. STNA is available to schools as a free online assessment. The data are collected and reported separately and confidentially at the school level. Individual respondents are not identifiable. Schools receive data summaries, via a unique URL provided through the web-based survey site, which report the frequencies and percentages of responses to each item and bar graph representations of those values.
According to SERVE records, schools learned about STNA in a variety of ways including the SERVE website, SEA staff, local education agency (LEA) staff, and
represented an accurate picture of each school as a whole (Fink, 1995).The confidentiality of respondents is emphasized to promote honesty of responses from school staff (Linn & Miller, 2005). SERVE staff worked with school staff to determine opening and closing dates for STNA during which time the school staff responded to STNA using a specific URL. Once STNA was “closed,” the school was sent a report showing frequency data, aggregated to the school level for each item with a corresponding bar graph visually depicting the frequency count. Since it was first launched in May of 2005, schools from all over the United States have used STNA to gather needs data from their staff to inform technology decisions for the school.
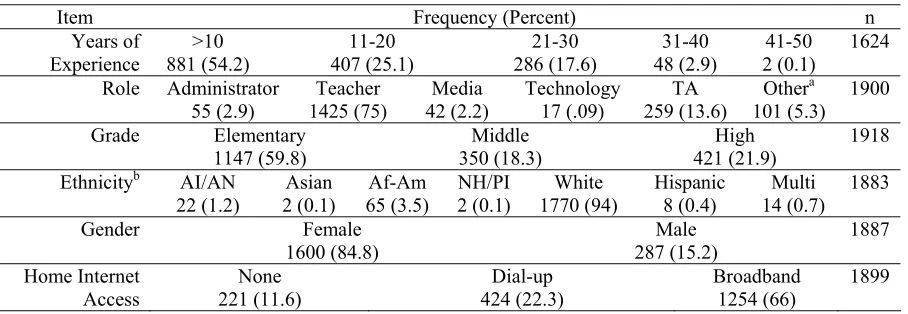
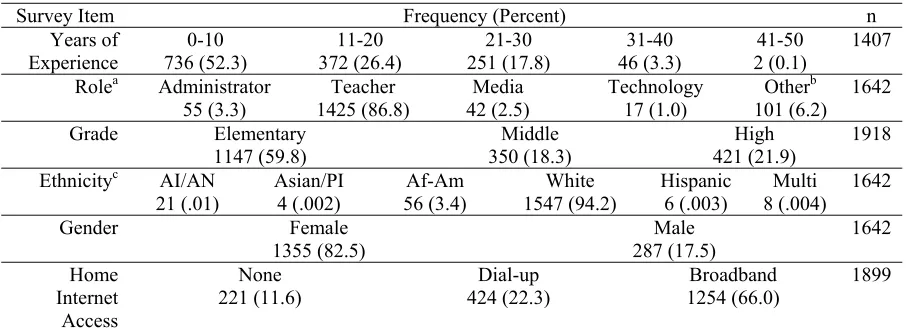
As of July 2007, the data set for STNA 3.0 used for this study responses included 1918 surveys from 49 schools in North Carolina. The school sites were made up of 32 elementary schools (65.3%), 9 middle schools (18.4%), and 8 high schools (16.3%). See Table 2 for detailed demographic information of the study’s response set.
Table 2
Demographic Data for Existing Response Set
Item Frequency (Percent) n
Years of
Experience 881 (54.2) >10 407 (25.1) 11-20 286 (17.6) 21-30 48 (2.9) 31-40 2 (0.1) 41-50 1624 Role Administrator
55 (2.9) 1425 (75) Teacher 42 (2.2) Media Technology 17 (.09) 259 (13.6) TA Other a
101 (5.3) 1900
Grade Elementary 1147 (59.8)
Middle 350 (18.3)
High 421 (21.9)
1918
Ethnicityb AI/AN
22 (1.2) 2 (0.1) Asian 65 (3.5) Af-Am 2 (0.1) NH/PI 1770 (94) White Hispanic 8 (0.4) 14 (0.7) Multi 1883 Gender Female
1600 (84.8) 287 (15.2) Male 1887
Home Internet
Note. Although n=1918, demographic items were optional and missing responses were not included in the analysis.
a Examples of “Other” are counselor, school nurse, student teacher, receptionist, literacy/curriculum coordinator, and so
forth.
b Ethnicity Abbreviations: AI/AN = American Indian/Alaska Native; Af-Am = Black or African American; NH/PI = Native
Hawaiian or Other Pacific Islander; Multi = Multi-Racial Selection. Instrument Development Process
SERVE staff used national technology standards and best practices as recommended by research and specialists in the field of educational technology when determining the constructs and writing items for the beta version of STNA (CEO Forum, 2000b; International Society for Technology in Education, 2000a, 2000b, 2002; Milken Exchange, 1998; National Staff Development Council, 2001; North Central Regional Educational Laboratory, 2000; Public Schools of North Carolina, 2005). Content analysis techniques, a common practice in qualitative research, were employed to organize, code, identify patterns, and synthesize the large amount of text-based data from the professional literature on technology in education (Bogdan & Biklen, 2007). In order to keep a record of which standards related to which constructs and items, SERVE staff developed an item reference matrix (see Appendix B), which was updated as the instrument was revised.
administration and deployment procedures actually worked in a school setting. A report was provided to the school that included the data presented in frequencies and a short
interpretative review of the responses. SERVE staff then conducted a focus group with a sample of the school staff (n=10) who participated in the STNA beta pilot. The focus group covered topics such as recommended procedures for implementation in other schools, clarity of individual items, cohesion of the instrument, and value of the information provided in the data. Adjustments were made to the instrument based on information gathered through the SERVE staff observations and focus group to create STNA version 1.0. Some of the resulting changes included splitting one item into three separate items, replacing “?” with “Do Not Know” on the response scale, and expanding the instrument’s directions to provide additional information to respondents.
STNA, 2.0, was made available to the public through the SERVE website and was housed on a server on Key Survey (http://www.keysurvey.com), a web survey site.
Two pilot studies were conducted to investigate the validity and reliability of the STNA 2.0. The first study, using data from 2094 respondents from 48 schools in North Carolina, determined estimates of internal consistency reliability. Data analyses showed each of STNA constructs and subconstructs to have high internal consistency reliability, where alpha ranged from .807 to .967 (Corn, 2006). The second study, using a randomly selected sample of responses from 105 schools across the United States (n=2050), included an
exploratory factor analysis that largely supported the reliability and validity of the constructs and subconstructs included in STNA 2.0 (Corn, 2007).
Findings from these pilot studies were used to modify and improve STNA. Item distributions, calculated for the initial pilot study, were used to identify items that might need to be revised. Items were reviewed if any of the following criteria were met: only one
literature source was cited, the standard deviation of the item distribution was above or below one, or “Do Not Know” responses fell more than one standard deviation above the mean. In all cases, items were confirmed, revised, or removed.
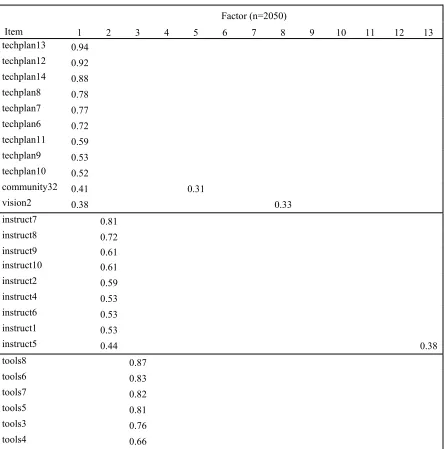
The factor loadings are reported in Table 3, which show the unique associations between each factor and the measured items, controlling for all other items.
Table 3
Pilot Test Factor Loadings for STNA 2.0 Items
Factor (n=2050)
Item 1 2 3 4 5 6 7 8 9 10 11 12 13
techplan13 0.94
techplan12 0.92
techplan14 0.88
techplan8 0.78
techplan7 0.77
techplan6 0.72
techplan11 0.59
techplan9 0.53
techplan10 0.52
community32 0.41 0.31
vision2 0.38 0.33
instruct7 0.81
instruct8 0.72
instruct9 0.61
instruct10 0.61
instruct2 0.59
instruct4 0.53
instruct6 0.53
instruct1 0.53
instruct5 0.44 0.38
tools8 0.87
tools6 0.83
tools7 0.82
tools5 0.81
tools3 0.76
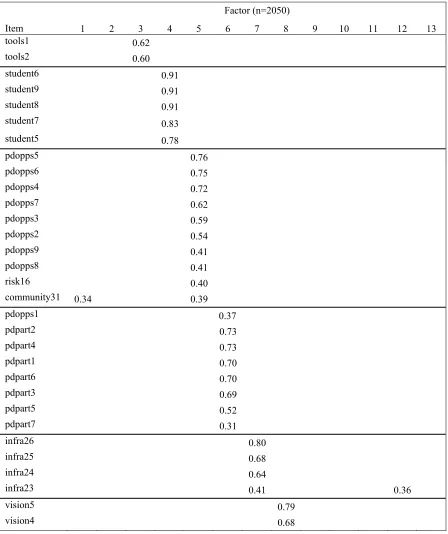
Table 3 (continued).
Factor (n=2050)
Item 1 2 3 4 5 6 7 8 9 10 11 12 13
tools1 0.62
tools2 0.60
student6 0.91
student9 0.91
student8 0.91
student7 0.83
student5 0.78
pdopps5 0.76
pdopps6 0.75
pdopps4 0.72
pdopps7 0.62
pdopps3 0.59
pdopps2 0.54
pdopps9 0.41
pdopps8 0.41
risk16 0.40
community31 0.34 0.39
pdopps1 0.37
pdpart2 0.73
pdpart4 0.73
pdpart1 0.70
pdpart6 0.70
pdpart3 0.69
pdpart5 0.52
pdpart7 0.31
infra26 0.80
infra25 0.68
infra24 0.64
infra23 0.41 0.36
vision5 0.79
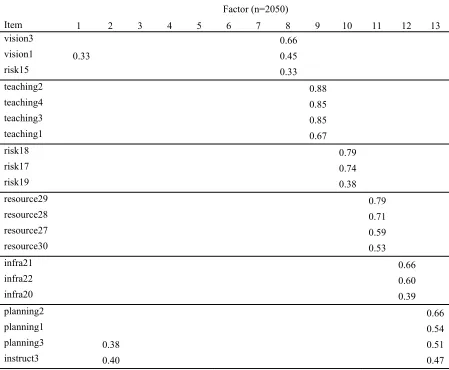
Table 3 (continued).
Factor (n=2050)
Item 1 2 3 4 5 6 7 8 9 10 11 12 13
vision3 0.66
vision1 0.33 0.45
risk15 0.33
teaching2 0.88
teaching4 0.85
teaching3 0.85
teaching1 0.67
risk18 0.79
risk17 0.74
risk19 0.38
resource29 0.79
resource28 0.71
resource27 0.59
resource30 0.53
infra21 0.66
infra22 0.60
infra20 0.39
planning2 0.66
planning1 0.54
planning3 0.38 0.51
instruct3 0.40 0.47
All factors were readily interpretable. Factor One consisted mainly of the Organizational Conditions for Technology Use: technology planning, budgeting, and
evaluation. Factor Two captured Instruction - how teachers incorporate technology into their instruction. Factor Three was labeled Information and Communication Technologies,
learn, think critically, solve problems, use information, communicate, innovate, and collaborate (Partnership for 21st Century Skills, 2006a). Factor Four consisted of Student Outcomes, or the intended objectives for students in schools where technology is used effectively. Factor Five included items that addressed technology Professional Development Opportunities for persons in the school, and Factor Six spoke to respondents’ Professional Development Participation. Items loading on Factor Seven related to access to adequate technical and instructional technology for Staff Support. The items in Factor Eight were collectively called Vision and Shared Leadership as they dealt with a clear vision and administrative support for technology use. Factor Nine encompassed Teaching Practices or intended impacts on teachers in schools where technology is used effectively. Factor Ten was one of the new constructs identified. The items in this factor specifically addressed the issue of Flexible Scheduling of the media center, computer lab, and mobile computers. Access to Media and Software resourcesis collectively addressed in Factor Eleven. Factor Twelve focused on the current status of the school’s technology Infrastructure – hardware, networks, connectivity, etc. Lastly, Factor Thirteen spoke to teachers use of technology for Planning purposes.
originally STNA included a section on Technical Infrastructure and Support, whereas the factor analysis revealed this construct should be broken into two separate areas – described previously as Staff Support and Infrastructure. Additionally, the section focusing on professional development completely revised into two sections focusing on Professional Development Needs and Quality of Previous Professional Development.
Based on the result of this EFA, the following revisions were done: a few subconstructs were reordered and regrouped, some constructs and subconstructs were renamed for clarity, IMPACT-specific {Public Schools of North Carolina, 2005 #72} items were grouped together, and professional development construct was collapsed into two sub-sections which allowed for the elimination of the “Yes-No-Do Not Know” response set. Items within the professional development and classroom practices sections were aligned to provide cross-construct comparisons. Consequently, 12 factors emerged based on the results of the EFA and subsequent revision to STNA.
Items
Developed by NCREL with the Metiri Group, the enGauge framework provides a comprehensive view of critical factors in an educational system that strongly influence the effectiveness of educational technology. enGauge is a Web-based framework and set of tools designed to help schools and districts use technology effectively for learning, teaching, and managing. The enGauge framework identifies Six Essential Conditions, system (district) wide factors critical to effective uses of technology for student learning (Lemke, 2002; North Central Regional Educational Laboratory, 2000).
Developed by CEO Forum on Education and Technology, the STaR Chart identifies and defines four school profiles ranging from the "Early Tech" school with little or no technology to the "Target Tech" school that provides a model for the integration and innovative use of education technology. The STaR Chart is not intended to be a measure of any particular school’s technology and readiness but rather to serve a benchmark against which every school can assess and track its own progress (CEO Forum, 2000b).