| INVESTIGATION
Inference and Analysis of Population Structure
Using Genetic Data and Network Theory
Gili Greenbaum,*,†,1Alan R. Templeton,‡,§and Shirli Bar-David† *Department of Solar Energy and Environmental Physics and†Mitrani Department of Desert Ecology, Blaustein Institutes for Desert Research, Ben-Gurion University of the Negev, 84990 Midreshet Ben-Gurion, Israel,‡Department of Biology, Washington University, St. Louis, Missouri 63130, and§Department of Evolutionary and Environmental Ecology, University of Haifa, 31905 Haifa, Israel
ABSTRACT Clustering individuals to subpopulations based on genetic data has become commonplace in many genetic studies. Inference about population structure is most often done by applying model-based approaches, aided by visualization using distance-based approaches such as multidimensional scaling. While existing distance-distance-based approaches suffer from a lack of statistical rigor, model-based approaches entail assumptions of prior conditions such as that the subpopulations are at Hardy-Weinberg equilibria. Here we present a distance-based approach for inference about population structure using genetic data by defining population structure using network theory terminology and methods. A network is constructed from a pairwise genetic-similarity matrix of all sampled individuals. The community partition, a partition of a network to dense subgraphs, is equated with population structure, a partition of the population to genetically related groups. Community-detection algorithms are used to partition the network into communities, interpreted as a partition of the population to subpopulations. The statistical significance of the structure can be estimated by using permutation tests to evaluate the significance of the partition’s modularity, a network theory measure indicating the quality of community partitions. To further characterize population structure, a new measure of the strength of association (SA) for an individual to its assigned community is presented. The strength of association distribution (SAD) of the communities is analyzed to provide additional population structure characteristics, such as the relative amount of geneflow experienced by the different subpopulations and identification of hybrid individuals. Human genetic data and simulations are used to demonstrate the applicability of the analyses. The approach presented here provides a novel, computationally efficient model-free method for inference about population structure that does not entail assumption of prior conditions. The method is implemented in the software NetStruct (available at https:// giligreenbaum.wordpress.com/software/).
KEYWORDScommunity detection; hierarchical population structure; modularity; subpopulations
I
NFERENCE of population structure from genetic data isoften used to understand underlying evolutionary and de-mographic processes experienced by populations, and is an important aspect of many genetic studies. Such inference is mainly done by clustering individuals into groups, often re-ferred to asdemesorsubpopulations. Evaluation of population
structure and gene flow levels between subpopulations
al-lows inference about migration patterns and their genetic
consequences (Templeton 2006; Allendorfet al. 2012). As
sequencing of larger portions of the genome is becoming more readily available, there is an increasing need for a variety of computationally efficient statistically testable methods for such inference.
Analysis of population structure can be done at the subpopulation-population level by assuming putative subpopulations and studying how these relate genetically
[e.g., F-statistics, analysis of molecular variance (AMOVA)
(Excoffieret al.1992), phylogenetic methods (Cavalli-Sforza and Edwards 1967; Saitou and Nei 1987; Pickrell and Pritchard 2012)], or at the individual subpopulation level by attempting to cluster individuals to subpopulations. The methods for clustering individuals based on genetic data can be further divided into two categories: model-based
ap-proaches and distance-based apap-proaches (Pritchard et al.
Copyright © 2016 by the Genetics Society of America doi: 10.1534/genetics.115.182626
Manuscript received September 7, 2015; accepted for publication February 3, 2016; published Early Online February 16, 2016.
Supplemental material is available online atwww.genetics.org/lookup/suppl/doi:10. 1534/genetics.115.182626/-/DC1.
2000; Alexander et al. 2009; Wollstein and Lao 2015). Model-based approaches evaluate the likelihood of the observed data, assuming that they are randomly drawn from
a predefined model of the population, e.g., that there
are Ksubpopulations and that these subpopulations are at
Hardy-Weinberg equilibrium (HWE). Distance-based ap-proaches aim at identification of clusters by analysis of ma-trices describing genetic distances or genetic similarities between individuals or populations,e.g., by visualization us-ing multidimensional scalus-ing (MDS) methods such as princi-ple components analysis (PCA). Distance-based methods are usually model-free and do not require prior assumptions, as with the model-based methods. Over the last decade or so, model-based methods have been more dominant as procedures for inference about population structure, mostly with implementation of Bayesian clustering and maximum-likelihood techniques in programs such as STRUCTURE,
ADMIXTURE (Alexanderet al.2009), and BAPS (Corander
et al. 2003). It has been pointed out that distance-based
methods have several disadvantages (Pritchard et al.
2000): they are not rigorous enough and rely on graphical visualization, they depend on the distance measure used, it is difficult to assess the significance of the resulting clustering, and it is difficult to incorporate additional information such as geographic location of the samples. Jombartet al.(2008), and Yanget al.(2012) address this last concern. Given these disadvantages, it would seem that distance-based measures are less suitable for statistical inference about population structure. However, model-based approaches suffer from the need to restrict interpretation of the results by heavily
relying on the prior assumptions of the model, e.g., that
the populations meet certain equilibria conditions such as migration-drift or HWE (Pritchardet al.2000).
There has recently been a flourish of network theory
applications to genetic questions in genomics (Forst 2002),
landscape genetics (Garroway et al.2008), and population
structure at the subpopulation-population level (Dyer and
Nason 2004; Rozenfeldet al.2008; Ballet al.2010; Munwes
et al. 2010). Recently, a network-based visualization tool,
NETVIEW (Neuditschko et al. 2012), of fine-scale genetic
population structure, using a superparamagnetic clustering algorithm (Blattet al.1996), has been proposed and applied
successfully to analysis of livestock breeds (Burren et al.
2014; Neuditschkoet al.2014), and other network clustering approaches have also been implemented on genetic data (Cohenet al.2013). However, these methods still suffer from the many disadvantages of distance-based clustering ap-proaches, and a more rigorous and statistically testable distance-based approach is still missing.
Development of a suitable distance-based network approach that will coherently address inference about population structure from genetic data, and not suffer from the disadvantages listed earlier, necessitates a clear defi ni-tion of genetic populani-tion structure in equivalent network
theory terminology. A genetically defined subpopulation is
commonly thought of as a group of individuals within a
population who are more genetically related (or more genet-ically similar) to each other than they are to individuals outside the subpopulation, as a result of many possible genetic processes such as genetic drift, migration, mutation, and selection. In a network, a group of nodes that are more densely and strongly connected within the group than outside the group relative to the given topology of the network is called
a community (Newman and Girvan 2004). Therefore, in
network theory terminology, the equivalent of a genetic population structure should be the community partition of a network constructed with individuals as nodes and edges defined using an appropriate genetic distance or similarity measure. In network science, clustering nodes into groups has been studied extensively, and specifically community de-tection has attracted much interest (Girvan and Newman
2002). Because there is no single rigid definition of a
community, and because identifying optimal partitions is computationally expensive, many approaches and algo-rithms to optimally detect communities in networks have been proposed (Lancichinetti and Fortunato 2009; Fortunato 2010).
We propose a network-based approach for analyzing population structure based on genetic data. We show that by applying recent advances in network theory, it is possible to design a distance-based approach that overcomes the limitations of other distance-based approaches, and does not suffer from the disadvantages of model-based ap-proaches. We also show how rigorous statistical inference can be incorporated into this network-based approach in a manner that does not entail prior assumptions or conditions about the data.
The process can be used with a large number of loci (e.g., microsattelites or SNPs) because it is computationally effi -cient in regard to the number of loci incorporated in the anal-ysis. Moreover, we define a new measure for the strength to which an individual is associated with its assigned
commu-nity, called strength of association(SA), and we show how
strength of association distribution (SAD) analysis can be used to infer further details regarding population structure,
such as geneflow patterns of each subpopulation and
iden-tification of potentially hybrid individuals. The analysis is demonstrated on genetic data from the human population extracted from the HapMap Project (International HapMap Consortium 2003), as well as on simulated data. In addi-tion to presentaaddi-tion of a new distance-based method for population structure inference, we believe that defining the problem of genetic population structure analysis in network terminology will allow future adoption and adaptation of network methods and techniques to address population genetic questions.
Methods
partitions in these networks. Following detection of commu-nity structure, we propose an additional exploratory analysis, based on a measure of the strength of association of individ-uals to communities, that may shed light onfiner details of the community structure and therefore on the population structure.
Constructing networks from genetic data
A networkis a set of discrete entities, nodes, where each
pair of nodes may be connected by anedge, possibly
char-acterized by aweight. Networks can be described by
adja-cency matrices, where the element in columniand rowjis
the weight of the edge connecting nodeiand nodej. For
most network applications, dyads connected by edges with high-valued weights are interpreted as being strongly connected. Therefore, a genetic-similarity matrix (a matrix describing some measure of genetic similarity or related-ness between all pairs of individuals, based on their genotypes) of a population also can be regarded as the adjacency matrix of a genetic-similarity network. The more classic genetic-distance (genetic dissimilarity) matrices are similar, except that in these, high values indicate weakly connected dyads, and therefore, such matrices must be appropriately transformed to be considered network adja-cency matrices. There is no fundamental difference, for our purpose, between similarity and distance matrices. Many genetic similarity, distance, and relatedness measures have been proposed (Oliehoeket al.2006), but if we restrict the discussion to symmetric similarity measures, where
simi-larity between individual i andj is the same as between
individualjandi, the genetic network thus described is a
weighted undirected network, in which each edge is char-acterized by a weight but does not have directionality. Be-cause we would like to consider not only allele sharing between individuals but also differences in allele frequen-cies between subpopulations, we further restrict the dis-cussion to genetic similarity measures that are expressed relative to allele frequencies in a reference population,i.e., measures that incorporate the allele frequencies of the total sampled population. These measures should not incorporate allele frequencies other than those of the total sample (e.g., allele frequencies in sample sites or other
locally defined sampled populations) because this would
mean that the null hypothesis is other than that there is no population structure. From a distance-matrix perspective, the null hypothesis is that the adjacency matrix, appropri-ately transformed, is a symmetric individual-pairwise dis-tance matrix such that all individuals are equally distant from the multilocus centroid of the total population with no subclustering.
In a network such as that just described, the strength of the connection between each dyad is relative to the genetic similarity between them, where shared rare alleles convey a stronger connection than do common alleles. This is differ-ent from many commonly used distance measures for con-struction of individual-level distance matrices, such as in
AMOVA (Excoffier et al.1992), where distances are
mea-sured by mismatch of alleles, regardless of their frequencies. Because even unrelated individuals may share many alleles, especially when many loci are examined, it is likely that this network will be extremely dense. It therefore may be useful, both from a computational point of view and in order to emphasize strong genetic relations within the population so as to increase the detection power of network procedures, to remove edges that describe weak connections. This can be done in different ways, but the most straightforward ap-proach is to remove edges with weights below a certain threshold, which is the approach we implement here. In this way, a sparser network that consists of strong relatedness interconnections is attained.
Because using different thresholds will result in different networks that may give, for the analyses that follow, differ-ent population structures, we recommend systematically exploring different threshold values. For very low threshold values, many weak relatedness interconnections will be included in the network, which may result in very dense networks that could mask related groups within the population. Very high thresholds may result in the net-work breaking down into many disconnected components
(a network component is a group of nodes that are
connected within themselves but are not connected to any other node in the network), up to a point when the network includes only very small groups of connected nodes. Such networks are most likely not informative of population structure because they represented too few re-lated dyads, and the community partition likely will consist of many one- or two-node communities. Each community
is confined to be within a component, and if the network
consists of many small components, then the community partition is constrained to include many small commu-nities. Therefore, the informative structures should be detected at the intermediate thresholds, and different thresh-olds in this range may describe structure at different hierar-chical levels (seeAnalysis of human SNP datafor an example of a systematic exploration of threshold values).
Network communities and genetic population structure
In network theory, the termcommunityrefers to a subset of
nodes in a network that are more densely connected to each other than to nodes outside the subset (Newman 2006). There are now several algorithms for efficiently partitioning a network into communities (Lancichinetti and Fortunato 2009; Fortunato 2010). Most commonly, a partition of a network into communities is evaluated by calculating the
modularityof the partition, a quality measure (between21
and 1) indicating whether the partition is more or less mod-ular than would be expected if connections were randomly distributed (Newman 2004b). The modularity of a
particu-lar community partition of a weighted networkA(a network
network preserving the edge weights of each node (Newman 2004a):
Q¼ 1
A*
X
i;j
Aij2
1 A* X k Aik X l Alj !
dðci;cjÞ (1)
whereA*¼P
k;lAlk is the sum over all edge weights in the network, anddðci;cjÞis a delta function with value 1 if nodes iandjare in the same community and 0 otherwise. A positive modularity value indicates that the partition is more modular than expected. Many community-detection algorithms try to approximate an optimal partition, in which the modularity measure is maximal over all possible partitions. A partition consisting of one community, which includes all nodes in the network, results in a modularity of zero, and therefore, for every network, the optimal partition, maximizing the modu-larity, is always nonnegative. Community-detection
algo-rithms do not generally require a priori knowledge of the
number of clusters present in the network.
Because in a genetically subdivided population the indi-viduals in a subpopulation are expected to be more highly related in comparison to a random redistribution of related-ness levels between individuals, communities in the genetic network are expected to coincide with the subpopulations of the underlying population structure. We therefore propose that population structure can be ascertained by constructing a genetic network based on a genetic similarity measure and then applying community-detection methods to identify a partition that maximizes modularity. Because it is possible that an optimal partition consists of just one community (i.e., the entire network), community-detection algorithms also can identify scenarios with no population subdivision.
A partition of the network into two or more communities may be indicative of population structure, but community partitions also may be detected in panmictic populations owing to chance alone. In order to test whether the detected population structure is significant, we test whether it is sig-nificantly different from the null hypothesis of no population structure. Several approaches have been suggested to
evalu-ate the statistical significance of community partitions
(Fortunato 2010), but here we pursue a significance test
based on permutations of the genetic network that focuses on testing whether the null hypothesis can be rejected or not. With no population structure, dense subgraphs are not expected to appear in networks constructed as described ear-lier, and if such subgraphs do appear, the modularity of an optimal partition of the network should be relatively low. In randomly permuted networks, dense subgraphs are expected to be present as often as in unstructured populations, and hence, optimal partitions of permuted networks can be used to represent the expected modularity of optimal partitions of unstructured populations. If the modularity of the detected
community partition is not significantly higher than
modu-larities of optimal partitions of the permuted networks, we cannot reject the null hypothesis. We can therefore use
permutations to test the statistical significance of detected community partitions.
With application of this significance test, population
genotypes are considered to describe a structured population if, and only if, more than one community is detected, and the detected partition is more modular than would be expected in a population with no structuring. Preferably, the permutation should be done at the level of the genotypes because this will ensure that all structural properties of the the permuted network, such as the degree
distribution and global clustering coefficient (Opsahl and
Panzarasa 2009), will be similar to those of the original network. However, permutations of the genotypes require constructing many matrices, which would be computation-ally expensive when many loci are involved. As an alterna-tive, permutations can be done at the adjacency matrix level, with symmetry-preserving permutations of the ma-trix. Such permutations will preserve the main structural property of the network, the edge degrees, but not the global clustering coefficient. While, in practice, this should not affect the modularity of optimal partitions because
the clustering coefficient measures clustering only at the
immediate-neighbor level and not the modular structure of the network, permutation of genotypes should be used whenever feasible.
Strength of association distribution (SAD) analysis
Revealing the division of the population into subpopulations may shed light on many aspects of the underlying evolutionary and ecological processes, but more information can be attained by further analyzing the characteristics of the parti-tion. The partitioning of the network into dense subgraphs, as presented earlier, does not convey information regarding how important each individual is to the detected partition. Here we introduce a measure intended to evaluate this aspect, the strength of association(SA) of individualito its community. Given a community partitionCand an individuali, we define the strength of associationSAas
SAðC;iÞ5min
k CkðiÞ6¼C
QC2QCkðiÞ
(2)
whereQCis the modularity of the partitionC, andCkðiÞis the partition identical toCexcept that nodeiis assigned to
com-munity k instead of its original community. Thus high SA
values indicate that the partitionCis sensitive to the
assign-ment ofi and that the assignment ofi to its community is
essential, whereas low SAvalues indicate that there is
an-other community that the individual is well assigned to. From a population genetics perspective, the measure evaluates how strongly individuals are related to the group to which
they were assigned, andSAis expected to be low when
indi-viduals are recent descendants from indiindi-viduals from more than one subpopulation. For example, potential hybrids are
Equation 2 is the probable origin of the second lineage of the individual (seeIdentifying hybrids and recently admixed
indi-vidualsfor an example).
TheSAmeasure is a measure at the individual level, taking into account genetic data of the entire population. We intro-duce an exploratory analysis that evaluates characteristics of subpopulations relating to the cohesion of the subpopulation and the association of individuals with the subpopulation, the strength of association distribution(SAD) analysis. This anal-ysis examines the distribution of theSAvalues of the different communities and compares the statistical attributes of these
distribution (e.g., the mean, variance, and skew of the SA
distributions). Because different scenarios are expected to result in different cohesions of the subpopulations, it may
be possible to hypothesize what underlying processes were responsible for shaping the genetics of the population.
For example, a closed, disconnected subpopulation is expected to display a narrow SAD with a high mean (high community cohesion) because, in a closed population, indi-viduals will be strongly related relative to the entire population, and individuals descended from lineages outside the subpopulation are rare. A subpopulation experiencing
constant moderate gene flow levels is expected to display a
wide or left-skewed SAD with a high mean because there should be many individuals with lineages that are mostly from the subpopulation, but recent migrants and descendants of recent migrants are expected to have lowSAvalues, increas-ing the variance and the left-skewness of the distribution.
A subpopulation experiencing constant strong gene flow levels is expected to display a SAD with a low mean because many individuals will be descendants of migrants.
Analysis of human SNP data
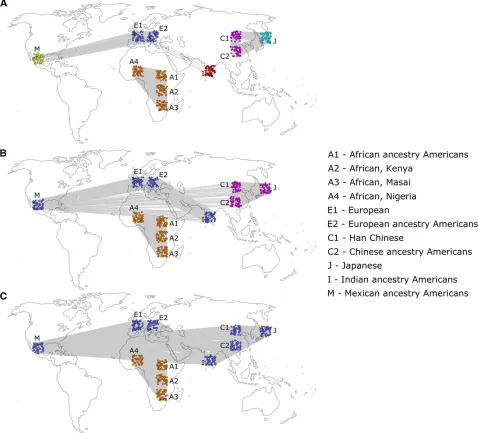
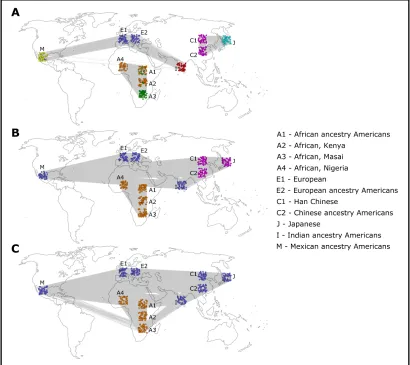
In order to demonstrate the applicability of the network approach to infer population structure and the SAD analysis, we have selected a set of human SNP data extracted from the HapMap database (International HapMap Consortium 2003). This data set is well suited for the demonstration of a new approach because it is taken from a population in which structure and demographic history are well known from archaeological, historical, and genetic studies. The genetic data for this analysis consisted of 50 randomly se-lected individuals from each of the 11 sampled populations of the HapMap Project (overall, 550 individuals): African-ancestry Americans (A1), Africans from West Kenya (A2), Masai Africans (A3), Africans from Nigeria (A4), Europeans from Italy (E1), European-ancestry Americans (E2), Han Chinese (C1), Chinese-ancestry Americans (C2), Japanese (J), Indian-ancestry Americans (I), and Mexican-ancestry Americans (M). 1000 polymorphic SNPs from each auto-some were randomly selected (overall 22,000 sites per individual). In order to compare the results with a model-based approach, the same data were analyzed with the most widely used model-based software, STRUCTURE (Pritchard et al.2000).
Network construction
A genetic network was constructed from the genotypes (with-out any information on the original grouping of the individ-uals) using, for calculation of genetic similarity, a simple symmetric frequency-weighted allele-sharing similarity measure. Analogous to the molecular similarity index (Li
and Horvitz 1953; Oliehoek et al. 2006), we defined the
frequency-weighted similarity at locuslfor diploid individual
iwith allelesaandb, with frequenciesfaandfb(in the total sample), respectively, and individualjwith allelescandd:
Sij;l¼
1
4½ð12faÞðIacþIadÞ þ ð12fbÞðIbcþIbdÞ (3) whereIacis 1 if allelesaandcare identical and 0 otherwise, and the other indicators are similarly defined. Note that this measure is a multiallelic measure and is commutative with respect toiandj. Given a sample withLloci, the weight of the
edge connecting individualsiand jis defined as the mean
frequency-weighted similarity over all loci:
Aij¼
1 L
XL
l¼1
Sij;l (4)
The relatedness measure defined in Equation 3 is a very simple symmetric relatedness measure that measures diversity rela-tive to the entire population, because it takes into account the allele frequencies at the level of the entire population (with sharing of rare alleles conveying a stronger connection than sharing of common ones). Other, more sophisticated, mea-sures are likely to construct more accurate networks, and may be specific to the type of marker considered (e.g., for microsatellites, the length of the repeat might be taken into account) or include additional information (e.g., geographic locations of the samples). The formulation presented here is designed to analyze diploid populations, but it can be easily generalized to any level of ploidy.
Community partition
Currently, many algorithms are used for detecting population structure, relying on different network theory concepts [reviewed by Lancichinetti and Fortunato (2009) and Fortunato (2010)]. We have used several of the commonly employed algorithms, implemented using igraph (Csárdi and
Nepusz 2006); they are presented inSupplemental Material,
File S1, and we show here the results from the classic Girvan-Newman algorithm (Girvan and Girvan-Newman 2002). Results using different algorithms are not qualitatively different.
The edge-removal threshold parameter was explored sys-tematically by examining thresholds from 0 until all edges were removed in steps of 0.001. For very low thresholds
(0–0.181), the constructed networks were very dense, and
no population structure was detected (a single community, that included all nodes, was detected). As mentioned earlier, this is to be expected from all but the most distinctly struc-tured populations because including connections between very weakly related individuals decreases the capability of the community-detection algorithms to detect dense subgraphs within the network. For very high thresholds
(.0.209), the networks break up into many disconnected
components, many of which include only one or two nodes. Such networks cannot be coherently analyzed for communi-ties (seeMethods).
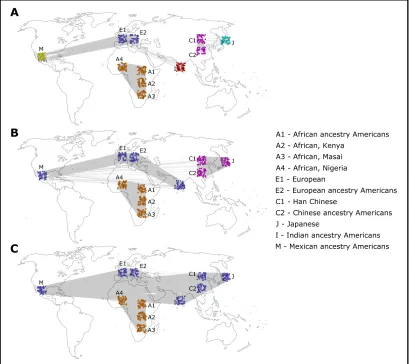
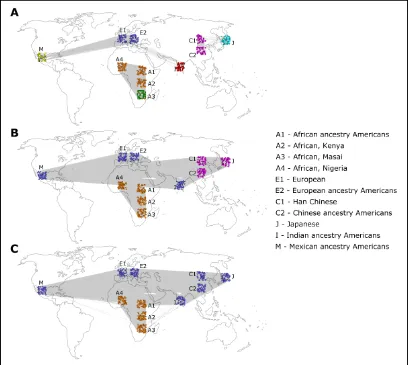
For thresholds between 0.182 and 0.208, different com-munity partitions were detected for different threshold ranges
(Figure 1). For thresholds in the range 0.182–0.188, two
communities were detected, and Figure 1C shows results for threshold 0.188, referred to as“low threshold”. For the
range 0.189–0.195, three communities were detected, and
Figure 1B shows results for threshold 0.194, referred to as
“medium threshold”. For thresholds above 0.196, the
net-work was no longer connected and broke into several com-ponents, most notably a dense East Asian component, and the rest of the network was composed of one or more
compo-nents. For the range 0.196–0.200, one community was
de-tected in the East Asian component and four communities in the rest of the network. For thresholds above 0.201, only the East Asian component remained intact, while the rest of the network broke into many small components and could no longer be meaningfully analyzed. The East Asian component
consisted of one community for the threshold range 0.196–
0.206 and two communities for the threshold range 0.207–
0.208. Figure 1A shows the results of the community partition with threshold 0.207 of the East Asian component, with two communities, and for threshold 0.198 for the rest of
the network, with four communities (referred to as “high
threshold”). Within the edge-removal threshold ranges men-tioned earlier, there was no significant change in the assign-ment of the individuals to communities. Therefore, three qualitatively different community partitions of the network into communities have been found by systemically testing different edge-removal thresholds, with either two, three, or six communities for low, medium, and high thresholds, respectively (Figure 1).
Permutation tests using 1000 permutations of the geno-types were conducted, and all detected community partitions were strongly significant (P#0.001). With the low threshold, the partition corresponded to an African–non-African
divi-sion (Figure 1C), with the medium threshold to an African–
Indo-European–East Asian division (Figure 1B) and with the high threshold to one of six communities: African, Indian,
European, Mexican, Chinese, and Japanese (Figure 1A) (Some of the other community-detection algorithms also de-tected the Masai population as a distinct community for the high threshold; seeFile S1.) The trend where higher thresh-olds reveal more detailed structure is correlated with the historically known patterns of human population differenti-ation. The low-threshold coarse division of the population
into two groups corresponds with the more ancient“
out-of-Africa” migrations, the medium-threshold division of the
Eurasian population corresponds with the more recent mi-grations to Asia and the long-lasting Indo-European ethnic ties, and lastly, the high thresholds correspond with the most recent events of migration and isolation leading to the for-mation of cohesive populations in India, Japan, and Mexico. The analysis with STRUCTURE was done for different
K values (K is the number of subpopulations assumed by
the model). There is no statistical test available to evaluate the significance of the results for different models, but the most widely used heuristic is the one presented by Evanno et al.(2005). This heuristic shows that the most likelyKvalue
is K =2, butK =3 andK =6 are also indicated as likely
values (File S2, Figure A). ForK =2 andK =3, the partition was the same as with the network approach (File S2, Figure B). ForK =6, the detected partition consisted offive of the six subpopulations detected by the network approach: African,
Indian, European, Mexican, and East Asian. The Japanese–
Chinese division was not detected, but the Masai individuals, assigned to the African subpopulations, also were shown to likely belong to a sixth subpopulation (File S2, Figure B).
SAD analysis
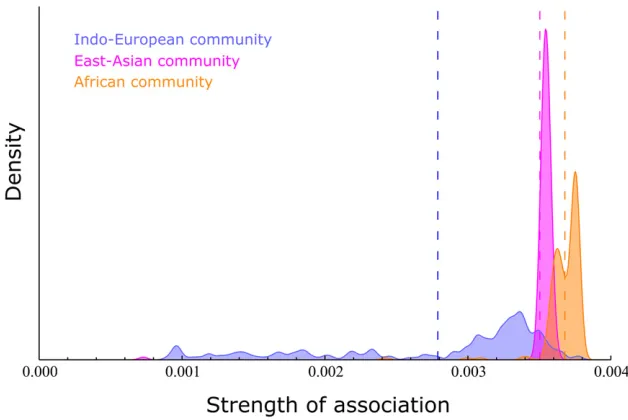
As a demonstration of the SAD analysis, the network with medium threshold (Figure 1B) was analyzed, and the
distri-bution of theSAvalues for the three communities detected
are shown in Figure 2. Figure 3 shows the equivalent analysis of the model-based results using STRUCTURE and assuming
three subpopulations (K =3).
The SAD of the East Asian community (Figure 2) has a high mean and is a very narrow distribution, consistent with a
subpopulation experiencing limited gene flow. This can be
explained by the known historical trend of the relative isola-tion of East Asia from Europe and Africa.
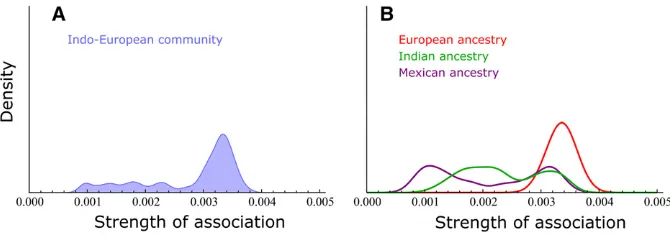
The SAD of the Indo-European community (Figure 2) is the
one with the lowest mean SA and is a wide, left-skewed
distribution, consistent with a subpopulation with defined
core and periphery that experienced extensive geneflow rel-ative to the other subpopulations. Given that the individuals
belonging to this community are from European, Indian, or Mexican ancestry, a probable explanation is that the core consists of the two European sampled populations and that the Indian- and Mexican-ancestry individuals have lower as-sociation with this group. This can be clearly observed when the distribution is decomposed to three distributions based on the sampled populations (Figure 4).
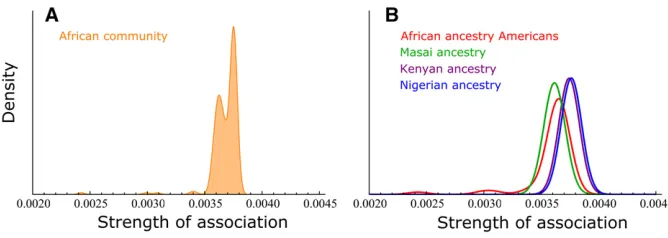
The distribution of the African community (orange) has a high mean and is narrow and bimodal. This is consistent with a
cohesive subpopulation with limited geneflow but also that
two or more distinct subgroups exist within the population, with different levels of association with the community. Figure 5 shows the decomposition of the distribution to the four sampled populations composing it, and it can be seen that the the bimodality can be explained by the fact that the Masai population (A3) is found to be a distinct population, as detected by some of the community-detection algorithms (File S1). The STRUCTURE analysis also points out to this possibility; as forK =6, it seems that the Masai individuals could possibility be assigned to a different subpopulation, although they are more likely to be assigned to the African subpopulation (File S2).
Comparing these results with the results from the model-based analysis, both methods show that the African subpop-ulation is composed of the same group of individuals (Figure 1B and Figure 3). With the model-based analysis, it can be seen that while individuals from Kenya (A2) and Nigeria (A4) have almost no probability to be assigned with other subpop-ulations, African-ancestry Americans (A1) and Masai individ-uals (A3) have a nonnegligible probability of being assigned to other subpopulations, which could be interpreted as that these two groups, while belonging to the African
subpopula-tion, have experienced more geneflow from other
subpopu-lations, mostly from the Indo-European subpopulation. This finding is similar to that found with network analysis: these
groups are likely to have experienced more geneflow,
indi-cated by the lower mean SA of both Masai and
African-ancestry Americans than that of the Nigerian and Kenyan
groups (Figure 5). However, the SAdistributions of A1and
A3are quite different, which implies different evolutionary histories. The A1SAD is skewed with a long left tail, indicat-ing that there are a number of African-ancestry Americans who are significantly less associated with the community and
are possibly recently admixed individuals. The A3SAD has a
low mean but is symmetric without a wide or skewed tail, possibly indicating that the Masai population has
experi-enced more geneflow, but not in recent times. The recent
admixture in the African-ancestry Americans group is consis-tent with recent higher geneflow experienced by the African-ancestry Americans from other American groups.
Analysis of simulated data
In order to get a better intuition on the performance of the method, and specifically on the SAD analysis and detection of hybrid and recently admixed individuals, several scenarios were simulated. These simulations consisted of three diploid populations (P1, P2, and P3) of sizeN(2Nhaploids) that split Ngenerations ago from an ancestral population, also of size N. Following the split, migration is assumed to have
oc-curred only between P1and P2at ratem(proportion of the
population per generation). This allowed us to explore the effects of geneflow between P1and P2in comparison with an isolated population, P3. Four scenarios with different levels of
geneflow between P1and P2were examined: no geneflow
(S1), low geneflow (S2), medium geneflow (S3), and high
geneflow (S4). Table 1 summarizesmvalues for the different scenarios. The coalescence process for 5000 independent
SNPs and forN = 50 was simulated using the coalescence
simulator SIMCOAL2 (Laval and Excoffier 2004).
SAD analysis of simulated scenarios
For the four simulated scenarios, genetic networks were constructed using Equation 4, as done for the human genetic data explained earlier. Community detection, using the com-putationally efficient Fast Greedy algorithm (Clauset et al. 2004), was performed for edge-removal thresholds starting from 0 in steps of 0.01 until the network was decomposed to
many disconnected components. In scenarios S1and S2, three
communities were detected for all thresholds examined, fully corresponding with the three simulated populations (we therefore refer to these communities as P1, P2, and P3). In scenario S3, two communities were detected for low
thresholds (0–0.04), fully corresponding to the combined
population of P1and P2and to population P3(we refer to
these as P1P2and P3), while for high thresholds (0.05), three communities were detected, fully corresponding to the three simulated populations. For scenario S4, two communities
were detected, as for low thresholds in S3. The results are summarized in Table 1, with further details given inFile S3.
When geneflow was at most medium, the three simulated
subpopulations were recovered by community detection, while for high geneflow the procedure was unable to
distin-guish between P1 and P2. In addition to the detection of
subpopulations as the units of structure, the procedure also provided information on hierarchical population structure.
For medium geneflow, the low edge-removal thresholds P1
and P2were detected as one community, P1P2, and two
sep-arate communities for high edge-removal thresholds. The structure at the two hierarchical levels was detected only at
intermediate geneflow levels—with low or high geneflow,
the same community structure was detected at all thresholds because structure at one hierarchical level was much stronger and masked the structure at the other level.
TheSAfor all individuals was calculated, and the SAD of
the communities was characterized by the mean and coeffi
-cient of variation (CV) as a measure of dispersion. The analysis was done for networks with high edge-removal
thresholds (before network decomposition), but no signifi
-cant differences were observed for lower thresholds. While
for S1there was no difference in SAD mean of the three
de-tected communities, for the three communities dede-tected in S2 and S3 the mean was significantly higher for P3 (File S2,
Figure A). The lower association of individuals from P1and
P2to their assigned communities relative to P3can be
attrib-uted to geneflow between these subpopulations. When two
communities were detected, the mean for P3also was higher
than the mean for P1P2(File S3, Figure A); however, in this case, it is not possible to tell whether this is a result of gene flow between P1and P2or a result of the different number of
individuals in P1P2and P3. Subpopulations represented by a
smaller sample size may show higherSAvalues due to the
fact that common alleles in these subpopulations may be rare in the entire sample (rare alleles in Equation 3 result in edges with higher weights), whereas alleles common in subpopu-lations with large sample sizes should be relatively com-mon in the entire sample, even if they are rare in other subpopulations.
SAD dispersion also may be an indicator of gene flow
because dispersed SA distributions should occur when
lineages of many individuals are shared with other subpop-ulations. While for S2there was no noticeable difference in dispersion between the communities, for S3(high threshold), the CV of P3was significantly smaller than for P1and P2(File
S3, Table A). For the networks where P1 and P2were not
distinguished (S4and low thresholds in S3), there was no
significant difference in dispersion between the communities. Generally, the CV was very low, except for subpopulations
experiencing medium gene flow levels, in S2 (File S3,
Table A). These results indicate that the high levels of SAD dispersion can be used as an indicator for intermediate levels of geneflow. Overall, the characteristics of the distribution of individual’sSA, specifically the mean and CV, are correlated with geneflow levels and allow for the distinction among the four simulated scenarios.
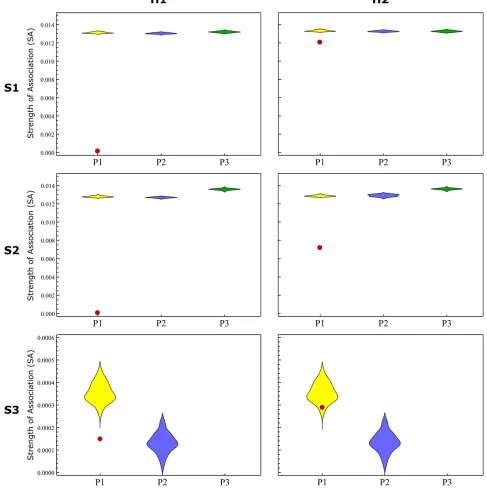
Identifying hybrids and recently admixed individuals
Genetically identifying hybrids or recently admixed individ-uals of two or more distinct subpopulations is the focus of many studies in ecology and conservation biology (Beaumont
et al.2001; Anderson and Thompson 2002; Allendorfet al.
2012). The simulated scenarios were used to test the ability of SAD analysis to identify hybrids (offspring of individuals from two different subpopulations) and recent descendants of hybrids. In each scenario, afirst-generation hybrid, H1, was
simulated by randomly selecting one individual from P1and
one individual from P2and generating a random offspring
from the parents’genotypes. Similarly, H1was backcrossed
with a randomly selected individual from P1 to produce a
second-generation hybrid, H2. These individuals then were added to the simulated population, and the SAD was ana-lyzed to see whether the hybrid individuals could be identi-fied as outliers (the analysis was done separately for H1and H2). This process was repeated 20 times in all scenarios where the three subpopulations were identified (S1, S2, and high threshold of S3).
Because all repeated simulations showed similar results qualitatively, we show only one example of the outlier iden-tification process (Figure 6). For S1and S2, both H1and H2
were easily identified as outliers with noticeably lower
SAvalues than the rest of the individuals in their assigned
community. For S3, H1was revealed as a hybrid with lower
SAvalues, but H2was not.
In all cases where H1or H2were identified, Equation 2 was
examined to determine whichkminimized the equation. This
was done to identify the second subpopulation with which the hybrid individual was associated. The second population of origin was identified for H1in all scenarios, while for H2it was recovered only for low levels of geneflow. Further details regarding identification of hybrid individuals and more de-tailed results appear inFile S3. The results of these simula-tions show that outliers ofSAdistributions may be considered to be potential hybrids, but the ability of the method to iden-tify such individuals decreases with decreasing differentia-tion between the populadifferentia-tions in quesdifferentia-tion, as well as with the number of generations after the hybridization event.
Data availability
File S1contains details on community detection algorithms and analysis of the human genetic data using various
algo-rithms. File S2 contains the detailed STRUCTURE analysis
results on the human genetic data.File S3contains additional details of the analysis of the simulated data. The Mathematica
code for running NetStruct can be found at giligreenbaum.
wordpress.com/softwareandgithub.com/GiliG/NetStruct.
Discussion
We present a model-free distance-based approach for analysis of population structure at the individual-subpopulation level that does not entail the assumption of an underlying model or any prior conditions. The approach is set in a network theory
framework and uses the concepts ofcommunity and
modu-larity, which allow for computationally efficient assignment
of individuals to subpopulations. The computational effi
-ciency also makes this approach applicable in cases where many loci are studied. An additional exploratory analysis of theSAdistributions of the communities can be used to study population structure beyond assignment of individuals to populations by evaluating the strength with which individu-als are associated with their assigned subpopulations. This may be useful to detect hybrid and recently admixed
individ-uals, as well as to explore finer details of the population
structure, as demonstrated by analysis of simulated and real data sets.
Clustering individuals based on genetic composition has become important for many studies in variousfields, such as ecology, conservation, medicine, and anthropology, and there are now several methods and programs addressing this task (Waples and Gaggiotti 2006; Wollstein and Lao 2015). The more developed approach is the model-based approach, which uses Bayesian or maximum-likelihood methods to
estimate allele frequencies of K hypothetical populations,
under model assumptions such as HWE, and assigns probabilities of assignment for individuals to these populations. The alternative, model-free, approach is based on analysis of distance (dissimilarity) or similarity matrices, which summa-rize some measure of distance or similarity between all pairs of individuals. These matrices are usually analyzed using MDS such as PCA and projected to two or three coordinates for visualization [e.g., PLINK (Purcellet al.2007), EIGENSOFT
(Price et al. 2006), and GENEALEX (Peakall and Smouse
2006, 2012)]. Clusters are determined either visually or
us-ing other clusterus-ing methods, such as k-means (MacQueen
1967), often requiring a priori definition of the number of
clusters to be found, K. Similarly, other distance-based
methods apply spectral clustering techniques and analyze
the eigenvalue spectra of similarity matrices (Lee et al.
2010). Because model- and distance-based approaches differ
significantly in methodology and prior assumptions,
re-searchers often apply both approaches to the same data set to ensure that interpretations are not biased by methodology. The network approach we present here falls under the distance-based clustering category, and no underlying model is assumed. Clustering is done by locating groups of nodes that are strongly connected within the group but weakly connected to nodes outside the group. The strength of the intracommunity
connections is not defined by a fixed value but rather is
determined relative to the network structure. For example, spectral community-detection methods (Newman 2006, 2013) do not analyze the spectra of the similarity matrix itself but rather address the modularity matrix, which is constructed by comparing the strength of connection be-tween nodes with what would be expected in a random net-work with similar structural properties (i.e., same node degrees). The community-detection methods used in our ap-proach therefore differ from other distance-based clustering methods in what is considered a“good cluster”and have been
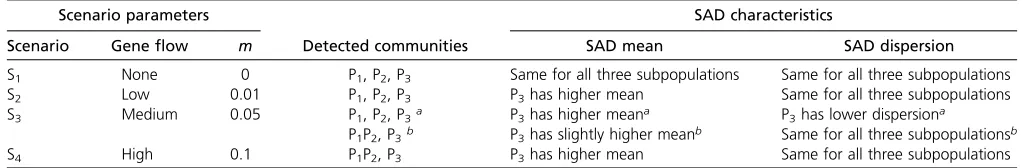
Table 1 Strength of association distribution (SAD) analysis for simulated scenarios
Scenario parameters SAD characteristics
Scenario Geneflow m Detected communities SAD mean SAD dispersion
S1 None 0 P1, P2, P3 Same for all three subpopulations Same for all three subpopulations
S2 Low 0.01 P1, P2, P3 P3has higher mean Same for all three subpopulations
S3 Medium 0.05 P1, P2, P3a P3has higher meana P3has lower dispersiona
P1P2, P3b P3has slightly higher meanb Same for all three subpopulationsb
S4 High 0.1 P1P2, P3 P3has higher mean Same for all three subpopulations
After the split to three subpopulations, geneflow occurs between P1and P2at ratem, and P3remains isolated. Further details are presented inFile S3.
shown to detect meaningful clusters in many systems where clusters are better defined by relative relations between
ele-ments than by other distance-based definitions (Girvan and
Newman 2002; Fortunato 2010). In this sense, community detection is more similar to model-based approaches, but here no prior assumptions are required. This also makes it more natural to weigh pairwise genetic similarity by allele frequencies to strengthen similarity between individuals sharing rare alleles relative to those sharing common alleles
(Equation 3), whereas other distance-based methods more commonly employ only identity-by-state (IBS) measures to define similarity or distance between individuals.
Ideally, population-level studies would benefit from ex-ploring structure using our network approach in combination with model-based clustering methods and MDS visualization since these complement each other and may give a more robust and detailed picture. In the example analyzed in this paper using human SNP data, the model-based analysis and
the network analysis were relatively in agreement regarding assignment of individuals to subpopulations. However, the network analysis did detect the difference between the Chinese and Japanese groups, which was not detected by the software STRUCTURE. Additionally, the SAD analysis
revealed differences in geneflow experienced by the Masai
and African-ancestry American groups, but these groups appear very similar in the STRUCTURE analysis (Figure 3).
The STRUCTURE analysis did indicated biologically mean-ingful structure at different hierarchical levels, but this was done using a heuristic, and the hypothesis of population structure at any hierarchical level is not statistically testable. Statistically testable hierarchical partitioning of population structure is, of course, feasible and common in subpopulation/
population-level methods (e.g.,F-statistics and AMOVA) but
is not common in individual-subpopulation procedures, where putative subpopulations are not defineda priori. With the approach presented here, a similar hierarchical structure was detected through systematic examination of edge-removal thresholds, but here each hierarchical level was statistically tested and shown to be significant. Statistically testing hierarchical structure is important because otherwise analyses are forced either to recover only the strongest level, missing biologically relevant information about the system, or to report many hierarchical levels, without a procedure for determining which are meaningful and which are not. With
the network method presented here, different significant
community structures emerge, producing a semihierarchical structure in the sense that a community partition at a given level does not depend on “higher-level”partitions. True hi-erarchical community partition procedures (Pallaet al.2005; Guimeraet al.2007) can possibly be useful for hierarchical population structure analysis, but in most of these proce-dures, each level is constrained by higher levels.
Another related issue that has been a concern in model-based implementation is the assessment of the number of subpopualtionsK(Pritchardet al.2000; Evannoet al.2005) becauseKis usually one of the model parameters. This prob-lem also arises when applying clustering techniques to results
of distance-based methods, such ask-means on MDS results.
By settingK, these procedures regard the subpopulations as
equivalent, even though this is often not the case. For exam-ple, for the network shown in Figure 1B,K =3, but the three subpopulations show very different distributions of within-population relatedness (Figure 2). In the network-based approach, there is no such issue because most
community-detecting methods do nota prioriassumeKbut ratherfind
the optimalKthat maximizes modularity (e.g., Clausetet al.
2004; Newman 2004b) or acquireKas part of the detection
process (e.g., Pons and Latapy 2006; Newman 2006;
Raghavan et al. 2007), without assuming any equivalence
of the communities. This is due to the fact that modularity is a trusted and well-studied measure for the quality of community partitions (Newman 2004b).
With whole-genome sequencing becoming more and more accessible, procedures for population structure analysis also
must take into account computational considerations. The procedure presented here is composed of three consecutive steps, with construction of the network taking OðLn2Þtime, wherenis the number of individuals in the sample, andLis the number of loci involved in the analysis. Computation time for community detection depends on the algorithm used, but fast near-linear algorithms, takingOðnþmÞtime, wheremis
the number of edges in the network, and approachingOðnÞ
time for sparse networks (which can be constructed using high enough edge-removal thresholds), are already available
(Raghavanet al.2007). SAD analysis depends onmand on
the number of communities detected c and takes OðcnmÞ
time, approachingOðcn2Þfor sparse networks. Only thefirst step involvesL; therefore, the computation time of the entire procedure is linear with respect to the number of loci, and there should be no computational limitation for including full-genome sequences in analyses.
Because the genetic-similarity measure, the threshold, and the community-detection algorithm remain, for now, user
defined and may result in different population structures,
care must be taken when defining these parameters, and
preferably several options should be explored. Further studies may provide guidelines for setting these parameters as a function of the particulars of the system under study. Network theory, particularly community detection, is a highly active field of research, but our understanding of the usefulness of particular community-detection procedures to different types of networks is still minimal, and future advancements in network theory may provide clearer guidelines for algorithm and threshold choice. One possible direction for formalizing the systematic edge-removal threshold procedure could be by drawing ideas from persistence homology theory (Edelsbrunner and Harer 2008), except that here we are interested in the persistence of the modular structures of networks over different thresholds rather than the persistence of homol-ogy groups of simplicial complexes. As with most other individual-subpopulation level clustering methods, sig-nificant linkage disequilibrium (LD) between loci should be avoided, and data should be screened to ensure that loci can be regarded as independent. The extent to which
LD will affect both community partition and the signifi
-cance test presented here also should be explored in the future.
We believe that a network approach may provide an addi-tional complementary viewpoint on population structure anal-ysis, one less hampered by prior assumptions. Moreover, defining problems in population genetics in network terminol-ogy is important for establishing the usage of network theory in population genetics. Currently, many tools and methods are developed within network theory to study complex systems,
and these methods may become accessible to the field of
population genetics once network terminology is appropriately incorporated in population genetics theory and practice.
Nepusz 2006) and is available at https://giligreenbaum. wordpress.com/software/.
Acknowledgments
The authors thank Yair Zarmi, Sharon Renan, Naama Shahar, Amos Bouskila and Shai Pilosof for insightful comments and discussions. This research was supported by a United States– Israel Binational Science Foundation grant (2011384) awarded to S.B., A.R.T., and Amos Bouskila. This is publica-tion 894 of the Mitrani Department of Desert Ecology.
Literature Cited
Alexander, D. H., J. Novembre, and K. Lange, 2009 Fast model-based estimation of ancestry in unrelated individuals. Genome Res. 19: 1655–1664.
Allendorf, F. W., G. H. Luikart, and S. N. Aitken, 2012 Conservation and the genetics of populations. Wiley-Blackwell, Hoboken, NJ. Anderson, E. C., and E. a. Thompson, 2002 A model-based
method for identifying species hybrids using multilocus data. Genetics 160: 1217–1229.
Ball, M. C., L. Finnegan, M. Manseau, and P. Wilson, 2010 Integrating multiple analytical approaches to spatially delineate and char-acterize genetic population structure: an application to boreal caribou (Rangifer tarandus caribou) in central canada. Conserv. Genet. 11: 2131–2143.
Beaumont, M., E. M. Barratt, D. Gottelli, C. Kitchener, M. J. Daniels
et al., 2001 Genetic diversity and introgression in the scottish wildcat. Mol. Ecol. 10: 319–336.
Blatt, M., S. Wiseman, and E. Domany, 1996 Superparamagnetic clustering of data. Phys. Rev. Lett. 76: 3251–3254.
Burren, A., H. Signer-Hasler, M. Neuditschko, J. Tetens, J. Kijas
et al., 2014 Fine-scale population structure analysis of seven local swiss sheep breeds using genome-wide snp data. Anim. Genet. Resour. 55: 67–76.
Cavalli-Sforza, L. L., and A. W. Edwards, 1967 Phylogenetic anal-ysis. models and estimation procedures. Am. J. Hum. Genet. 19: 233–257.
Clauset, A., M. E. J. Newman, and C. Moore, 2004 Finding community structure in very large networks. Phys. Rev. E Stat. Nonlin. Soft Matter Phys. 70: 1–6.
Cohen, O., A. Barocas, and E. Gefen, 2013 Conflicting manage-ment policies for the Arabian wolf Canis lupus arabs in the Negev Desert: is this justified? Oryx 47: 228–236.
Corander, J., P. Waldmann, and M. J. Sillanpää, 2003 Bayesian analysis of genetic differentiation between populations. Genetics 163: 367–374.
Csárdi, G., and T. Nepusz, 2006 The igraph software package for complex network research. InterJournal 2006: 1695.
Dyer, R. J., and J. D. Nason, 2004 Population graphs: the graph theoretic shape of genetic structure. Mol. Ecol. 13: 1713–1727.
Edelsbrunner, H., and J. Harer, 2008 Persistent homology: a sur-vey, pp. 257–281 in Surveys on Discrete and Computational Geometry: Twenty Years Later(Contemporary Mathematics Se-ries, Vol. 453), edited by J. E. Goodman, J. Pach, and R. Pollack. American Mathematical Society, Providence, RI.
Evanno, G., S. Regnaut, and J. Goudet, 2005 Detecting the num-ber of clusters of individuals using the software structure: A simulation study. Mol. Ecol. 14: 2611–2620.
Excoffier, L., P. E. Smouse, and J. M. Quattro, 1992 Analysis of molecular variance inferred from metric distances among DNA
haplotypes: application to human mitochondrial DNA restriction data. Genetics 131: 479–491.
Forst, C. V., 2002 Network genomics: a novel approach for the analysis of biological systems in the post-genomic era. Mol. Biol. Rep. 29: 265–280.
Fortunato, S., 2010 Community detection in graphs. Phys. Rep. 486: 75–174.
Garroway, C. J., J. Bowman, D. Carr, and P. J. Wilson, 2008 Applications of graph theory to landscape genetics. Evol. Appl. 1: 620–630.
Girvan, M., and M. E. J. Newman, 2002 Community structure in social and biological networks. Proc. Natl. Acad. Sci. USA 99: 7821–7826.
Guimera, R., A. Moreira, D. Rodrigues, E. Mar, R. Batemanet al., 2007 Extracting the hierarchical organization. Proc. Natl. Acad. Sci. USA 104: 15224–15229.
International HapMap Consortium, 2003 The International HapMap Project. Nature 426: 789–796.
Jombart, T., S. Devillard, A.-B. Dufour, and D. Pontier, 2008 Revealing cryptic spatial patterns in genetic variability by a new multivariate method. Heredity 101: 92–103. Lancichinetti, A., and S. Fortunato, 2009 Community detection
algorithms: A comparative analysis. Phys. Rev. E 80: 056117. Laval, G., and L. Excoffier, 2004 SIMCOAL 2.0: a program to
simulate genomic diversity over large recombining regions in a subdivided population with a complex history. Bioinformatics 20: 2485–2487.
Lee, A. B., D. Luca, L. Klei, B. Devlin, and K. Roeder, 2010 Discovering genetic ancestry using spectral graph theory. Genet. Epidemiol. 34: 51–59.
Li, C. C., and D. G. Horvitz, 1953 Some methods of estimating the inbreeding coefficient. Am. J. Hum. Genet. 5: 107–117. MacQueen, J. B., 1967 Some methods for classification and
analysis of multivariate observations, pp. 281–297 in Pro-ceedings of the 5th Berkeley Symposium on Mathematical Sta-tistics and Probability, Vol. 1. University of California Press, Berkeley, CA.
Munwes, I., E. Geffen, U. Roll, A. Friedmann, A. Daya et al., 2010 The change in genetic diversity down the core-edge gra-dient in the eastern spadefoot toad (pelobates syriacus). Mol. Ecol. 19: 2675–2689.
Neuditschko, M., M. S. Khatkar, and H. W. Raadsma, 2012 NetView: a high-definition network-visualization ap-proach to detectfine-scale population structures from genome-wide patterns of variation. PLoS One 7: e48375.
Neuditschko, M., M. S. Khatkarm, and H. W. Raadsma, 2014 Fine scale population structure of global cattle breeds using dense haplotype data. In Proceedings of the 10th World Congress of Genetics Applied to Livestock Production. American Society of Animal Science, Champaign, IL. (Abstract) 166: 1–3.
Newman, M., 2006 Modularity and community structure in net-works. Proc. Natl. Acad. Sci. USA 103: 8577–8582.
Newman, M. E. J., 2004a Analysis of weighted networks. Phys. Rev. E Stat. Nonlin. Soft Matter Phys. 70: 1–9.
Newman, M. E. J., 2004b Detecting community structure in net-works. Eur. Phys. J. B 38: 321–330.
Newman, M. E., 2013 Spectral methods for community detection and graph partitioning. Phys. Rev. E Stat. Nonlin. Soft Matter Phys. 88: 42822.
Newman, M. E. J., and M. Girvan, 2004 Finding and evaluating community structure in networks. Phys. Rev. E Stat. Nonlin. Soft Matter Phys. 69: 026113.
Opsahl, T., and P. Panzarasa, 2009 Clustering in weighted net-works. Soc. Networks 31: 155–163.
Palla, G., I. Derényi, I. Farkas, and T. Vicsek, 2005 Uncovering the overlapping community structure of complex networks in nature and society. Nature 435: 814–818.
Peakall, R., and P. E. Smouse, 2006 GENALEX 6: genetic analysis in excel. Population genetic software for teaching and research. Mol. Ecol. Notes 6: 288–295.
Peakall, R., and P. E. Smouse, 2012 GENALEX 6.5: genetic anal-ysis in Excel. Population genetic software for teaching and research—an update. Bioinformatics 28: 2537–2539.
Pickrell, J. K., and J. K. Pritchard, 2012 Inference of population splits and mixtures from genome-wide allele frequency data. PLoS Genet. 8: e1002967.
Pons, P., and M. Latapy, 2006 Computing communities in large networks using random walks. J. Graph Algorithms Appl. 10: 191–218.
Price, A. L., N. J. Patterson, R. M. Plenge, M. E. Weinblatt, N. A. Shadicket al., 2006 Principal components analysis corrects for stratification in genome-wide association studies. Nat. Genet. 38: 904–909.
Pritchard, J. K., M. Stephens, and P. Donnelly, 2000 Inference of population structure using multilocus genotype data. Genetics 155: 945–959.
Purcell, S., B. Neale, K. Todd-Brown, L. Thomas, M. A. R. Ferreira
et al., 2007 PLINK: a tool set for whole-genome association
and population-based linkage analyses. Am. J. Hum. Genet. 81: 559–575.
Raghavan, U. N., R. Albert, and S. Kumara, 2007 Near linear time algorithm to detect community structures in large-scale net-works. Phys. Rev. E 76: 1–11.
Rozenfeld, A. F., S. Arnaud-Haond, E. Hernández-García, V. M. Eguíluz, E. A. Serrão et al., 2008 Network analysis identifies weak and strong links in a metapopulation system. Proc. Natl. Acad. Sci. USA 105: 18824–18829.
Saitou, N., and M. Nei, 1987 The neighbor-joining method: a new method for reconstructing phylogenetic trees. Mol. Biol. Evol. 4: 406–425.
Templeton, A., 2006 Population Genetics and Microevolutionary Theory. Wiley, Hoboken, NJ.
Waples, R. S., and O. Gaggiotti, 2006 What is a population? An empirical evaluation of some genetic methods for identifying the number of gene pools and their degree of connectivity. Mol. Ecol. 15: 1419–1439.
Wollstein, A., and O. Lao, 2015 Detecting individual ancestry in the human genome. Investig. Genet. 6: 1–12.
Yang, W.-Y., J. Novembre, E. Eskin, and E. Halperin, 2012 A model-based approach for analysis of spatial structure in genetic data. Nat. Genet. 44: 725–731.
GENETICS
Supporting Information
www.genetics.org/lookup/suppl/doi:10.1534/genetics.115.182626/-/DC1
Inference and Analysis of Population Structure
Using Genetic Data and Network Theory
Gili Greenbaum, Alan R. Templeton, and Shirli Bar-David