Detection of Diseases via Blood Analysis using
Image Processing Techniques
Kajal Jewani1, Kalyani Karmarkar2, Kiran Solapure2, Krishna Boddu2, Pratik Gurnani2
Associate Professor, Department of Computer Engineering, VESIT Chembur, Mumbai, India1
B. E Final Year Students, Department of Computer Engineering, VESIT Chembur, Mumbai, India2
ABSTRACT: Blood related diseases like Malaria and Acute Lymphoblastic Leukemia are highly accountable for the deaths of millions of people each year. Early diagnosis of the disease is necessary for their correct identification and treatment. Malaria and Acute Leukemia are diagnosed by drawing blood sample from the patient’s body and observing the thin blood smear under the microscope to check for irregularities. This requires skilled expertise and is prone to human error. The proposed method constitutes a portable android application which acts as an inexpensive means of diagnosis via image processing and analysis.
KEYWORDS: Malaria, Image acquisition, Pre-processing, KNN, Augmentation.
I. INTRODUCTION
Modern Quinine [1] bark extracts have been used to treat Malaria since 1632, and average cost of medication is under $1.70. Yet Over 700 thousand people died in 2015 due to late or incorrect diagnosis. In 2016[2], an estimated 216 million cases of Malaria occurred worldwide and 445,000 people died, mostly children in African region. About 1,700 cases of Malaria are diagnosed in United States each year.
Malaria is zoonotic febrile disease caused by bite of an infected female Anopheles mosquito. The organism that creates the disease is a Plasmodium genus of protozoa which undergoes a complex life cycle in which it grows and produces. During this process, the red blood cells (RBCs) are used as hosts and are destroyed afterwards. Once in the blood, multiplication of parasites inside the RBCs is responsible for further advancement of the disease.
Acute Lymphoblastic Leukemia, type of cancer affects blood as well as bone marrow. It indicates the overproduction of immature white blood cells, called lymphoblast or leukemia blasts. Unfortunately sometimes bone marrow is unable able to make sufficient red cells, normal white cells and platelets. The blast cells of the bone marrow splashes out into the bloodstream and accumulate in various organs including the lymph nodes (glands), spleen, liver, and central nervous system.
Currently, diagnosis requires drawing blood from the patient and analyzing the thin blood smear under microscopic observation which is depends on availability and expertise of pathologists, which may result into falsified analysis. However, moving towards an automated diagnosis provides reliable analysis and rapid evaluation. Henceforth, accurate diagnosis will enable prompt treatment to control the disease.
II. RELATEDWORK
The paper [3] removes the human error while detecting the presence of Malaria parasites in the blood sample by using image processing and automation this achieved by using Image Segmentation Techniques to detect Malaria parasites in the images acquired from Giemsa stained peripheral blood samples. This is comparative study of two methods for detecting Malaria parasites, first method is based on Segmentation, second uses feature extraction using minimum distance classifiers.
processing steps like image enhancement, image segmentation and feature extraction are applied on microscopic images.
III.METHODLOGY A) PROPOSED SYSTEM
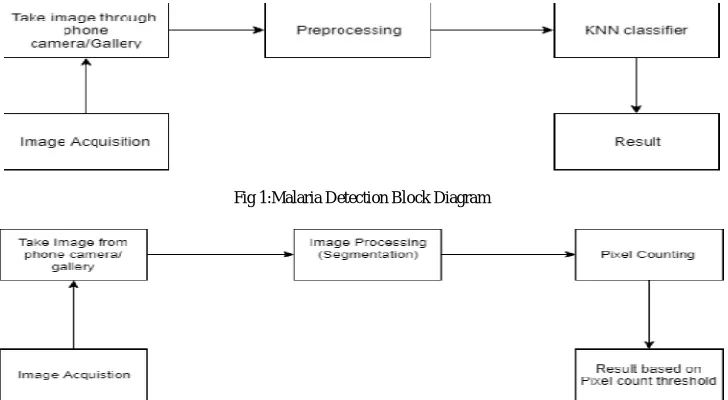
System architecture used for detection of Malaria and Leukemia is shown in Fig1 and Fig2 respectively. Steps I and II remain the same for detecting both the diseases, however these two steps are taken into consideration when we are using our system after deployment. Steps III to V show implementation of our system.
Fig 1:Malaria Detection Block Diagram
Fig 2:Leukemia Detection Block Diagram
1) MALARIA
I) Image Acquisition
This involves conversion of microscopic images into a digital format.Input images of stained blood smears are selected from the dataset library. Dataset consists of infected and healthy sample images.
II) Take an image through phone/gallery
In the proposed system, user can click microscopic images from a camera as well as take an image from a gallery. Further, this image will be uploaded to the server where actual processing will take place.
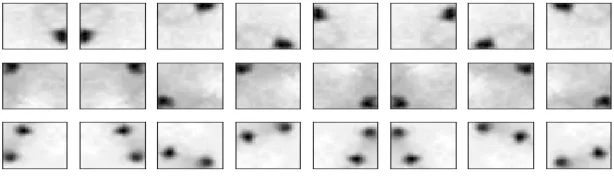
III) Pre-processing (Image Augmentation)
Fig 3:Image Augmentation
IV) KNN (K nearest Neighbour) Classifier
After augmenting the images, they are fed to the KNN classification model.KNN classifier classifies the training dataset. After completion of training phase, the model is tested with various images and results are analysed under ROC curves and performance measures are obtained.
V) Result
From the server, the obtained result will be transferred and displayed below the image in the application. Final diagnosis can be seen in the application or on the server side also. It directly displays malaria positive or negative. So to test any microscopic image, it is given as an input to the system, it goes through Step I -V and provides the desired results.
2)LEUKEMIA III) Image processing
In this step, the image is read by the system, and this RGB image is converted to HSV. Now we segment the image based on the colour of the dye by finding the maximum and minimum value of the colour of the dye. We use a in range function of openCV that does the work of binarization of image, thereby segmenting the image with white pixels as infected cells.
IV) Pixel Counting
After segmenting the image, we find the white pixel counts. In case of infected sample the number of WBCs are huge in number whereas in case of healthy sample the number of WBCs are very less. So the pixel counts for infected sample is large whereas for uninfected sample it is less. Based on the dataset available, we can make a rough estimation of the pixel count which act as a threshold by considering True Positive, False Positive, True Negative, and False Negative. In our case, we have kept a threshold value of pixel count as 5386 i.e. if the pixel count exceeds 5386 then the patient surely has leukemia, else if the pixel count is less than 3011 then he doesn’t have leukemia.
V) Result
From the server, the result obtained on the basis of threshold values of the pixel counts are transferred and displayed below the image view in android application. The diagnosis results are thus seen on our android application.
B) CLASSIFICATIONMETHOD
1. Malaria
K-Nearest Neighbor classifier is a machine learning algorithm which classifies datasets based on their similarity with neighbours.It is a non-parametric classifier, i.e.it does not make any underlying assumptions about the distribution of data.
query point is simply assigned to the label of its k-nearest neighbors. Typically, the class of the object is decided on the basis of its k-nearest by majority votes. If k=1, object is classified as the class of the object nearest to it.In case of only two classes, k must be an odd integer. However, there can still be ties when k is an odd integer while performing multi class classification. Hence, Euclidean distance is used to find the distance which is most common function for KNN.
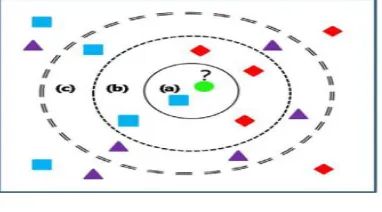
Fig 4. KNN Classification
Depending upon the k-value of 1,5 or 10, the objects are classified as class rectangle at (a),a diamond at (b) and a triangle at (c) as shown in Fig 4.
ALGORITHM
1. Let m be the number of training data samples. Let P be an unknown point
2. Store the training samples in an array of data point’s arr [].This means each element of this array represents a tuple (x, y).
3. For i=0 to m, calculate Euclidean distance d (arr[i], p).
4. Make set S of K smallest distances obtained. Each of these distances corresponds to an already classified data point.
5. Return the majority label among S.
The main advantage of KNN algorithm is that it performs well with multi-model classes because its decision is based on a small neighbourhood of similar objects. Hence, performs with good accuracy even with less dataset
2. Leukemia:
In case of Leukemia we have tested by changing the ranges of pixel values ,initially we kept 5000 as a threshold i.e. if we have pixel count less than 5000 then it is Leukemia negative else Leukemia positive. We further changed the threshold and we found out, in order to decrease the false negatives it is better if we segregate into three classes i.e. leukemia negative, patient may or may not have leukemia and leukemia positive, so we chose the minimum threshold to be 3011 and the maximum threshold to be 5386. So if the pixel count is less than 2767 then it is leukemia negative, if it is in between 3011 to 5386 then the patient may have leukemia and if the pixel count exceeds 5386 then it is leukemia positive.
ALGORITHM
1. Find min and max values of color of the dye used for the infected cells. 2. Segment the image on the basis of min, max value of the color of the dye. 3. Count(c) the number of white pixels (infected cells) in the image. 4. If (c<3011) then print Leukemia Negative.
6. Else print may or may not have Leukemia 7. Result.
IV.EXPERIMENTAL RESULTS
1. Malaria
We used multiple values of k to generate our classifier and test for the best accuracy. We used Receiver Operating Characteristic (ROC) curve for evaluation, with area under the ROC curve (AUC) being the measure of how well a parameter distinguished between two diagnostic groups (diseased/normal). From our results, we selected the classifier with the highest area under the curve, at k=5
TPR: True Positive Rate FPR: False Positive Rate
ROC: Receiver Operating Characteristic AUC: Area under Curve
Fig5.ROC curve for k=1
Looking at the Fig 5 we can infer for k=1 the FPR are minimum and TPR is maximum and reaching at certain point there is linear increase in the graph. AUC for the above graph comes out to be 0.804.
Fig6. ROC curve for k=5
Fig7. Curve plotting all values of AUC for different k
Fig 7 shows AUC for different values of k and we find that for k=5 we are getting maximum AUC and as we increase the value of k further AUC gradually decreases.
Fig8. AUC vs. Dataset Size
Fig 8 shows AUC vs Dataset size and we conclude that in order to have a maximum accuracy we need atleast1400 images in order to train using the classifier. We can further augment the images in order to increase the dataset size.
2. Leukemia
We attempt to find a range of values for which we can successfully diagnose sample as Leukemia Positive or Negative
.
Table 1 shows the minimum and maximum pixel counts obtained after processing the Leukemia image dataset.In order to decrease the false negatives and false positives we are considering three classes based on pixel count threshold.
Fig 9 Pixel counts on training dataset
Fig 9 shows the graph of pixel counts and gives a way to find the thresholds for detection. Based on the values from the table 1 we kept the threshold as 3011 and 5386 i.e. Below 3011 Leukemia negative ,between 3011 and 5386 may or may not have Leukemia and above 5386 surely has leukemia.
V. CONCLUSION
This paper restricts the human error while detecting the presence of Malaria parasites and Leukemia in the blood samples by using image acquisition, pre-processing & KNN classifier. Using KNN classifier we are getting accurate & required results in the short period of time. The system is robust and is unaffected by exceptional conditions and achieves specificity and positive or negative prediction values
.
REFERENCES
[1]https://en.wikipedia.org/wiki/Quinine [2]https://www.cdc.gov/malaria/
[3]Ms.DipaliGhate, Mrs.ChayaJadhav, Dr.NUsha Rani, “Automatic Detection Malaria Parasite from blood images”,The International Journal of Computer Science & Applications (TIJCSA), Volume 1, No. 3, May 2012 ISSN – 2278-1080
[4]Jinho Kim, Byung-Soo Kim, Silvio Savarese,” Comparing Image Classification Methods: K-Nearest Neighbor and Support Vector Machine”,World Scientific and Engineering Academy and Society,Stevens Point, Wisconsin, USA ©2012,ISBN: 978-1-61804-064-0.
[5]https://www.leukaemia.org.au/disease-information/leukaemias/acute-lymphoblastic-leukaemia/
[6]ShubhangiKhobragade, Dheeraj D Mor , C. Y. Patil,” Detection of leukemia in microscopic white blood cell images”International Conference on Information Processing (ICIP),Dec 2015,ISBN: 978-1-4673-7758-4
[7]https://homes.di.unimi.it/scotti/all
[8]http://www.biosigdata.com/-Malaria,Leishmaniasis
[9]R. DonidaLabati, V. Piuri, F. Scotti, "ALL-IDB: the acute lymphoblastic leukemia image database for image processing", in Proc. of the 2011 IEEE Int. Conf. on Image Processing (ICIP 2011), Brussels, Belgium, pp. 2045-2048, September 11-14, 2011. ISBN: 978-1-4577-1302-6
[10]F. Scotti, "Robust Segmentation and Measurements Techniques of White Cells in Blood Microscope Images", in Proc. of the 2006 IEEE Instrumentation and Measurement Technology Conf. (IMTC 2006), Sorrento, Italy, pp. 43-48, April 24-27, 2006. ISSN: 1091-5281.
[11]F. Scotti, "Automatic morphological analysis for acute leukemia identification in peripheral blood microscope images", in Proc. of the 2005 IEEE Int. Conf. on Computational Intelligence for Measurement Systems and Applications (CIMSA 2005), Giardini Naxos - Taormina, Italy, pp. 96-101, July 20-22, 2005.