ABSTRACT
In this paper an algorithm has been proposedto detect and classify the cardiac arrhythmia from a normal Electro Cardio Graphic (ECG) signal based on wavelet decomposition with adaptive threshold. The MIT – BIH arrhythmia and malignant ventricular arrhythmia database has been utilized for evaluating the algorithm. The performance of the algorithm is compared with some existing algorithms in terms of signal duration time (episode length), sensitivity, specificity and positive selectivity. The analysis shows that the proposed algorithm gives satisfactory results.
Keywords
Arrhythmia, Electro Cardio Graph (ECG), Fibrillation, Ventricular Tachycardia (VT), Supra Ventricular Tachycardia (SVT), Ventricular Flutter ( VF)
1.
INTRODUCTION
The electrical activity of human body is represented by bioelectric signal. These bio electric signals are generated due to depolarization of muscle cells. The measure of this electrical activity associated with the heart muscle is known as the electrocardiogram (ECG). Any significant irregularities of a heart beat are usually considered to be symptoms of a pathological condition. By classifying the ECG signals accurately, it allows for the proper detection and classification of any heart disorders that a patient might have.
The electrical impulses generated in the SA node, control the rhythm of the heart. Any disturbance of the normal sinus rhythm is called arrhythmia. In general, arrhythmia may occur in the heart either when depolarization is initiated by other pacemaker cells exhibiting accelerated automaticity as compared to the SA node, or when the conduction of the electrical impulses is altered, that is, when the conduction of the cardiac cells is partially or completely blocked causing a propagation delay of the impulse or conduction failure [1]. Arrhythmia can be classified based on the site of its origin. Ventricular arrhythmia is one of the serious arrhythmias. Itleads to sudden death if it is not detected in appropriate time. Hence, the study of ventricular arrhythmia is most important in heart diseases. Ventricular Tachycardia (VT), Supra Ventricular Tachycardia (SVT), Ventricular Fibrillation (VFIB), and Ventricular Flutter are life-threatening ventricular arrhythmias [2].
Detecting ventricular arrhythmias is a difficult task in arrhythmia monitoring system and defibrillator. Missing arrhythmia can lead to patient death or false positive detection in defibrillator, which canlead to a worst condition. The detection of this cardiac arrhythmia is difficult because the waveform and frequency distribution of this life threatening arrhythmia, changes with time.
1.1
ECG signal detection using wavelet
Transform
Li et al (1995) discussed a detailed analysis of ECG signals based on wavelet analysis [3]. Senhadji et al (1995) compared the ability of three different wavelets transforms (Daubechies, spline and Morlet) to recognise and describe isolated cardiac beats [4]. Sahambi et al (1997(a) and 1997(b)) employed a first order derivative of the Gaussian function as the wavelet for the characterization of ECG waveforms. They then used modulus maxima-based wavelet analysis employing the Dyadic Wavelet Transform to detect and measure various parts of the signal, specifically the location of the onset and offset of the QRS complex and P and T waves[5] . Sivannarayana and Reddy (1999) have proposed the use of both launch points and wavelet extrema to obtain reliable amplitude and duration parameters from the ECG [6]. Kadambe et al (1999) have described an algorithm [7] which finds the local maxima of two consecutive Dyadic Wavelet scales, and compared them in order to classify local maxima produced by R waves and by noise.
Martinez et al (2004) also utilise the algorithm of Li et al applying a dyadic wavelet transform to a robust ECG delineation system which identifies the peaks, onsets and offsets of the QRS complexes, P and T waves [8].
Saritha et al ( 2008) have done ECG analysis using wavelet transform. [9]. V. S. Chouhan ( 2008 ) have used wavelet transform to detect QRS points using adaptive threshold techniques and same author used wavelet to remove baseline wandering of ECG signal .[10] . A. Pachauri et al ( 2009 )[11] used wavelet technique to detect Are wave in ECG signals. Ruchita (2010) have used wavelet transform to detect QRS complexes [ 12].
1.2
Ventricular Arrhythmia Detection using
Wavelet TransformsVentricular tachy arrhythmias, and in particular ventricular fibrillation (VF), are the primary arrhythmic events in the majority of patients who present with sudden cardiac death. During ventricular fibrillation the lower chambers of the heart beat in an irregular fashion. Much work has been conducted over recent years into VF centered on attempts to understand the patho physiological processes occurring in sudden cardiac death, predicting the efficacy of therapy, and guiding the use of alternative or adjunct therapies to improve resuscitation outcomes
Many linear techniques have been developed to detect the arrhythmia. Probability Density Function technique is proposed by Langer et al.(1976) [13],Sequential Hypothesis Testing Algorithm was utilized by thakor et al (1994), and chen (1996) [14] ,[15], Analysis of Peaks in short term Auto Correlation Function by chen and Thakor (1987) [16] ,Ripley (1989) used Rate and Irregularity Analysis [17],
Ventricular Arrhythmias Detection using
Wavelet Decomposition
V.Ilankumaran Dr.S.ThamaraiSelvi
Correlation Waveform was utilized by Lin et al (1988) [18], Four fast Template Matching Technique was utilized by Throne et al (1991) [19], VF Filter Method has been used by clayton and Kuo (1978) [ 20],[21], and Time Frequency Analysis was utilized by Afonso ( 1995) [22].
Most of the researchers reported that these techniques are too difficult to implement and compute triggering time for Automated External defibrillator (AED‟s) and Implantable Cardioverter Defibrillator (ICD‟s). Normally the amplitude of ECG signal decreases as Ventricular Fibrillation (VFIB) duration increases and the frequency distribution changes with prolonged duration [23]. The limitations of the short term auto correlation function and time frequency analysis are due to detection of the features of such amplitude and frequency changes. The algorithms of , Sequential hypothesis testing , analysis of peaks in short term auto correlation function , rate and irregularity analysis , correlation waveform analysis, Four fast template matching technique are able detect very few arrhythmias . These above algorithms are not suitable for detecting all the Ventricular arrhythmias. Besides these linear techniques, many non linear techniques also have been developed which utilize the non linearity of ECG signal for detecting life threatening arrhythmias for short ECG episode duration by Zheng (1999) and Yan sun(2005) [23],[24]. However, there are still many problems requiring solution because of the computational demands. Most of the existing algorithms are difficult to detect a long ECG episode duration in a shorter period of time.
W.J.Tompkins (2003) used wavelet decomposition to detect ventricular arrhythmias [25]. Minami et al. [1999] have proposed application of Fourier Transform (FT) based Frequency Domain techniques for classification of Supraventricular Rhythm, Ventricular Rhythm including Ventricular Tachycardia, Premature Ventricular Contraction, and Ventricular fibrillation [26]. Addison et al, 2000 [27] showed a global view of a long term VF signal in wavelet space , it contains an energy scalogram for a five minute period of pig VF followed by a 2.5 minute period of cardiopulmonary resuscitation (CPR).
Another approach employing Wavelet Transform has been formulated by Prasad et al. (2003)[28] which uses sym6 wavelets for classifying 12 different types of beats in the MIT-BIH Arrhythmia database with a reported accuracy of 96.77% through a Neural Network Classifier. Inan et al. (2006) have presented a method for detection of PVCs using wavelet transform coupled with a neural network classifier achieving an accuracy of over 95% on 40 files of the MIT-BIH Arrhythmia Database [29]. Yu et al. (2007) have presented a beat classification technique that extracts 11 features from wavelet decomposition sub-bands of an input ECG signal and applies a probabilistic neural network for classification of 6 types of beats from MIT-BIH Arrhythmia database achieving accuracy greater than 99%[30]. Güler et al. (2005) uses statistical features such as mean of the absolute values, Average power and standard deviation of the coefficients in each sub-band along with ratio of absolute mean values of adjacent sub-bands extracted from the wavelet decomposition of the ECG signal with a cascaded neural network architecture for classification. This method has achieved an accuracy of 97% in classifying four types of ECG beats (Normal, Congestive Heart Failure, Ventricular Tachycardia, Atrial fibrillation) from the MIT-BIH database [31]. Niwas et al (2005) have utilized features such as heart beat intervals, RR-intervals and spectral entropy of the ECG signal along with a Neural Network classifier to reach an accuracy of 99.02% over the MIT-BIH Arrhythmia database [32].
E.S Jayachandran et al (2009) utilizes wavelet transform for feature extraction of mayocordial infarction [33]. afsar A et al(2008) used wavelet transform to detect beats of cardiac signals with various arrhythmias[34]. Sankarasubramanian A et al (2009) have utilized wavelet based detection to detect ventricular arrhythmias using neural network classifier, to detect Ventricular fibrillation, ventricular flutter and ventricular tachycardia signals [35]. S.Karpagachelvi et al (2010 ) has studied about ECG feature extraction techniques [36].
In this paper an attempt is made to detect ventricular arrhythmias using wavelet based algorithms and mixture of Martinez [8] and Tompkinson [25] algorithm with wavelet function with automatic changing threshold levels. Here also reported about spectral response of ventricular arrhythmias.
2. MATERIALS AND METHODS
2.1 Wavelet transform and Decomposition
Wavelet transform used for detection of ECG signal may be of two types, namely, Continuous Wavelet transforms (CWT) and discrete wavelet transforms (DWT).
2.1.1 Continuous Wavelet Transform (CWT)
There are three approaches to represent signals in time domain. They are short time Fourier transform, Wigner based bilinear distributions and continuous Wavelet Transform (CWT). Wavelet transformation is a linear operation that decomposes a signal into components that appear at different scales. [37].
To analyze the signal in different sizes, it is must to have time Frequency components with different time sets.
Let
(
t
)
be a real or complex valued function in L(R) The function is said to be wavelet if only if it‟s Fourier transform (FT))
(
^
t
satisfies
C
)
(
)
(
^
(1)
This admissibility condition implies that
(
t
)
dt
0
which means the
(
t
)
is oscillatory and its area is zero.
(
t
)
The wavelet transform of a function
y
(
t
)
L
(
R
)
at dilation a and translation b
dt
a
b
t
a
t
y
b
a
,
)
(
)
1
*
(
)
(
(2))
,
(
a
b
- Wavelet transform of signaly t
( )
,)
(
f
- Basic wavelet function (mother),)
(
*
a
b
t
- Dilation of basic wavelet, a - Dilation parameter, b- Translation parameter* Indicates complex conjugate,
a
1
Keeps energy constant for all
stretched along the time axis. For „a‟ less than one, the function
)
(
t
contracts, and if „a‟ is negative,
(
t
)
flips in the time axis.The CWT has a very serious disadvantage of redundancy, CWT provides an over sampling of the original waveform and hence more number of coefficients are generated than what is actually needed, which is a major disadvantage in reconstruction. Therefore, reconstruction becomes much more cumbersome and time consuming, as all the coefficients are needed.
2.1.2 Discrete Wavelet Transform (DWT)
However disadvantage of CWT can be reduced by discretizing either „a’ or ‘ b’ or both. The CWT is defined as the dyadic wavelet transform (DWT), if only „a‟ is discretised along the dyadic sequence 2i
, i= 1,2 3, 4 …., The dyadic wavelet transform of signal y (t) is with basic functions.
The dyadic wavelet transform of signal y (t) is with basic functions
Z
(
t
)
2
k/2
(
2
k/2t
l
)
(3) Here k is equal to a, as a =2k, b is equal to l as b=2k lFor Discrete time signals, the dyadic discrete wavelet transform (DWT) is equivalent, according to Mallet‟s algorithm. This can be implemented by filter banks either using Mallat‟s algorithm [37] or à trous algorithm [38]. In Mallat algorithm, the signal should be down sampled after each filter to remove the signal redundancy of signal representation. It is time variant and reduces temporal resolution of the wavelet coefficients for increasing the scales.
In atrous algorithm, it maintains time variant and temporal resolution at different constant scales, and it is used same sampling rate in all scales. In filter bank techniques, the signal is passed through the filter, and is separated into two components low pass and high pass. The low pass component is the scaling or smoothing function (i.e. approximation) Snk, and the high pass component is the detail signal
Dnk. The detail level signals are used for multi resolution analysis
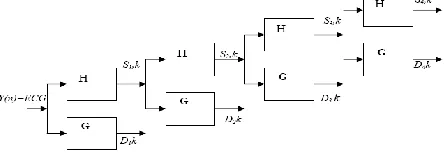
[37]. Àtrous algorithm which is used to decompose the ECG signal is shown in the figure [1]. This approach is called as differentiator filter
[image:3.612.319.566.97.261.2]bank approach.
Fig.1 Wavelet Decomposition by Àtrous algorithm In the above diagram, the signal is decomposed into four D1 to D4 ( 21 to 24 ) scales. The wavelet detailed outputs Dn are used for our analysis. Hence there is no need to reconstruct back the original signal.
2.2 Choice of wavelet
The Wavelet used for the analysis is a quadratic spline. It is first derivative of Gaussian smoothing function. This one has already been used by many researchers [8],[39]. The wavelet is defined by.
)
4
/
(
))
4
/
(sin(
)
(
)
(
j
(4)Figure 2(a) shows the smoothing function and Figure 2(b) shows Cubic Spline wavelet used in the algorithm.
Fig.2 a) smoothing function b) Cubic Spline Wavelet
This wavelet has a centre frequency of 120 Hz and bandwidth of 240Hz. The wavelet has been successfully applied to detect ECG characteristic points. The decomposition has the advantages of being linear phase and shift invariant across the stages of analysis, thus wavelet acts uniformly across the original signal.
2.3 ECG Data
A set of ECG records obtained from the MIT- BIH data base [40] was used for testing the proposed method. All the data segments were sampling frequency of 250HZ.
2.4 Performance measures and formula used to
calculate the measures
The performances are measured by Sensitivity (se), Specificity (sp) and positive Selectivity (+P) [41].
FP
TP
TN
sp
ys
specificit
)
(
(5)
FN
TP
TP
se
y
specificit
)
(
(6)TP
FP
TP
P
(
7)
Where, TP is true positive, the abnormal case being correctly recognized as abnormal one.FN is false negative; the abnormal case is being wrongly recognized as normal one.TN is true negative; the normal case is being correctly recognized as normal one.
[image:3.612.369.560.477.565.2] [image:3.612.55.279.493.572.2]3. RESULTS
From MIT – BIH arrhythmia data base, ECG signals are taken to analyze the developed algorithm. This analysis was conducted with different set ECG episodes form 1 sec to 5 sec with a difference of 0.5 sec. For each length the dataset was randomly divided and tested. Initially 1024 samples are selected randomly and used as first window. By Àtrous algorithm the signal is decomposed into six levels 21, 22,… 26 .The QRS signal is having maximum energy in level 24 ( 0.1 – 30 Hz) [42]. This algorithm searches for maximum modulus lines exceeding some threshold at scales from 21 to 24. After eliminating all redundant maximum points, the zero crossing of wavelet transform at level 21 between the positive maximum and negative minimum pair is marked as QRS [8],[39]. The threshold point will be varied according to the signal variation. This threshold point variation is obtained from QRS point through adaptive threshold variation technique [43].
3.1 QRS point detection
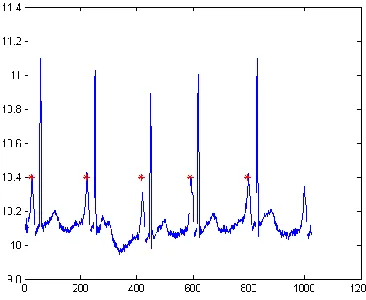
Most of the researchers tested their algorithm on MITBIH data base. MIT BIH data signal is also used to check the algorithm. In some works, just 5 minutes of MITDB is used as a learning period and those is not considered for comparison [20,40, of almedia]. Our algorithm does not need any learning period, entire period is considered. Figure 3 shows the detection R peaks in a 1024 samples for MITDB signals , the figure 6 shows detection of R peaks of the ECG signals with different combinations.
The detected QRS waves are combined and drawn in different sets as shown in the Figure 4. The normal beats , right bundle block , left bundle blocks are shown in the figure 5 and the algorithm detects all types of QRS waves .
[image:4.612.316.572.168.369.2]FIG 3R PEAK DETECTION (MIT–BIH205)
Fig. 4 Different QRS combination detection
The table 2 shows the comparison of QRS detection of this present algorithm and other algorithm. Here only first channel signal is used for comparison as other researchers did so. The sensitivity of this algorithm is 99.78 which is comparable with other algorithms like Pan et all, Lee et all, Afononso , but slightly lesser than that of Almedia and Li et all. 0.40 is the percentage error. It is much comparable. The positive predictivity of this technique is 99.81 %.
Table 1. shows the comparison of QRS detection of this present
algorithm and other algorithm
3.2 P point detection
[image:4.612.76.267.401.528.2]With the RR interval, the algorithm searches the P wave with adequate threshold . The figure 5 shows the P wave detection for ECG signals.
Figure 5 P wave detection (MIT – BIH 223)
3.3 VENTRICULAR ARRHYTHMIA SIGNALS
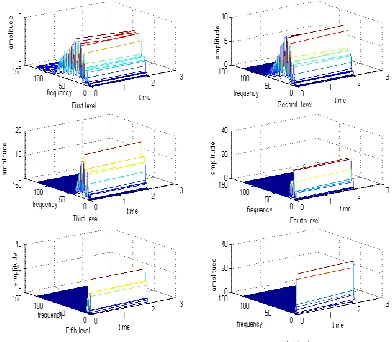
Decomposed ECG signal with VFIB (422), VFL (419), VT (605) and SVT (607) are shown in figure 6, figure 7, figure 8 and figure 9 respectively. The number in the parenthesis specifies the signal annotation reference in MIT – BIH database. Figure 10 and Figure 11 show the spectrogram of normal and ventricular arrhythmia signal
Da ta ba se
QRS Dete ctor
#annot ations
TP FP FN %e rro r
Se P+ %
MI T D B
WT this work
109428 109 201
202 240 0.40 99.7 8
99.8 1 Alm
edia
109428 109 428
153 220 0.34 99.8 0
99.8 6 Li et
al
104182 104 070
65 112 0.17 99.8 9
99.9 4 Afon
onso
90909 905 35
406 374 0.86 99.5 9
99.5 6 Lee
et all
109481 109 146
137 335 0.43 99.6 9
99.9 8 Pan
et all
109809 109 532
507 277 0.71 99.7 5
[image:4.612.347.530.426.576.2]Fig 6. Decomposed ECG signal with VFIB (422)
[image:5.612.333.568.242.462.2]Fig 7. Decomposed ECG signal VFL (419 )
Fig 8. Decomposed ECG signal with VT (605)
Fig 9. Decomposed ECG signal with SVT (607)
Figure 10 Spectrogram of ECG signal different scales 3D (MIT BIH - 100 )
[image:5.612.64.271.485.687.2] [image:5.612.342.538.532.703.2]3.3.1 Ventricular fibrillation and ventricular flutter
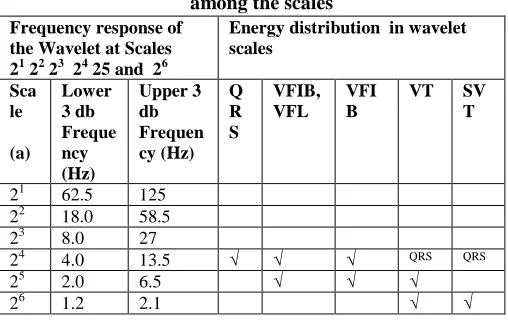
The ventricular fibrillation and ventricular flutter is easily identified by seeing the ECG signal, but in automatic analysis, the detection of ventricular fibrillation and ventricular flutter in the ECG signal is more important. If QRS is not available in the signal there may be chance for ventricular fibrillation (VFIB) or ventricular Flutter (VFL). The peak value of VFIB and VFL are much lower than VT, SVT and normal one in the 24 level as shown in the Fig. 2. Both ventricular flutter (VFL) and ventricular fibrillation (VFIB) have dominant frequencies in the 2-5 Hz band [25],[44], and the major portion of this range is contained in D5 (2.875-5.75 Hz). The VFIB and VFL consist of several continuous cycles. By energy distribution in the frequency domain VFIB and VFL can be easily identified. The energy ratio of D4 to D6 for VFL is larger than VFIB. By this energy variation VFIB and VFL can be classified. Frequency response and energy distribution for each scale is shown in table 2.Table 2. Frequency response and energy distribution among the scales
3.3.2 Ventricular tachycardia and supra ventricular
tachycardia
To detect VT and SVT scales 25 and 26 are used. The VT can be identified by low amplitude S wave and fast heart rate. The low amplitude S value is available in the level 5 or 6. Algorithm checks if there is a signal after R wave with a predefined threshold value for the level 5 and level 6. Algorithm declares after detecting continuous cycle of VT beats.
Supra ventricular Tachycardia can be identified by higher heart rate and no P wave in RR interval. When R- R interval is shorter than the normal rhythm, then T and P wave may appear in the level 6. To detect a SVT beat, the algorithm calculates the R-R interval and counts the number of peaks within the R-R interval in D6 when the R-R interval is shorter than a set criterion. Algorithm declares after detecting continuous cycle of SVT beats.
Each ECG signal is analyzed for QRS detection , if QRS is not available then algorithm will check for ventricular fibrillation (VFIB ) or ventricular flutter(VF) , if QRS is available then it will check for ventricular tachycardia (VT ) or supra ventricular tachycardia (SVT).
Table 3 shows the energy values of normal ECG in different scales. In scale 4 and 5 it is giving maximum values.
Table 3. 3-dB frequency and energy variation in different scales
4. DISCUSSION
4.1 Comparison with other techniques
While identifying and classifying the ventricular arrhythmia from normal sinus rhythm with different episode length, there is no false detection. It means that ventricular arrhythmias can be totally recognized from NSR without exception. Like complexity measure algorithm [24], when the length of ECG episode is longer than 1 sec, it has good performance. When the length of ECG episode is 1 sec, there is 6 false negatives and 27 false positives: when the length of the ECG episodes is 1.5 sec , there is 1 false negative and 5 false positive . However, SE and SP for ventricular arrhythmia recognition from NSR using wavelet is 100 %.
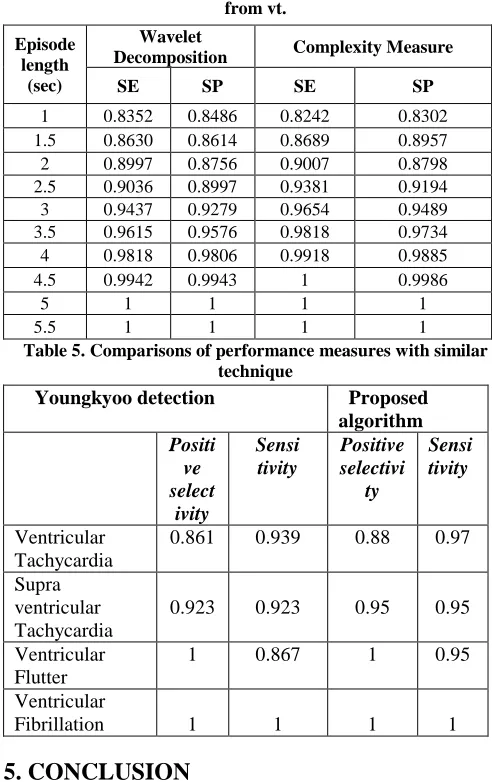
As for VF differentiation from VT, the statistical values of SE and SP for different episode lengths using wavelet decomposition and complexity measure are shown in the table 4. The performance identification is poor in both cases. The classification of recognition performance is increased by increasing length. The performance identification is better when episode length is increased more 4 sec. Table 5 shows the comparison between complexity measure and our algorithm. In Complexity measure technique VT and VF only classified but our algorithm detects a VFIB, VFL, and VT, SVT. Our algorithm failed to detect three ventricular arrhythmia episodes: one VT, one SVT, and one VFL. The amplitude of the missed VF episode is too small to detect as an arrhythmia. Two false negative cases are misclassified as different arrhythmias. The proposed algorithm in this paper shows similar or lower positive specificity and sensitivity. It is very important to diagnose malignant ventricular arrhythmia very soon. With the small amount of data the ventricular arrhythmias can be classified very quickly
Frequency response of the Wavelet at Scales 21 22 23 24 25 and 26
Energy distribution in wavelet scales
Sca le (a)
Lower 3 db Freque ncy (Hz)
Upper 3 db Frequen cy (Hz)
Q R S
VFIB, VFL
VFI B
VT SV T
21 62.5 125 22 18.0 58.5
23 8.0 27
24 4.0 13.5 √ √ √ QRS QRS
25 2.0 6.5 √ √ √
26 1.2 2.1 √ √
Scale 3db bandwidth Energy
S=21 62.5~ 125Hz 50.2 25.6
S=22 18~58.5 Hz 350.2 215.2
S=23 8~27 Hz 740.7 .3
S=24 4~13 Hz
1060.2 .1
S=25 2~6.5 Hz
1075.3
S=26 1~3.3 Hz 1030.7
fS=27 0.5~1.5 Hz
Table 4. Comparison between se and sp for identification of vf from vt.
Table 5. Comparisons of performance measures with similar technique
5. CONCLUSION
Detection of all Ventricular arrhythmias present in ECG signals is an important requirement to detect cardiac problems in time. It is evident from the results that Wavelet decomposition technique with adaptive threshold is more suitable to classify ventricular arrhythmia. For example, in the case of Ventricular Tachycardia identification the positive selectivity parameter of the proposed algorithm is 88 % where as it 86.1%in Youngyoo and Tompkins algorithm. The Specificity parameter of the proposed algorithm for an Episode length of 1.5 seconds is 86.14% where as it is 89. 57% in complexity measure. This proposed algorithm is faster than Zheng‟s complexity measure and slower than normal decomposition technique because of the adaptive threshold.
6. REFERENCES
[1]. H. Traberg, “Marriott’s Practical Electrocardiography,”N Engl J Med, vol. 332, no. 10, pp. 690–, 1995.
[2]. M. Malik and A. J. Camm, “Heart Rate Variability ,” Futura, Armonk, New York, 1995.
[3]. Li. C, L., Z. Chongxun, and T. Changfeng, Detection of ECG characteristic points using wavelet transforms.Biomedical Engineering,IEEE Transactions on, 1995. 42(1): p. 21-28. [4]. Senhadji L, Carrault G., Bellanger J.J. and Passariello G.,
„Comparing wavelet transforms for recognizing cardiac
patterns‟, IEEE Transactions in Medicine and Biology, 1995, Vol.13(2), 167-173.
[5]. Sahambi J S, Tandon S M & Bhatt R K P, „Quantitative analysis of errors due to power-line interference and base-line drift in detection of onsets and offsets in ECG using wavelets‟, Medical and Biological Engineering and Computing, 1997(b), Vol.35, 747-751.
[6]. Sivannarayana N. and Reddy D.C., „Biorthogonal wavelet transforms for ECG parameters estimation‟, Medical Engineering and Physics, 1999, Vol.21, 167-174.
[7]. Kadambe S., Murray R. and Boudreaux-Bartels G.F., „Wavelet transform-based QRS complex detector‟, IEEE Transactions on Biomedical Engineering, 1999, Vol.46(7), 838-848
[8]. Martinez, J.P., et al., A wavelet-based ECG delineator: evaluation on standard databases.Biomedical Engineering, IEEE Transactions on, 2004. 51(4): p. 570-581.
[9]. C. Saritha, V. Sukanya, and Y. Narasimha Murthy, “ECG Signal Analysis Using Wavelet Transforms,” Bulgarian Journal of Physics, vol. 35, pp. 68-77, 2008.
[10]. V. S. Chouhan, and S. S. Mehta, “Detection of QRS Complexes in 12- lead ECG using Adaptive Quantized Threshold,” IJCSNS International Journal of Computer Science and Network Security, vol. 8, no. 1, 2008.
[11]. Awadhesh Pachauri, and Manabendra Bhuyan , “Robust Detection of R-Wave Using Wavelet Technique”, World Academy of Sci.,Eng. and Tech. 56 2009
[12]. Ruchita gautam, anil kumar Sharma, “ Detection of QRS complexes of ECG recording based on wavelet transform using matlab” International Journal of Engineering Science and technology Vol. 2(7), 2010, 3038-3044
[13]. Langer A, Heilman MS, Mower MM: Considerations in the development of the automatic implantable defibrillator. Medical Instrumentation 1976, 10(3):163-167.
[14]. Thakor NV, Natarajan A, Tomselli G: Multiway sequential hypothesis testing for tachyarrhythmia discrimination. IEEE Transactions on Biomedical Engineering 1994, 41(5):480-487. [15]. Chen SW, Clarkson PW, Fan Q: A robust detection algorithm for cardiac arrhythmia classification. IEEE Transactions on Bio-medical Engineering 1996, 43:1120-1125.
[16]. Chen S, Thakor NV, Mover MM: Ventricular fibrillation detection by a regression test on the autocorrelation function. Med Biol Eng Comput 1987, 25(3):241-249.
[17]. Ripley KL, Bump TE, Arzbaecher RC: Evaluation of techniques for recognition of ventricular arrhythmias by implanted devices. IEEE Transactions on Biomedical Engineering 1989, 36(6):618-624.
[18]. Lin D, Jenkins JM, DiCarlo LA, MacDonald RS: Arrhythmia diagnosis using morphology and timing from atrial and ventricular leads. Computers in Cardiology 1988:159-162. (September)
[19]. Throne RD, Jenkins JM, DiCarlo LA: A comparison of four new time-domain techniques for discriminating monomorphic ventricular tachycardia from sinus rhythm using ventricular waveform morphology. IEEE Transactions on Biomedical Engineering 1991, 38(5):561-570.
Episode length (sec)
Wavelet
Decomposition Complexity Measure SE SP SE SP
1 0.8352 0.8486 0.8242 0.8302 1.5 0.8630 0.8614 0.8689 0.8957 2 0.8997 0.8756 0.9007 0.8798 2.5 0.9036 0.8997 0.9381 0.9194 3 0.9437 0.9279 0.9654 0.9489 3.5 0.9615 0.9576 0.9818 0.9734 4 0.9818 0.9806 0.9918 0.9885
4.5 0.9942 0.9943 1 0.9986
5 1 1 1 1
5.5 1 1 1 1
Youngkyoo detection Proposed algorithm
Positi ve select
ivity
Sensi tivity
Positive selectivi
ty
Sensi tivity
Ventricular Tachycardia
0.861 0.939 0.88 0.97
Supra ventricular Tachycardia
0.923 0.923 0.95 0.95
Ventricular Flutter
1 0.867 1 0.95
Ventricular
[20]. Clayton RH, Murray A, Campbell RW: Comparison of four techniques for recognition of ventricular fibrillation from the surface ECG. Med Biol Eng Comput 1993, 31:111-117. [21]. Kuo S, Dillman R: Computer detection of ventricular
fibrillation. Comput Cardiol 1978:347-349.
[22]. V. X. Afonso, W. J. Tompkins, “Detecting ventricular fibrillation,” IEEE Eng. Med. Biol., pp. 152-159, MarcWApril 1995.
[23]. Yan Sun, Kap Luk Chan , SM Krishnan , “ Life- threatening ventricular arrhythmia recognition by nonlinear descriptor,” Biomedical Engineering Online dol:10.1186/1475-925X-4-6, 2005
[24]. Zheng XS, Zhu Ys , Thakor NV , Wang Zz , “ Detecting Ventricular Tachycardia and Fibrillation by complexity measure,” IEEE Transcation on biomedical engineering 1999, 46(5):548-555
[25]. Youngkyoo, W.J.Tompkins, “Detecting and Classifying Life – threatening ECG Ventricular Arrhythmias using Wavelet Decomposition,” Proceeding of the 25th Annual Conference of the IEEE EMBS,2003
[26]. Minami, K., H. Nakajima, and T. Toyoshima, Real-time discrimination of ventricular tachyarrhythmia with Fourier-transform neural network. Biomedical Engineering, IEEE Transactions on, 1999. 46(2): p. 179-185.
[27]. Addison, P.S., et al., A Novel wavelet based analysis reveals hidden structure in ventricular fibrillation. IEEE Engineering in Medicine and Biology, 2000. 19(4): p. 383-392.
[28]. Prasad, G.K., Sahambi, J.S. Classification of ECG arrhythmias using multiresolution analysis and Neural Networks. in Conference on Convergent Technologies. 2003. Bangalore, India.
[29]. Inan, O.T., L. Giovangrandi, and G.T.A. Kovacs, Robust Neural-Network-Based Classification of Premature Ventricular Contractions Using Wavelet Transform and Timing Interval Features. Biomedical Engineering, IEEE Transactions on, 2006. 53(12): p. 2507-2515.
[30]. Yu, S.-N. and Y.-H. Chen, Electrocardiogram beat classification based on wavelet transformation and probabilistic neural network. Pattern Recogn. Lett., 2007.
28(10): p. 1142- 1150.
[31]. Güler, İ. and E.D. Übeylı, ECG Beat Classifier designed by Combined Neural Network Model.Pattern recognit., 2005. 38: p. 199-208.
[32]. Issac Niwas, S., R. Shantha Selva Kumari, and V. Sadasivam, Artificial neural network based automatic cardiac abnormalities classification, in Computational Intelligence and Multimedia Applications, 2005. Sixth International Conference on. 2005.
[33]. E.S.Jayachandran Paul Joseph K, R Acharya U “ Analysis of Myocaridal Infarction using Discrete Wavelet Transform” J Med System ,2009, Online dol : 10.1007/s10916-009 – 9314 -5.
[34]. Fayyaz A Afsar , M Arif “ Robust Electro cardiogram Beat Classification using Discrete Wavelet Transform” Physiol. Meas. 29, 555- 570,2008
[35].Sankarasubramaniam A, Gurusamy G, Selvakumar G “Wavelet based detection of ventricular arrhythmias with neural network classifier”J,Biomedical Science and Engineering 2 (2009) 439-444.
[36]. S.Karpagachelvi, Dr.M.Arthanari, M.Sivakumar, “ECG Feature Extraction Techniques - A Survey” International Journal of Computer Science and Information Security, Vol. 8, No. 1, April 2010
[37]. Mallat, S., “A Wavelet Tour of Signal Processing. London: Academic Press”, 1999
[38]. A. Cohen and J. Kova cevic´, “Wavelets: The mathematical background,” Proc. IEEE, vol. 84, pp. 514–522, Apr. 1996. [39]. C. Li, C. Zheng, and C. Tai, “Detection of ECG characteristic
points using wavelet transforms,” IEEE Trans. Biomed. Eng., vol. 42, pp. 21–28, Jan. 1995.
[40]. Massachusetts Institute of Technology, MIT-BIH arrhythmia databasehttp://www.physionet.org/physiobank/ database/mitdb [41]. AAMI, Association for the advancement of medical instrumentation, “Recommended practice for testing reporting performance results of ventricular arrhythmia detection algorithms,” 1986.
[42]. L. Khadra, A. S. AI-Fahoum, H. AI-Nashash, “Detection of life threatening cardiac arrhythmia using the wavelet transformation,” Med Biol. Eng. Compul., vol. 35, pp. 626-632, 1997.
[43]. V.Ilankumaran , S.ThamariSelvi , “QRS detection using Wavelet Transform by Adaptive Threshold Techniques,” International Conference on BioMedical Engineeing ICBME Dec , 2005
[44]. V.Ilankumaran , S.ThamariSelvi , “Detection and Classification of Ventricular Arrhythmias using Wavelet Transform,” International journal on – in the journal of CIIT international journal of CiiT International Journal of Artificial Intelligent Systems and Machine Learning DoI: AIML092009001 Print: ISSN 0974 – 9667 & Online: ISSN 0974 – 9543, Sep 2009.
AUTHORS PROFILE
V.Ilankumaran received the Bachelor Engineering Degree in Electronics and Communication from Mepco Schlenk Engineering College, India 1988 and M.Tech in Instrumentation and Control from Regional Engineering college, Calicut , in 1995. He is currently professor in P.S.R Engineering College, Sivakasi . His research includes bio-medical signal processing, medical instrumentation, soft computing and Image processing