ABSTRACT
Allen, Angela M. The Interaction of Boronic Acid Based Self-Assembled Monolayers as a Potential Glucose Sensor. (Under the direction of Christopher B. Gorman)
Recognition of sugars such as glucose with phenylboronic acid –
terminated self assembled monolayers (SAMs) was the basis for the designing
and fabricating a biosensor. Self-assembled monolayers were formed on gold
surfaces as shown by infrared spectroscopy. The continuous, repeatable
increase of the electrochemical impedance as the concentration of glucose was
increased gave indication of binding. This binding could be attributed to the
precedent formation of relatively stable esters between phenylboronic acids and
sugars. This impedance change upon binding between glucose and a
phenylboronic acid-terminated SAM showed promise in the development of a
THE INTERACTION OF BORONIC ACID BASED SELF –
ASSEMBLED MONOLAYERS AS A POTENTIAL GLUCOSE SENSOR
by
ANGELA M. ALLEN
A Dissertation Submitted to the Graduate Facility of North Carolina State University
in Partial Fulfillment of the Requirement for the Degree of
Doctoral of Philosophy
Department of Chemistry
Raleigh, North Carolina November 1, 2004
Approved by:
Christopher B. Gorman, Committee Chair
Dedication
I dedicate this work to my son. Remember you can achieve anything through the will of God.
BIOGRAPHY
Angela Malelya Allen was born on November 9, 1974 to Theodore and
Doris Allen. She has two older sisters: Dr. LaWanda (Eric) Kemp and Ava
(Spencer) Moore and a son: John “Trey” Dixon, III. In 1993, she graduated with
honors from Dublin High School in Georgia. She attended Albany State
University (ASU) to pursue a degree in Chemistry. As an undergraduate, she
was a HOPE Scholar and a MARC Scholar. During her years at ASU, she
became apart of the Delta Rho Chapter of Delta Sigma Theta Sorority, Inc. She
also participated in several other organizations as well. In 1998, she graduated
Cum Laude with a Bachelors of Arts in Chemistry. The author taught Physical
Science at East Laurens High School (ELHS) in East Dublin, Georgia for a year.
After teaching at ELHS, she decided to advance her knowledge in the field of
chemistry by applying to several different graduate schools. She was accepted
to North Carolina State University (NCSU) Chemistry Department, where she
researched under Dr. Christopher Gorman in the area of biosensors. She has
ACKNOWLEDGEMENTS
First and foremost, I give thanks and honor to God for giving me the
strength to have accomplished so much in my life so far.
I would like to thank my family for sacrificing their time and allowing me
the opportunity to pursue my dreams. To my parents (Theodore and Doris),
there are not enough words to express how special you are to me. To my sisters
(LaWanda and Ava), you are the inspiration in your little sister’s life. I appreciate
each summer that you took my son in as your own. To my son (John, “Trey”), I
know at times it was tough but your love is the backbone to my success. And I
want to take this moment to let my family know that I am very grateful for their
guidance, support, and encouragement.
To my friends (near and far), I thank you for your unchanging friendship.
To Chiamaka Porter and Damian Young, we came in together as strangers and
we are leaving best friends. I want you to know that knowing you as changed my
life and I wish you the best in all that you accomplish. You have been more than
my friends; you have been my family. To those who came into the program later
(KeAndrea, Donna, Holly, Sofi, Young Rae, and James), it has been a pleasure
meeting all of you. From KeAndra and our shopping sprees to Sofi and our
interesting discussions, I appreciate you all for the laughs, conversations, and
adventures. To Eddie Porter, thank you for stepping in and being the male role
model that my son needed. To my friends far away (Erica and Tamika), a
telephone is a powerful tool. Thank you for your companionship throughout the
To those you have gone before me (grandparents and dear friends),
sharing this world with you has altered my life tremendously. To my
grandparents and Daddy Holeman, I wish you were here today to share this
moment with me. Your kindness and consideration will always be remembered.
To my committee, I thank you for your assistance and for challenging my
abilities to become a better scientist. Dr. Gorman, it has been a long road and I
am pleased to have had the chance to work with you. To Dr. Boss and Dr.
Hanck, I would like you to know that you are a blessing to the department.
Thank you for never giving up on me and always pushing me in the right
directions. To Dr. Gorman’s group, it has been a pleasure meeting each and
every one of you.
Again, I deeply appreciate everyone who has played a role in supporting
Table of Contents
List of Tables ... ix
List of Figures ... x
List of Schemes ... xvi
CHAPTER 1: SIGNIFICANCE OF RESEARCH...1
1.1 Overview ...1
1.2 References ...5
CHAPTER 2: BACKGROUND ...7
2.1 Diabetes ...7
2.1.1. Type I diabetes ...9
2.1.2 Type II diabetes ...9
2.1.3 Evaluation of diabetes...10
2.2 Biosensors...11
2.2.1 Bioactive materials (bioreceptors)...12
2.2.2 Transducers...14
2.3 Glucose Biosensor ...16
2.4 Formation of Monolayers...21
2.4.1. Self assembled monolayers (SAMs)...23
2.4.2. Order in self assembled monolayers50,58-62...24
2.4.3. Characterization of self assembled monolayers50,58-62...24
2.5 References ...27
CHAPTER 3: INSTRUMENTAL ANALYSIS ...29
3.2 Infrared Spectroscopy (IR)57,67...36
3.3 Cyclic Voltammetry (CV)42,64,67...38
3.4 References ...40
CHAPTER 4: INVESTIGATING THE INTERACTIONS BETWEEN GLUCOSE AND BORONIC ACID BASED SELF ASSEMBLED MONOLYAYERS...41
4.1 Introduction...41
4.2 Experimental Section ...43
4.2.1 Materials and substrates...43
4.2.2. Synthesis of N-(3-dihyroxyborylphenyl)-11-mercaptoundecanamide (PBA) ...43
4.2.3 Pretreatment of gold substrates and formation of SAM ...44
4.2.4 Spectroscopic measurements...45
4.2.5.Electrochemical measurements...47
4.3 Results and Discussion ...49
4.3.1 Characterization of phenylboronic acid-terminated SAMs (PBA-SAM)77 ...49
4.2.3 Binding interaction between PBA – SAM and D-glucose77...54
4.3.3. EIS measurements of the PBA – SAM system ...59
4.4 Conclusion...67
4.5 References ...69
CHAPTER 5: THE INFLUENCE OF INSERTING ELECTROACTIVE MOLECULES INTO THE PBA – SAMS...70
5.2 Experimental Section ...72
5.2.1. Materials and substrates...72
5.2.2. Synthesis of N-(3-dihydroxyborylphenyl)-3-mercaptopropionamide ..73
5.2.3. Pretreatment of gold substrates and formation of SAM ...74
5.2.4. Electrochemical measurements...75
5.3 Results and Discussion ...76
5.3.1. Characterization of Fc11 and PBA11 coabsorbed on gold surface79,9776
5.3.2. Performance of the mixed SAM ...80
5.3.4. Binding abilities of boronic acid after incorporating ferrocene –
terminated thiol ...82
5.3.5. Optimizing parameters in order to produce a more proficient biosensor
...85
5.4 Conclusion...91
List of Tables
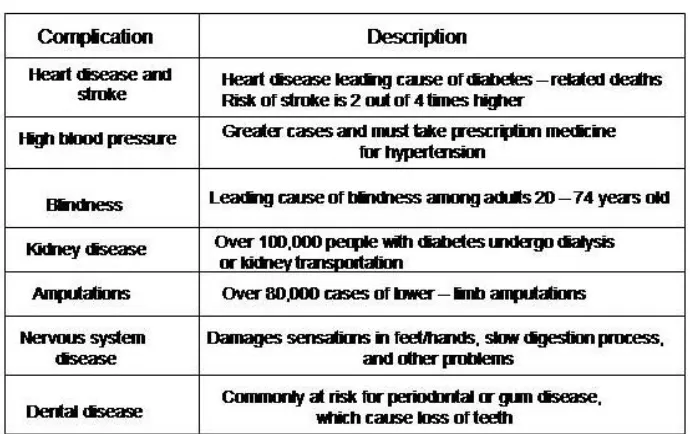
Table 2.1: Complications associated with diabetes...7
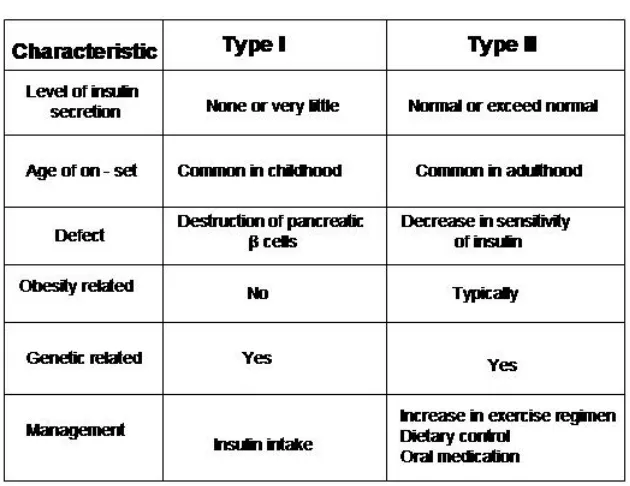
Table 2.2: Evaluation of the two most common types of diabetes ...8
Table 2.3: The active materials (biological related) are responsible for binding or
interacting with the analyte of interest...12
Table 2.4: Some types of transducers that are responsible for converting
recognitions to measurable signals...14
Table 4.1: Important vibrational mode assignments that corresponds to PBA on
a gold surface ...50
Table 4.2: Two – way ANOVA results on impedance data for PBA11-SAMs ....67
Table 5.1: Two – way ANOVA results on impedance data on Fc11/PBA11 - SAMs
...91
Table 5.2: Two – way ANOVA results on impedance data on Fc6/PBA11 – SAMs
...91
List of Figures
Figure 1.1: Schematic approach of the interaction between D-glucose and a
boronic acid derivative which forms a boronate ester. ...2
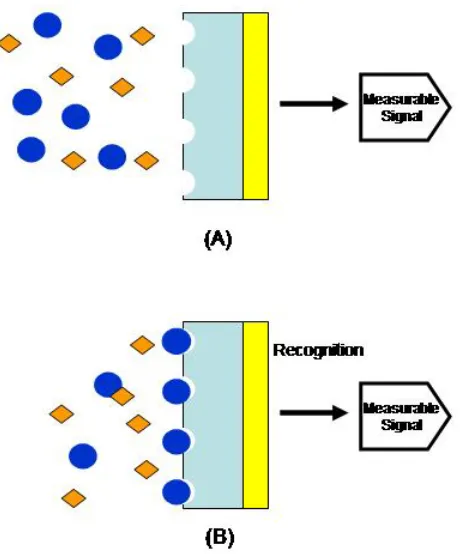
Figure 2.1: (A) Arrangement of a typical biosensor, where the combination of a
bioactive material and a transducer is surrounded by analytes. (B) When a
bioactive material recognizes a specific analyte, a measurable signal is
observed. ...11
Figure 2.2: Schematic of glucose detection with the enzyme glucose oxidase
(Gox)...17
Figure 2.3: A picture of the Yellow Spring instrument, YSI 23A Blood Glucose
Analyzer...17
Figure 2.4: Schematic of how artificial mediators are used to shuttle electrons,
where (ox) is the oxidized formed and the (red) is the reduced formed of the
glucose oxidase (Gox) and the mediator (M). ...18
Figure 2. 5: An example of the home – based glucose sensor , Medisense Pen,
used by diabetics. ...19
Figure 2.6: (A) A picture of a GlucoWatch developed by the Cygnus, Inc., along
with (B) sequences of events that occur in the sensor. (From URL:
http://www.brookscole.com)...20
Figure 2.7: A general schematic of an ideal, organized monolayer on a metal
substrate (electrode), where the alkane chains are bound to substrate and
Figure 2.8: Schematic of the self – assembled method. This method involves (A)
a substrate and a solution of desired sulfur containing molecule, where (B)
the substrate is submerged into the solution for a period of time and (C) a
monolayer is formed as a result...23
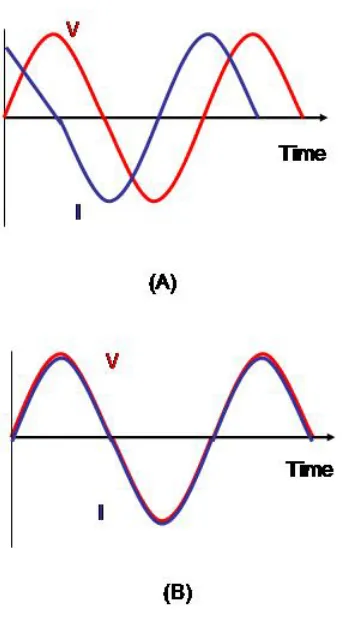
Figure 3.9: The sinusoidal current and voltage (A) for a resistor when the phase
shift is zero and (B) for a capacitor when the current lags the voltage...30
Figure 3.2: The basic vector diagram used for resistance/capacitance (RC)
circuit ...31
Figure 3. 3: Circuits comprising of a resistor in the DC method (A)series and (B)
parallel that can be related to the total impedance when the AC method is in
(C) series and (D) parallel...32
Figure 3.4: The simplest circuit used in electrochemical cells (systems). ...33
Figure 3.5: An example of a Bode plot representing a gold electrode in 0.1
HClO4 solutions from a BAS IM6 instrument...34
Figure 3.6: Example of a complex plot for a simple electrochemical system ...35
Figure 3.7: An example of cyclic voltammetric excitation signal used to obtain
voltammogram ...38
Figure 3.8: An example of a surface bound voltammetry for one – electrode
redox couple; scan rate of 100 mV/s in 0.1 HClO4 aqueous solution...39
Figure 4.1: A picture of the Bowden cell use for electrochemical measurements,
along with a schematic of the cylindrical cavity; the working electrode (gold
(platinum wire) is coiled around the reference electrode (silver/silver
chloride) ...47
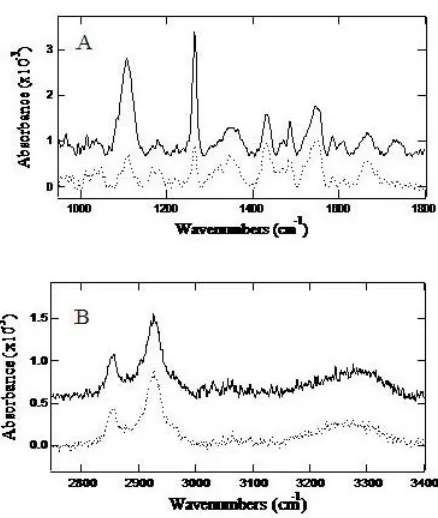
Figure 4.2: The PM-IRRAS spectra of a monolayer PBA on a gold surface in the
low (A) and high (B) wavenumber region, respectively...50
Figure 4.3: Single – pass ATR – FTIR spectra of a 3 mM PBA solution in ethanol
allowed to evaporate on the ATR element in the low (A) and high (B)
wavenumber region. ...52
Figure 4.4: Cyclic voltammogram overlay of bare gold (A) and boronic acid
terminated-SAM (B). Experiments were performed in 1.0 M HClO4 and at
room temperature. Scan rate,100 mV/s; electrode area, 0.32 cm2. ...54
Figure 4.5: PM – IRRAS spectra of a PBA – SAM exposed (solid spectrum) to 3
mM glucose solution for 30 minutes and a PBA – SAM not exposed (dashed
spectrum)...55
Figure 4.6: Single-pass ATR-FTIR spectra of a 3 mM solution of PBA (solid), 3
mM solution of glucose (short dashed), and the 1:1 molar ratio of both in the
low (A) and high (B) wavenumber region. All solutions were allowed to
evaporate on the ATR element. ...57
Figure 4.7: Representations of Bode plots by the Thales software. Plots
represent impedance on bare gold (A) and impedance on a PBA – SAM (B).
All experiments were performed in 0.1 M HClO4 at 5mV amplitude...60
Figure 4.8: Graph representing the changes that occur in the absence and the
presence of glucose in the intermediate region. An experiment ran in 0.1 M
Figure 4.9: Plot of impedance against glucose concentration. The experiment
was done in 0.1 M HClO4 solution at 5 mV amplitude and at room
temperature. Data obtained at 1.47. Hz...63
Figure 4.10: Comparisons of impedance plots for mercaptoundecanoic acid –
terminated SAM (blue) and phenylboronic acid –terminated SAM (red) at
different glucose concentrations. Impedance measurements done at an
amplitude of 5 mV and at room temperature. Plots were taken at 1.47 Hz..64
Figure 4.11: Graphs representing comparisons of PBA – SAMs. Experiments
done in 0.1 M HClO4 at an amplitude of 5 mV and room temperature...65
Figure 4.12: A plot of how each cell differs in percent as different glucose
concentrations are added. Each cell is represented by the same color as in
Figure 4.11...66
Figure 5.1: PM – IRRAS spectra of a mixed SAM, having a 50/50 feed ratio, on
gold in the (A) low and (B) high wavenumber regions, respectively...77
Figure 5.2: An overlay of cyclic voltammograms of (red) ferrocenylthiolate on gold
and (black) a 50/50 feed ratio of a mixed SAM [PBA11 and Fc11]; experiment
done in 0.1 M NaClO4 (pH 11 w/ 10 mM NaOH) at a scan rate of 100 mV/s
and at room temperature. ...78
Figure 5.3: Comparisons of cyclic voltammograms in high pH (red) and low pH
(black) electrolyte solutions for Fc11/PBA11 SAMs. Experiments done at scan
rate of 100 mV/s and at room temperature. (Data for graphs were taken at
Figure 5.4: Overlays of Fc – SAM cyclic voltammograms at different glucose
concentrations: 0 mM (black), 5 mM (red) and 20 mM (green); scan rates at
100 mV/s ...83
Figure 5.5: Graph of the percent change in the impedance data obtained in 0.1
NaClO4 (pH 11, adjusted with 10 mM NaOH); observed at 1.5 Hz ...83
Figure 5.6: Plots that represent the reproducibility of Fc11/PBA11 – SAMs;
experiments done in pH 11 solution at an amplitude of 5 mV and at room
temperature. ...84
Figure 5.7: A graph representing the cells from Figure 5.5 (with respect to colors)
of the impedance changes in the presence of glucose . ...84
Figure 5.8: Cyclic voltammogram of a Fc6/PBA11 - SAM on a gold surface in pH
11 solution; scan rate of 100 mV/s at room temperature. ...86
Figure 5.9: Cyclic voltammogram of a Fc6/PBA3 - SAM on a gold surface in pH 11
solution; scan rate of 100 mV/s at room temperature. ...87
Figure 5.10: Bode plots of both mixed monolayers: (A) Fc6/PBA11 – SAM and (B)
Fc6/PBA3 – SAM. ...88
Figure 5.11: Impedance plots of representative data from Fc6/PBA11 – SAMs at
different glucose concentrations. Impedance measurements done at an
amplitude of 5 mV and at room temperature. Plots were taken at 1.47 Hz..89
Figure 5.11: Impedance plots of representative data from Fc6/PBA3 – SAMs at
different glucose concentrations. Impedance measurements done at an
Figure 5. 12: A proposed circuit model to investigate the physical characteristics
of the mixed SAMs; which includes four components: uncompensated
solution resistance, R s, film capacitance, C f, charge transfer resistance, R
List of Schemes
Scheme 4.1: Synthesis of
N-(3-dihydroxyborylphenyl)-11-mercaptoundecanamide (PBA) ...45
Scheme 5.1: Synthesis of
N-(3-dihydroxyborylphenyl)-3-mercaptopropionicamide) (abbreviated PBA3) ...74
Scheme 5.2: Molecules used in the formation of mixed monolayers in order to
CHAPTER 1:
SIGNIFICANCE OF RESEARCH
1.1 Overview
Over the last few years, there has been a growing interest in developing
biosensors that are selective for sugar (saccharide or diol) detection.1-11 The
advancements in this field offer promising outlooks in many important
applications related to sugars such as managing diabetes by monitoring the
levels of glucose concentration in the blood. Majority of commercially available
glucose biosensors glucose biosensors are enzyme – based, which requires
frequent collection of blood samples. There are several problems related to this
type of method. The first one is the pain from pricking a finger via a small
needle. Second, the frequent pricking can be an inconvenience that affects a
patient’s daily routine. Despite some advancement in using enzyme – based
sensors, there are still several other approaches that can be explored. Lately,
studies have focused on the development of continuous glucose monitoring to
improve the management of monitoring glucose levels and to provide instant
feedback for diabetic patients. In recent works, boronic acids have been chosen
as good candidate for sensors due to their ability to bind with sugars.25 Boronic
acid reacts with sugars to form boronate esters when the hydroxyl groups on a
diol (sugar) are in the 1,2 or 1,3 orientation.26-28 Figure 1.1 shows a boronic acid
derivative binding to the 1,2 – hydroxyl positions of a glucose molecule. The
monolayer containing a boronic acid derivative thiolate on a gold electrode that
will communicate electrochemically upon concentration of glucose addition.
Figure 1.1: Schematic approach of the interaction between D-glucose and a boronic acid derivative which forms a boronate ester.
Boronic acid is a Lewis acid that reversibly combines with sugars such
that it demonstrates potential applications for the development of a glucose
biosensor. A broad range of techniques (such as adsorption, fluorescence,
Raman, etc.) has been used to study these abilities.29-36 DiCesare and Lakowicz
incorporated a boronic acid group in resonance with an azo dye and studied the
color change upon addition of sugars through absorption.33 Hayashita et al.
designed a fluorescent probe containing a fluorescent pyrenyl group and an
arylboronic acid moiety in order to recognize sugars selectively.37 James et al.
designed a diboronic acid system that be employed in an electrochemical
detection of sugars.30 Further recognition of sugars such as glucose with a self
assembled monolayer (SAM) containing a phenylboronic acid derivative has
instance, Kanayama and Kitano formed monolayers with disulfides carrying
boronic acid groups on a gold colloid or a gold electrode and showed the
detection of sugar binding by UV – vis adsorption change and by cyclic
voltammetry (respectively) using an electroactive marker.38,39 Nakashima et al.
extended the use of SAMs by studying a sugar sensor based on a phenylboronic
acid – terminated redox active SAM on a gold electrode by electrochemical
means.36
It was hypothesized that electrochemical impedance spectroscopy could
be capable of detecting the interaction between glucose and a surface bound
boronic acid – terminated thiol. The technique would offer rapid acquisition of
data and provide accurate measurements without destroying the system. An
incentive for selecting electrochemical impedance spectroscopy for this study of
phenylboronic acid – terminated self – assembled monolayers was because it
furnished electrochemical information regarding the binding ability of
phenylboronic acids to glucose without the need of an electroactive molecule or a
molecule that can be reduced or oxidized (Chapter 4). Alternatively, combining
an electroactive molecule, ferrocene – terminated self – assembled monolayer,
with a non – electroactive species, boronic acid - terminated self – assembled
monolayer launched other ways to study sugar binding extensively (Chapter 5).
Furthermore, characterizing the surface before and after inserting ferrocene –
thiol was examined through means of surface infrared spectroscopy (IR) and
The binding phenomenon between the boronic acid derivative and glucose
offers promising approaches in the development of innovating types of glucose
biosensors. In our research, the ease of preparation for self – assembled
monolayers appeared to be a promising way to design versatile surface bound
molecules that would exhibit characteristics of molecular recognition. Infrared
spectroscopy gave a handle on characterizing the modified gold surfaces
containing phenylboronic acid self – assembled monolayers. Cyclic voltammetry
was used in the investigation of how the monolayers formed on the gold
substrates by making the interfacial capacity available for quantitative values.
Overall, we were interested in using electrochemical impedance spectroscopy to
reveal information on SAMs containing a phenylboronic acid derivative during
1.2 References
(1) Clark, L. Biosens. Bioelectron. 1993, 8, iii.
(2) Cass, A.; Davis, G.; Francis, G.; Hill, H.; Aston, W.; HIggins, I.; Plotkin, E.; Scott, L.; Turner, A. Anal. Chem. 1984, 56, 667.
(3) Hunter, I.; Jones, L.; Kanigan, T.; Brenan, C.; Sambol, L.; Sosnowski, L. In MIT Home Automation and Healthcare Consortium, 2000.
(4) Mohanty, S. At URL: http://citeseer.ist.psu.edu/mohanty01biosensor.html (5) Ohara, T.; Rajagopalan, R.; Heller, A. Anal. Chem. 1994, 65, 2451-2457.
(6) Reach, G.; al., e. Anal. Chem. 1996, 68, 3822-3826.
(7) Rishpon, J.; Gottesfeld, S.; Campbell, C.; Davey, J.; Zawodzinski, T. Electroanalysis 1994, 6, 17.
(8) Vo-Dinh, T.; Cullum, B. Fresenius J. Anal. Chem. 2000, 366, 540.
(9) Wang, J. Electroanalysis 2001, 13, 983.
(10) Wisniewski, N.; Moussy, F.; Reichert, W. Fresenius J. Anal. Chem. 2000,
366, 611-621.
(11) Woedtke, T.; Julich, W.; Hartmann, V.; Stieber, M.; Abel, P. Biosensors & Bioelectronics 2002, 17, 373-382.
(12) Badugu, R.; Lakowicz, J.; Geddes, C. Anal. Chem. 2004, 76, 610-618.
(13) Claremont, D.; Penton, C.; Pickup, J. J. Biomed. Eng. 1986, 8, 272.
(14) McDonald, W.; Kopeland, R. At URL:
http://www.ieee.org/organizations/pubs/newsletters/leos/apr98/invitro.htm (15) Kobos, R. Trends Anal. Chem. 1987, 6, 6.
(16) Clark, L.; Lyons, C. Ann. NY Acad. Sci. 1962, 102, 29.
(17) Frew, J.; Hill, H. Anal. Chem. 1987, 59, 933A.
(18) He, B. At URL: www.glue.umd.edu
(19) Rinken, T.; Tenno, T. Biosens. Bioelectron. 2001, 16, 53.
(20) Murray, R.; Ewing, A.; Durst, R. Anal. Chem. 1987, 59, 379.
(21) Tierney, M.; Kim, H.; Burns, M.; Tamada, J.; Potts, R. Electroanalysis
2000, 12, 666.
(22) Wang, J. Electroanalysis 1991, 3, 255.
(23) Vreeke, M. At URL: http://www.devicelink.com
(24) Wink, T.; Zuilen, S.; Bult, A.; Benneken, W. The Analyst 1997, 122, 43R.
(25) Lorand, J.; Edwards, J. J. Am. Chem. Soc. 1959, 24, 769.
(26) Springsteen, G.; Ballard, E.; Gao, S.; Wang, W.; Wang, B. Bioorg. Chem.
2001, 29, 259.
(27) Springsteen, G.; Wang, B. Tetrahedron 2002, 58, 5291.
(28) Yang, W.; Gao, X.; Wang, B. Med. Res. Rev. 2003, 23, 346.
(29) Adhikiri, D.; Heagy, M. Tetrahedron Lett. 1999, 40, 7893.
(30) Arimori, S.; Ushiroda, S.; Peter, L.; Jenkins, A.; James, T. Chem. Commun. 2002, 2368.
(31) Carey, R.; Folkers, J.; Whitesides, G. Langmuir 1994, 10, 2228.
(32) Czarnik, A. J. Am. Chem. Soc., 117.
(33) DiCesare, N.; Lakowicz, J. Org. Lett. 2001, 3, 3891.
(35) Karnati, V.; Gao, X.; Gao, S.; Yang, W.; Ni, W.; Sankar, S.; Wang, B. Bioorg. Med. Chem. Lett. 2002, 12, 3373.
(36) Murakami, H.; Akiyoshi, H.; Wakamatau, T.; Nakashima, N. Chem. Lett.
2000, 940.
(37) Tong, A.; Yamauchi, A.; Hayashita, T.; Zhang, Z.; Smith, B.; Teramae, N. Anal. Chem. 2001, 73, 1530.
(38) Kitano, H.; Morokoshi, S.; Ohhori, K.; Gemmei-Ide, M.; Yokoyama, Y.; Ohno, K. J. Colloid Interface Sci. 2004, 273, 106.
CHAPTER 2:
BACKGROUND
2.1 Diabetes
An overall definition for diabetes is a group of diseases characterized by
high levels of blood glucose resulting from a flaw in the insulin production.40 The
disease is related to amount of sugar (glucose) in the blood. Insulin is a
pancreatic hormone that allows for cells to uptake glucose, which is present in
the blood.40 When there is a change in the insulin production, the amount of
glucose (whether too much or too little) in the blood ultimately affects the function
of several organs. Too much insulin (low level of glucose) causes a person’s
ability to reason to become impaired, resulting in a coma; and not enough insulin
(high level of glucose) causes a person to have diabetes.40,41
As of 2002, there are a total of 13 million people in the United States that
have been diagnosed with diabetes, and there are about 5 million more that have
not been diagnosed.42 Diabetes has several different causes and it causes
complication in several different organs of the body (Table 2.1). Complications
such as strokes, blindness, high blood pressure, and kidney disease can occur;
even premature death in some cases.43 In 2000, diabetes was the sixth leading
cause of death in the United States. Direct and indirect costs of this illness are
constantly rising in order to control glucose levels in patients (diabetics).42
Table 2.2: Evaluation of the two most common types of diabetes
When the insulin production is normal, the blood sugar level is somewhere
between 60 – 115 mg/dl or 3.3 – 6.4 mM (to convert mg/dl to mM, divide by 18).41
When the insulin production is abnormal, some type of insulin therapy is required
in which constant measurements of glucose levels are needed. In the early days,
diagnosed if the urine tasted sweet.41 Nowadays testing of the blood is used for
diagnosing; one would be diagnosed if the level of glucose after 10 hours of
eating a meal were around 126 mg/dl.41 In addition, other reasons for diagnosing
people rely on symptoms related to the disease such as excessive thirst,
excessive urination, and general fatigue.40,41 After being diagnosed, the physician
must decide what type of diabetes a patient has. The most common types of
diabetes today are Type I and Type II diabetes.40,41,43-45
2.1.1. Type I diabetes
In this type of diabetes, there is a destruction of the pancreatic beta (β)
cells (insulin production). The deficiency in insulin production leads to life long
dependency on insulin treatments. Type I diabetes accounts for almost 10% of
all cases of diabetes. Known by the lack of insulin secretion, Type I diabetes was
previously called juvenile on – set diabetes. This case usually occurs in younger
people such as children and young adults (up to 30 years of age) that are not
necessarily overweight.
2.1.2 Type II diabetes
In Type II diabetes, insulin secretion can be normal or exceed normal but
the β cells just do not use the insulin properly because a person typically
secretes an excess of insulin that flows over into the blood, which leads to insulin
resistance (body cells resist insulin). Over a period of time, a need for insulin
intake may arise in a patient due to the increase of insulin production in the
pancreas, wherein this increase causes the pancreas to gradually stop producing
identified as adult on – set diabetes. This type of diabetes usually occurs in
people over the age of 40. However, it is common in overweight people and
those who have a history of diabetes in their families. Type II diabetes is higher in
those who ethnic groups which includes African Americans, Hispanic Americans,
Native Americans, and Asian Americans. Over 90% of diabetic cases are
diagnosed as Type II. Recently, there have been more cases of Type II diabetes
in children and adolescents.
2.1.3 Evaluation of diabetes
These are not the only types of diabetes, but they are the most common
cases in the United States (Table 2.2). Diabetes can lead to major complications
that cause people to adjust their lifestyles. Diabetics, persons who have been
diagnosed, can learn to control this disease with appropriate medical care. Those
with Type I can control diabetes with the proper intake of insulin by the use of
pump or injections. And those with Type II can control diabetes by increasing
their exercise regimen, managing their eating habits, and taking the necessary
oral medication. Nevertheless, checking the glucose levels in the blood (for either
type of diabetes) is the essential way in preventing complications associated with
diabetes. Regulating the flow of insulin can slow the process of severe
complications that occur with the disease. Therefore, the future of diabetes
research is leaning towards the field of sensors for monitoring the glucose levels.
Researchers are trying to develop sensors that can continuously monitor glucose
levels with the hopes in lessening the disruption of diabetic patients’ daily lives. In
glucose levels in their individual homes. This advantage allows for untrained
people to be able to monitor their glucose levels with little or minimum human
error. Increasing people’s knowledge and understanding of diabetes can aid in
approaching this disease with new and innovative ways to control it.
2.2 Biosensors
Biosensors are defined as devices that combine analytical active materials
with transducing systems in hopes to recognize specific analyte.4,8,9,46-48 They
react in response to specific biological molecular recognition of analyte, which
are in turn measured by a variety of transduction techniques that convert the
event into measurable signals (Figure 2.1).
The aim of biosensors is to produce continuous signals wherein the
quantities are related to the amount of analyte.4,8,9,46-48 Various kinds of
biosensors exist have an application in the chemical regime. Biosensors are
often classified either by their recognition pattern or the technique that is used for
recognition.
2.2.1 Bioactive materials (bioreceptors)
The bioactive materials are responsible for the molecular recognition or
the binding that occurs with the specific analyte that the sensor would measure.
The specific selectivity between the active material and analyte of choice
determines the precision of the sensor. Table 2.3 lists some types of
bioreceptors (bioactive materials) that are commonly used in sensors. Bioactive
materials are grouped into several categories, for example, nucleic acids,
antibody, and enzymes.
2.2.1a) Nucleic acids: This bioreceptor recognizes the hybridization of two singles strands, one complementary strand, and another deoxyribonucleic acid
(DNA) or ribonucleic acid (RNA) strand. In this sensor, the biorecognition forms a
basis for pairing a DNA single stranded molecule and a synthesized
complementary molecule, called a probe. The probe is often labeled with some
sort of optical molecule (often fluorescence). The overall event involves
unwinding a doubled strand DNA to give two single strands, then a probe is
added and the complementary ends of both strands are hybridized. When there
are sufficient amount of binding, the amount can be detected optically. Usually
the detections are made possible by the use of fluorescent probes. The binding
to the complementary sequences led to sensors often called genosensors.*
2.2.1b) Antibody/antigen: Another example of recognition happens when the bioactive material, antibody, binds to antigens. The response is often known
as a lock and key effect. Antibodies are defense proteins in the immune system
that unite with specific geometrical configurations of antigens. This recognition
event of sensors is called immunosensors.
2.2.1c) Enzyme: Typically, enzymes are attractive due to their binding capabilities and catalytic activities in recognition mechanisms.* Biologically,
enzymes are proteins that specialize in catalyzing specific metabolic reactions
that lowers the limit of detection. The recognition of binding is detected by
reactions that are catalyzed by enzymes that remain unchanged during
detection. Some enzymes require the use of coenzymes when there is a need for
2.2.2 Transducers
Transduction techniques convert signals from a recognition event to
signals that are understandable to a human observer. One method for
transducers is to determine the concentration of analytes proportional to the
concentration of the bioactive material observed in the process of detection.
There are a variety of transducers used today and many more being studied for
future use (Table 2.4). Two of those transducers employed in glucose sensor
research are the optical and electrochemical methods of detection.
Table 2.4: Some types of transducers that are responsible for converting recognitions to measurable signals.
2.2.2a) Optical transducers: The signal that optical transducers yield measures the output of light in biosensors. The optical transducers are known to
use different kinds of spectroscopic techniques (examples are absorption,
fluorescence, Raman, refraction, etc.). Biosensors based on the characteristics
of absorbed or reflected light such as energy and polarization that establish the
understanding of these transductions. For example, the absorption technique
surroundings. Another case involves molecules on fixed surfaces. The
measurements of how polarization change as light are emitted to the surface
gives vital information on the molecules attached. Usually optical transducers
can be associated with the ability of the bioreceptors to fluoresce either directly
or indirectly. For instant, these transducers recognize the interactions between
analytes to bioactive materials, in which the interactions then cause quenching to
occur or cause a reduction in quenching.
2.2.2b) Electrochemical tranducers: The biosensor that detects electrochemical measurements relies on the change in electrical properties
whereupon ions or electrons are produced or consumed in chemical reactions.
Unlike the optical detection, electrochemical detection is very useful when the
analytes of interest do not fluoresce or when the use of a tagged fluorescent
molecule is difficult to handle. The results from electrical signals provide
information about the interactions between the specific analytes and bioactive
material used. Among the most common methods are amperometric and
voltammetric, where two or three electrode systems are applied. Amperometric
measurements monitor the current flow within a cell at a given potential.
Voltmametric measurements observe the current change within a cell as different
potentials are scanned across a cell. The most common glucose sensors
available today are amperometric based sensors.
Biosensors have achieved great accomplishments throughout the years in
medicine to biotechnology. However, there is still more investigations needed to
construct more sophisticated and reliable devices.
2.3 Glucose Biosensor
Since the 1960’s, the introduction of biosensors has opened the doors for
many areas of technology; especially, glucose research.16 Those who have been
diagnosed with diabetes perform several tests to monitor their glucose levels on
a daily basis that can be painful and time consuming. Therefore, the focuses
have been on developing devices that can be pain – free and monitor glucose
levels continuously. A variety of methods have been explored when it comes to
improving devices for diabetes control.9,46 Even though there are many
challenges to encounter, there have been advancements over the years with
glucose biosensors.
The history of biosensors began with Leland Clark who studied the
detection of oxygen using a platinum wire that eventually led to the basis for
glucose sensors.16 Then, along with Lyons, the first idea of a glucose biosensor
based on an enzyme electrode was introduced for clinical use. The biosensor
consisted of an enzyme that was incorporated at a close proximity to a platinum
electrode, a piece of dialysis membrane on the other side of the enzyme that
caused the enzyme to be trapped.16 Figure 2.2 illustrates the detection scheme of
glucose involving the enzyme known as glucose oxidase (Gox). In the presence
of oxygen, glucose oxidase reacts with glucose and yields gluconic acid and
because hydrogen peroxide is reduced. This reduction is detected by
amperometric means.
Figure 2.2: Schematic of glucose detection with the enzyme glucose oxidase (Gox).
Figure 2.3: A picture of the Yellow Spring instrument, YSI 23A Blood Glucose Analyzer.
The release of hydrogen peroxide in the reaction is monitored
amperometrically at the platinum electrode, so as hydrogen peroxide is produced
it shows a relationship parallel to glucose concentration. Clark and Lyons
eventually sold their idea to the Yellow Spring Instrument Company, wherein the
1975, the company launched the first commercially available glucose biosensor
for clinical use (Figure 2.3).8,9,46
Figure 2.4: Schematic of how artificial mediators are used to shuttle electrons, where (ox) is the oxidized formed and the (red) is the reduced formed of the glucose oxidase (Gox) and the mediator (M).
The variation of oxygen in the blood limits the detection of glucose since
the consumption of oxygen is needed to react with glucose to form the necessary
products for detection. So to compensate for this limitation, a non – physiological
electron acceptor (artificial mediator) was studied in order to replace the
dependency of oxygen.2,8,9,13,46 Artificial mediators were useful because it allowed
electrons to travel back and forth from the enzyme center to the electrode during
its oxidized and reduced forms (Figure 2.4). Artificial mediators such as
ferrocene derivatives, ferrocyanide, conducting organic salts or quinone
compounds have been used extensively.2,8,9,13,46 In the selection of mediators,
they should be stable molecules that posse good electrochemical properties. In
addition, the mediators should be capable of reacting with the enzyme in order
Figure 2. 5: An example of the home – based glucose sensor , Medisense Pen, used by diabetics.
Glucose sensing was taken one step further in order to establish electrical
contact between the mediator and electrode surfaces. Chemically modifying
electrodes eliminate the act of diffusion that occurs in free solution, while
stabilizing the movement of the mediator on the electrode, which offers high
current outputs.8,20,24 All of these advancements on electrochemical biosensors
led them into becoming marketable for home use. Commercially available
glucose sensors for home use involve a patient pricking his/her finger frequently
on a daily basis. Once a droplet of blood is drawn, the blood is applied to a
reagent strip where the enzyme is located. Then a glucose monitor relays a
reading of the glucose concentration in the blood. In the late 1980’s, Medisense,
Incorporated launched the first home based glucose sensor, The Medisense
Figure 2.6: (A) A picture of a GlucoWatch developed by the Cygnus, Inc., along with (B) sequences of events that occur in the sensor. (From URL: http://www.brookscole.com)
Lately, research has shifted focus from in vitro testing with reagent strips
to continuous monitoring with noninvasive testing.3,9,12,46 Remarkable progress
has been made towards the development of wearable sensors that are capable
of making frequent measurements. The wearable sensors have capabilities that
could limit the disruptions that diabetics face on a daily basis. In 1999, a
company named Minimed designed a continuous subcutaneous glucose device
(not shown). This amperometric sensor can be worn for up to three days at a
time.3,9,12,46 While inserted into the tissue, the levels of glucose concentration are
recorded every ten seconds as an average of readings is stored every five
minutes. However, this sensor did not limit the finger pricking process, as a
matter of fact; it still required several tests of finger pricking daily for calibration
purposes. In addition, the patient did not get feedback during use, but feedback
was stored for seventy-two hours and the information stored had to be
way to monitor glucose concentration based on reverse iontophoresis (Figure
2.6).3,9,12,46 Figure 2.6a shows an example of the device that is capable of taking
readings at least three times in one hour for twelve hours, at the same time
reducing the need of finger pricking from several times a day to once a day for
calibration purposes. The process of reverse iontophoresis applies a low
amplitude electrical current; glucose molecules are pulled through the skin
(Figure 2.6b). The glucose molecules are trapped in gel discs containing the
enzyme, glucose oxidase. Then the electrochemical sensor detects the glucose
concentration level, and a reading appears digitally on a watch display. This
noninvasive approach represents promising ways toward continuous glucose
monitoring; however, there are still challenges in this research.
The improvement and enhancement towards the development of
dependable continuous glucose monitoring with the reduction of frequent finger
pricking are currently being investigated. In spite of all the progressions in this
area, there are still challenges correlating to the stability and reliability of glucose
biosensors. For that, there is a need to continue the research efforts for the
success of glucose blood monitoring.
2.4 Formation of Monolayers
Further improvements include the use of chemically modified substrates
(electrodes) that involve the attachment of specific molecules. For over 30 years,
scientists studied modified electrodes for the expansion of electrochemical
research.49 Lane and Hubbard explained studying chemically modifying
electron transfer at electrode surfaces.49 Others described it as the ability to
convey greater selectivity to electrode surfaces that are limited to unmodified
electrodes.49 Modified electrodes consist of a layer of molecules bound to a metal
surface, in which they create what is known as monolayers (Figure 2.7).50-53
Figure 2.7: A general schematic of an ideal, organized monolayer on a metal substrate (electrode), where the alkane chains are bound to substrate and functional groups are attached to the terminal ends of the alkane chains.
An ideal monolayer exhibits well – ordered, packed alkane chains
(methylene groups – CH2) that are chemisorb to an electrode. Chemisorption
entails of an adsorptive interaction between a sulfur-containing molecule of
various lengths of alkane chains and an electrode.50-53 The most common
interaction is formed with sulfur containing molecules (sulfides, disulfides, and
thiols) and metal surfaces (gold, silver, and platinum). It is possible to attach a
wide range of functional groups to the terminal ends of alkane chains without
disrupting the formation of monolayers. Mixed monolayers can be assembled by
2.4.1. Self assembled monolayers (SAMs)
Generally there are two methods in the formation of monolayers: Langmuir
– Blodgett transfer and self – assembly.55 Compared to the other method, the self
– assembled methods produces more versatile monolayers with stronger
adsorption of sulfur – substrate (particular gold) bonds; therefore, this method will
be pursued in the following study.56,57 The self – assembled method deposits
thiols onto a substrate by forming monolayers spontaneously upon exposure to
the substrate (Figure 2.8). Self – assembled monolayers (SAMs) can be
deposited onto the surface of a substrate within minutes, which results into a
strong thiolate – substrate bond that is partially irreversible.56,57 The
chemisorption reaction between the gold electrode and the alkylthiol occurs after
the electrode is immersed into a diluted thiol solution, wherein yielding packed
and ordered monolayers.
2.4.2. Order in self assembled monolayers50,58-62
Consequently, the nature of the SAMs maybe altered due to the length of
the alkane chains or the functional groups. The length of the alkane chain can
determine how well ordered monolayers are formed. And the functional groups
influence how densely packed monolayers are formed. In a sensor, the functional
group acts the bioreceptor, and it is commonly immobilized on or in close
proximity to the surface of the transducer. The distance between the functional
group and the surface depends on the length of the alkane chain. The height of
the monolayer serves as a boundary between the molecular recognition and the
means of collecting data, which in turn is responsible for the sensitivity and
selectivity of sensors. Porter et al. showed that long alkanethiols (number of
methylene groups > 10) form well-ordered monolayers. A reduction in that
number can lead to less ordering. This order can be maintain as long as the
functional group is relatively small (<5 Angstroms). The packing and ordering
density of a SAM can be decreased as the functional group becomes bulkier.
When a mixed SAM is formed, there are no distinct phases; suggesting that there
is random ordering occurring.
2.4.3. Characterization of self assembled monolayers50,58-62 The electrochemical behaviors of monolayers are divided into two
categories according to terminal end groups of the alkane chain: nonelectroactive
and electroactive. Nonelectroactive terminal end groups produce monolayers that
block electrons from interacting with an electrode. The blocking characteristics of
these monolayers can characterize the interfacial capacitance on the substrate or
processes involve the exchange of electrons between the electrode and
molecules that can be reduced and oxidized. Also, it allows for a closer
evaluation of electrodes with the purpose of revealing any defects, such as
pinholes. Electroactive terminal end groups produce monolayers based on how
well electrons exchange with the electrode creating. For instance, the distance of
a reduction/oxidation (redox) couple gives rise to experiments that look at how
electrons are transfer. In the case of a reversible system, the responses studied
are governed by thermodynamics rather than kinetics. An example of an ideal
monolayer containing electroactive molecules can be characterized by a method
called cyclic voltammetry (will be discussed in Chapter 5).
The use of modified electrodes is growing in the marketplace as practical
devices for biosensors. The ease of formation can be quick and result in well
ordered monolayers that consist of a wide variation of functional groups. The
capability in characterizing and quantifying biomolecules deposited on electrodes
provides significant applications for various types of biosensors. Bioanalytical
molecules (or receptors) immobilized on electrode’s surfaces or near the
surfaces which link them to a transducer. When the immobilized bioanalytical
molecule recognizes an analyte, a signal is created which is related to the
concentration of the analyte. Applications for self – assembled monolayers focus
mainly on techniques such as electrochemical, optical, and quartz crystal
microbalance that generate information about specific properties or functions.
Forming monolayers via the self – assembled method are easy to prepare,
utilize biological molecules that are immobilized on electrodes for the
advancement of biosensors. In addition, binding events on SAMs that are
2.5 References
(1) Sherwood, L. Human Physiology: From cells to systems; Second ed.; West Publishing Company, 1993.
(2) Saudek, C.; Rubin, R.; Shump, C. The John Hopkins guide to diabetes for today and tomorrow; The John Hopkins University Press: Baltimore, 1997.
(3) Prevention, C. f. D. C. a. At URL: http://www.diabetes.org Accessed: 2003.
(4) Gough, D.; Armour, J. Diabetes 1995, 44, 1005.
(5) Heller, A. Annu. Rev. Biomed. Eng. 1999, 1, 153.
(6) At URL: http://www.fraserclan.com/biosen2.htm Accessed: 2002. (7) Centre, C. B. At URL:
http://www.cranfield.ac.uk/biotech/sensors/events.htm Accessed: 2004.
(8) Mohanty, S. At URL: http://citeseer.ist.psu.edu/mohanty01biosensor.html (9) Tonnesen, C.; Withrow, G. At URL:
http://www.hitl.washington.edu/scivw/EVE/I.D.1.c.Biosensors.html Accessed: 2002.
(10) Vo-Dinh, T.; Cullum, B. Fresenius J. Anal. Chem. 2000, 366, 540.
(11) Wang, J. Electroanalysis 2001, 13, 983.
(12) Clark, L.; Lyons, C. Ann. NY Acad. Sci. 1962, 102, 29.
(13) Cass, A.; Davis, G.; Francis, G.; Hill, H.; Aston, W.; HIggins, I.; Plotkin, E.; Scott, L.; Turner, A. Anal. Chem. 1984, 56, 667.
(14) Claremont, D.; Penton, C.; Pickup, J. J. Biomed. Eng. 1986, 8, 272.
(15) Wink, T.; Zuilen, S.; Bult, A.; Benneken, W. The Analyst 1997, 122, 43R.
(16) Murray, R.; Ewing, A.; Durst, R. Anal. Chem. 1987, 59, 379.
(17) Badugu, R.; Lakowicz, J.; Geddes, C. Anal. Chem. 2004, 76, 610.
(18) Hunter, I.; Jones, L.; Kanigan, T.; Brenan, C.; Sambol, L.; Sosnowski, L. In MIT Home Automation and Healthcare Consortium, 2000.
(19) Kissinger, P.; Heineman, W. Laboratory Techniques in Electroanalytical Chemistry; 2nd ed.; Marcel Dekker, Inc, 1996.
(20) Bain, C.; Whitesides, G. Angew. Chem. Int. Ed. Engl. 1989, 28, 5897.
(21) Brett, O.; Brett Electrochemistry; Oxford University Press: New York, 1998.
(22) Chidsey, C.; Loiacono, D. Langmuir 1990, 6, 682.
(23) Finklea, H., Ed. Self-assembled monolayers on electrodes; John Wiley & Sons Ltd., 1997.
(24) Bain, C.; Whitesides, G. J. Am. Chem. Soc. 1989, 111, 7164.
(25) Schreiber, F. Prog. Surf. Sci. 2000, 65, 151.
(26) Vassos, B.; Ewing, G. Electroanalytical Chemistry; John Wiley & Sons, Inc., 1983.
(27) Gunzler, H.; Williams, A. Handbook of Analytical Techniques; Wiley-VCH, 2001; Vol. II.
(28) Bain, C.; Troughton, E.; Tao, Y.; Evall, J.; Whitesides, G.; Nuzzo, R. J. Am. Chem. Soc. 1989, 111, 321.
(29) Flink, S.; van Veggel, C.; Reinhoudt, D. Adv. Mater. 2000, 12, 1315.
(31) Oldham; Myland Fundamentals of Electrochemical Studies, 1994.
CHAPTER 3:
INSTRUMENTAL ANALYSIS
3.1 Electrochemical Impedance Spectroscopy (EIS)
49,56,63,64Electrochemical impedance spectroscopy (EIS) is a technique that provides useful information into physical and chemical properties of SAM – modified surfaces (or a system). In impedance spectroscopy, a sinusoidal varying potential (V) with a known frequency is applied across a system. The response to this stimulus is an alternating current (I) through the system, and the quantity of interest is the impedance (Z) of the system.
V = IZ (1)
This application of applying a potential across a system, while generating a
current, can be related to the Ohm’s Law. The law relies on a constant potential
(V) that is applied across a resistance (R), which in turn induces a constant
current (I).
V = IR (2)
In other words, the impedance of a system is a ratio of voltage applied over the
current response. This value of this ratio can also be related to resistors,
capacitors, and inductors. Induction is not relevant to this research as it deals
with the rate at which energy is drawn from a source when the flow of electricity
is produced within a cell. Therefore, the research focuses on the properties of
capacitance (permits storage of charge) and resistance (opposes current to pass
Figure 3.9: The sinusoidal current and voltage (A) for a resistor when the phase shift is zero and (B) for a capacitor when the current lags the voltage.
In Figure 3.1A, when the applied potential and the current response are in
phase with each other, it is said that the system is behaving like a resistor.
Resistance is defined as a barrier to the flow of electronic charge. When there is
no capacitive component, the resistance, R, equals the impedance. The
impedance of a resistor is given by the equation:
Z = R (3)
In figure 3.1B, when the applied potential and the current response are out
of phase with each other, it is said that the system is behaving like a capacitor. In
other words, the result of the applied potential and the current response being
Capacitance is defined as the ability to retain or store charge. The impedance of
capacitor is given by the equation:
Z = 1/ωC = Xc (ω = 2πƒ) (4)
As a result of altering current in an electrical circuit, the energy needed to charge
the fields connected to the flow of electrons develops a counterforce known as
reactance. Hence, capacitance is represented by the term, Xc; therefore,
capacitance is a function of frequency.
Figure 3.2: The basic vector diagram used for resistance/capacitance (RC) circuit
Total opposition to the current, any impedance of resistors and capacitors,
must be added because of the phase differences; therefore, impedance
comprises of a real and an imaginary terms (Z’ and Z”, respectively) (Figure 3.2).
They are related by the following equation:
Z = Z’ – jZ” (where j = √-1) (5)
Hence, impedance is a complex number. The symbol, ІZІ, is given for the overall
angle, Φ, are obtained, the real and imaginary components can be generated. In
figure 3.2, the length of the vector stands for the magnitude (ІZІ) and the angle
(Φ) produced by the vectors, which are related to the real and imaginary parts.
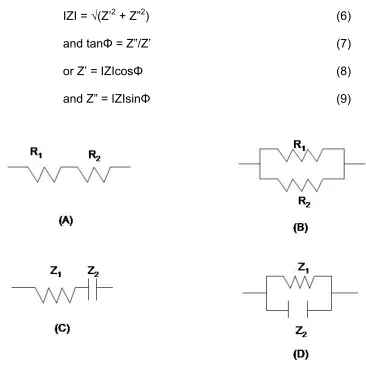
ІZІ = √(Z’2 + Z”2) (6)
and tanΦ = Z”/Z’ (7)
or Z’ = ІZІcosΦ (8)
and Z” = ІZІsinΦ (9)
Figure 3. 3: Circuits comprising of a resistor in the DC method (A)series and (B) parallel that can be related to the total impedance when the AC method is in (C) series and (D) parallel.
As a result, the real impedance, Z’, behaves like a resistor and the
imaginary impedance, Z”, behaves like a capacitor. As described previously, the
impedance in the alternating current (AC) method is related to the resistance in
the direct current (DC) method of the Ohm’s Law. The relationship between the
shown in the equivalent circuits (Figure 3.3). The calculations for the total
resistance are as followed:
Rt = R1 + R2 + … + Rn (series) (10)
1/Rt = 1/R1 + 1/R2 …+ 1/Rn (parallel) (11)
Noting that Z is the same as R, and capacitance is not considered. The
calculations for the total impedance are as followed:
Zt = Z1 + Z2 + … + Zn (series) (12)
1/Zt = 1/Z1 + 1/Z2 + … + 1/Zn (parallel) (13)
Figure 3.4: The simplest circuit used in electrochemical cells (systems).
An equivalent circuit is a useful way to elucidate the electrical behavior of
a cell that is stimulated by resistors and capacitors. Total impedance is
determined by the combination of resistors and capacitors that makes up an
equivalent circuit that can aid in determining measurements for impedance.
Equivalent circuits are the cores of impedance analysis where systems are
dissected among different electrodes (for examples, working, reference, or
counter electrodes) setup in an electrochemical cell. Unlike the simple
add another resistance, due to the electrolyte solution between the reference and
working electrodes. Therefore, the simplest circuit for an electrochemical system
contains a charge resistance, Rct, and a double layer capacitance, Cdl, in parallel
together and in series with a solution resistance, Rs (Figure 3.4).
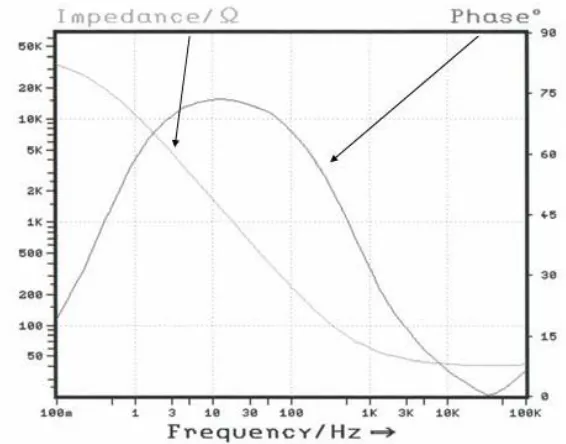
Figure 3.5: An example of a Bode plot representing a gold electrode in 0.1 HClO4 solutions from a BAS IM6 instrument.
From the equivalent circuits, impedance analysis can be interpreted by a
variety of plots, which show how simple circuits behave in combination. One way
to analyze impedance is through Bode plots. The Bode plot displays graphs that
have axes of total impedance (magnitude) and phase angle as a function of
frequency. The latter axis, frequency, gives this plot an advantage over the other
plots associated with real and imaginary axes because it’s easier to see how
frequency influences the impedance. Usually the axes are represented by a log
becomes easier. Figure 3.5 shows an example of a Bode plot of a gold electrode
in 0.1 HClO4 electrolyte solutions. In this example, there are three distinct
domains: a low frequency domain, mid frequency domain, and high frequency
domain. Recall, the phase shifts for resistance (0o) and capacitance (90o) are in
phase and out of phase with the applied AC bias, respectively. Observing the
Bode plot, there are two domains that the phase angle approaches 0o and the
impedance level out. These domains signify the cell behaving like a resistor. The
domain where the phase angle approaches 90o and the impedance values
increase linearly creating a straight line signifies the cell behaving like a
capacitor. This mid domain will be the focus of the research since it furnishes an
understanding of what is occurring on the surface.
Figure 3.6: Example of a complex plot for a simple electrochemical system
Another way to analyze impedance is through the real, Z’, and imaginary,
Z”, components computed from impedance measurements with the respect to
axes are known as complex plots. Other plots using the same axes are known as
Nyquist plots or Cole – Cole plots (differing in how the axes are calculated). The
impedance data are plotted with the imaginary component against the real
component of impedance at each frequency excitation (Figure 3.6). The expected
plot shows a semicircle (represents the resistance component) and a linear line
at the rightmost end of the semicircle (represents the capacitance component).
Complex plots are utilized primarily for the ease of revealing the effects of the
ohmic resistance in cells; wherein, the shape of the semicircle does not change
when the position of the reference electrode alters the resistance. However, the
values of frequency are not obvious in the appearance of the plots. Even though
it is easy to extrapolate resistance directly from the complex plots, it is difficult to
calculate the capacitance without knowing the frequency. Therefore, the Bode
plot will be used in the research.
The impedance technique holds some advantages over DC techniques
such as cyclic voltammetry and amperometry. One advantage is the use of
variable amplitude to facilitate minimal perturbation throughout the
electrochemical cell that in turns reduces the errors in measurements. Another
advantage is the information impedances provide such as the mechanistic
information on capacitance and charge – transfer of electrochemical systems.
3.2 Infrared Spectroscopy (IR)
57,67The application of IR conveniently gives a way to identify organic
compounds that are distinguished by different absorption patterns (in other
of radiation from ~12,800 to 10 cm-1 or from ~0.78 to 1000 µm-1. In most
instances, several analytical applications analyze these compounds in what is
called the mid – IR region, which extends from ~ 4,000 to 400 cm-1. The process
of identifying different compounds those posses’ dipole moments takes place
when the absorption of infrared radiation causes small energy differences that
exist between various vibrational states. When the vibrational states alter the
dipole moments, the magnitude of the energy variation caused by the distance
between centers of charges determines the absorbed radiation. This technique
can also be employed in the study of surface chemistry.
In this research, polarization modulation - infrared reflection adsorption
spectroscopy (PM-IRRAS) was used for the characterization of modified surfaces
and the binding ability between SAMs and other molecules. This method of IR
has advantages over conventional IR. For instance, interferences associated with
the atmosphere when using two different gold surfaces are essentially
eliminated, allowing for spectral acquisition in the mid – IR fingerprint region and
the use of a reference sample for background subtraction purposes is eliminated.
Problems such as contamination of the surfaces from handling the gold surfaces
and variability of sample positions from placing and removing from instrument
can be eliminated.
A typical spectrum produces outputs such as transmittance versus
wavelength and absorbance versus wavelength or wavenumbers. In this
research, the data will be represented as absorbance versus wavenumber
3.3 Cyclic Voltammetry (CV)
42,64,67Figure 3.7: An example of cyclic voltammetric excitation signal used to obtain voltammogram
Cyclic voltammetry is generally used for studying mechanisms and rates
of reduction/oxidation (redox) reactions. Hence, the application of cyclic
voltammetry is commonly the first technique to use when dealing with
electrochemical studies. In CV, current response of a system arises from a
triangular potential waveform seen in Figure 3.7. First the potential is ramped
linearly from an initial potential to a final potential. Once the final potential is
reached, the potential is scanned in the reverse direction until it is returned to its
original potential. The resulting plot of current versus potential applied is known
as a cyclic voltammogram. The shape of the CV typically consists of peak
formations seen in both scan directions if there are electroactive species present.
The position and shape of the peaks produces insightful information that
Figure 3.8: An example of a surface bound voltammetry for one – electrode redox couple; scan rate of 100 mV/s in 0.1 HClO4 aqueous solution.
Figure 3.8 illustrates a plot of the current response subjected to an applied
potential when a redox couple is bound to a surface or when electroactive
species are present. During an experiment, an initial potential is scanned in a
positive direction. Throughout the scan, the electroactive species begin to be
reduced at the working electrode. When majority of the species have been
reduced, a peak is observed. Next the potential is scanned in the opposite
direction causing the current to decay until a potential is reached where the
oxidation of the electroactive species begin to occur. Then, another peak is
observed. At this time, the potential cycle has been complete. In this research,
CV will be used in the investigation of electron transfer processes that transpire
between ferrocenylalkanethiols and gold surfaces as a function of glucose
3.4 References
(1) Kissinger, P.; Heineman, W. Laboratory Techniques in Electroanalytical Chemistry; 2nd ed.; Marcel Dekker, Inc, 1996.
(2) Monk, P. Electroanalytical Chemistry; John Wiley & Sons, Inc., 2001.
(3) Vassos, B.; Ewing, G. Electroanalytical Chemistry; John Wiley & Sons, Inc.,
1983.
(4) Wang, J. Analytical Electrochemistry; 2nd ed.; Wiley-VCH, 2000.
(5) Sawyer, D.; Sobkowiak, A.; Roberts, J. Electrochemistry for Chemists; Second
ed.; John Wiley & Sons, Inc.
(6) Macdonald, J. Impedance Spectroscopy, 1987.
(7) Yoo, J.; Park, S. Anal. Chem.2000, 72, 2035.
(8) Gunzler, H.; Williams, A. Handbook of Analytical Techniques; Wiley-VCH,
2001; Vol. II.
(9) Skoog, D.; Holler, F.; Nieman, T. Principles of Instrumental Analysis; Fifth ed.;
Saunders College Publishing, 1998.
CHAPTER 4:
INVESTIGATING THE INTERACTIONS BETWEEN
GLUCOSE AND BORONIC ACID BASED SELF
ASSEMBLED MONOLYAYERS
4.1 Introduction
The detection of glucose with high sensitivity and accuracy is important for
the field of biomedical research. The use of modified surfaces through monolayer
formation has led to an explosion in the area of biosensor technology. The
formation of a self – assembled (SAM) based on a strong covalent binding
binding between thiols (R – SH) and a metal surface is an ideal way to obtain
ordered and packed monolayers.50,52,53 The ability to equip any metal surface with
an alkane chain and a functionalized tail group is essential in constructing a
biosensor that can detect glucose. Many commercially types of sensors have
been constructed to date, but none have been successful in monitoring glucose
continuously. The fundamental phenomenon of molecular recognition plays an
important role in this process of detection. Phenylboronic acids are known in
literature as recognition molecules for sugars.26-28 The interaction between
phenylboronic acid derivative bound to a metal surface, as the active material,
and sugar, as the analyte, has been investigated through several techniques
such as infrared spectroscopy, cyclic voltammetry, SPR spectroscopy, and
Raman spectroscopy.29,30,33-36,38,39,68-74 Other research efforts have been examined