HIGHLIGHTED ARTICLE
| INVESTIGATION
Coordination of Cell Cycle Progression and Mitotic
Spindle Assembly Involves Histone H3 Lysine
4 Methylation by Set1/COMPASS
Traude H. Beilharz,* Paul F. Harrison,*,†Douglas Maya Miles,‡Michael Ming See,* Uyen Minh Merry Le,*
Ming Kalanon,§Melissa Jane Curtis,* Qambar Hasan,§Julie Saksouk,** Thanasis Margaritis,††
Frank Holstege,††Vincent Geli,‡,1and Bernhard Dichtl§,1 *Development and Stem Cells Program, Monash Biomedicine Discovery Institute and Department of Biochemistry and Molecular Biology and†Monash Bioinformatics Platform, Monash University, Melbourne, Victoria 3800, Australia,‡Marseille Cancer Research Center, U1068 Inserm, UMR7258 CNRS, Aix Marseille University, Institut Paoli-Calmettes, F-13009 Marseille, France. Equipe Labellisée Ligue,§Centre for Cellular and Molecular Biology, School of Life and Environmental Sciences, Deakin University, Burwood, Victoria 3125, Australia, **Institute of Human Genetics, UPR 1142, CNRS, 34396 Montpellier, France, and††Molecular Cancer Research, University Medical Center Utrecht–Princess Máxima Center for Pediatric Oncology, 3584 Utrecht, The Netherlands ORCID IDs: 0000-0002-8942-9502 (T.H.B.); 0000-0001-5514-4982 (B.D.)
ABSTRACTMethylation of histone H3 lysine 4 (H3K4) by Set1 complex/COMPASS is a hallmark of eukaryotic chromatin, but it remains poorly understood how this post-translational modification contributes to the regulation of biological processes like the cell cycle. Here, we report a H3K4 methylation-dependent pathway inSaccharomyces cerevisiaethat governs toxicity toward benomyl, a microtubule destabilizing drug. Benomyl-sensitive growth of wild-type cells required mono- and dimethylation of H3K4 and Pho23, a PHD-containing subunit of the Rpd3L complex.Dset1andDpho23deletions suppressed defects associated withipl1-2aurora kinase mutant, an integral component of the spindle assembly checkpoint during mitosis. Benomyl resistance ofDset1strains was accompanied by deregulation of all four tubulin genes and the phenotype was suppressed bytub2-423andDtub3mutations, establishing a genetic link between H3K4 methylation and microtubule function. Most interestingly, sine wavefitting and clustering of transcript abundance time series in synchronized cells revealed a requirement for Set1 for proper cell-cycle-dependent gene expression andDset1cells displayed delayed entry into S phase. Disruption of G1/S regulation inDmbp1andDswi4transcription factor mutants duplicated both benomyl resistance and suppression of ipl1-2 as was observed with Dset1. Taken together our results support a role for H3K4 methylation in the coordination of cell-cycle progression and proper assembly of the mitotic spindle during mitosis.
KEYWORDShistone methylation; gene expression; benomyl; cell cycle; aurora kinase
P
OST-TRANSLATIONAL modifications present on the amino-terminal tails of histone proteins are important regulators of gene expression and other chromatin-associated processes. Modifications include methylation, acetylation, phosphorylation, and ubiquitylation (Kouzarides 2007). H3K4 methylation is a hallmark of actively transcribed chromatin (Kouzarides 2007). While this modification itself does not have major consequences on chromatin structureper se, effector pro-teins carrying dedicated methyllysine binding domains like PhD fingers, chromo and tudor domains, as well as WD40 repeats, are thought to read and translate the presence of the mark (Tavernaet al.2007). Functional changes in chromatin struc-ture are achieved through indirect recruitment of complexesrepressive impact of H3K4 methylation on transcription. H3K4 dimethylation recruits deacetylase complexes to antagonize nu-cleosome acetylation and remodelling downstream of promoters (Kim and Buratowski 2009; Pinskaya et al.2009). Repressive function frequently involves regulation of antisense transcription (Margaritiset al.2012; Castelnuovoet al.2014).
While much effort has been spent to elucidate how H3K4 methylation states correlate with gene expression patterns (Briggset al.2001; Bernsteinet al.2002; Santos-Rosaet al.
2002; Boa et al.2003; Venkatasubrahmanyamet al.2007; Guillemetteet al.2011), less is known about associated bi-ological functions that are regulated via this chromatin mod-ification. Possibly, this is due to the more frequent analyses of steady-state conditions, for which H3K4 methylation appears to have a rather limited impact on mRNA levels, compared to dynamic gene expression processes, which appear to be im-pacted more strongly (Margaritiset al.2012; Weineret al.
2012). A notable exception is the Set1-dependent expression of genes required for ergosterol synthesis, which provides cells with resistance to the antifungal compound Brefeldin A (Southet al.2013).
Approximately two hundred genes are expressed specifi -cally during G1 phase in S. cerevisiae under control of two transcription factors: MBF and SBF (for recent review see Bertoli et al. 2013). Both factors are constituted by se-quence-specific DNA binding proteins Mbp1 and Swi4, re-spectively, that function in association with Swi6. While SBF and MBF both act as transcriptional activators of G1 genes, MBF appears to also function as repressor (Bean
et al. 2005) that represses G1 transcription outside of this cell-cycle phase (de Bruin et al. 2006); MBF target genes frequently contribute to DNA replication and repair. Interest-ingly, regulation of transcription at the G1/S boundary by MBF is controlled by DNA replication checkpoint kinases, which inactivate MBF via phosphorylation of its associated corepressor Nrm1 (de Bruin and Wittenberg 2009). This mechanism prevents cell-cycle entry until genotoxic stress has been resolved. The roles played by histone modifications in regulation of G1/S transcription remain to be clarified in yeast. In human cells it is well established that E2F transcrip-tion factors employ Set1 and MLL1 H3K4 methyltransferases during the G1/S transition (Tyagiet al.2007).
Interestingly, the Set1C complex has been involved in the regulation of chromosome segregation during mitosis (Zhang
et al. 2005). The kinetochore component Dam1 has been identified as nonhistone substrate for Set1C and its methyl-ation was suggested to antagonize phosphorylmethyl-ation by
Aurora kinase Ipl1 (Zhang et al.2005). Aurora kinase acti-vates the spindle assembly checkpoint (SAC), which ensures proper attachment of mitotic spindles to kinetochores at the onset of the metaphase–anaphase transition (Tanakaet al.
2002). Improper spindle attachment will be resolved through the activity of Ipl1 to allow spindle reattachment until all chro-matids have achieved a proper bipolar link (Tanaka et al.
2002; Dewaret al.2004). The absence of aurora kinase activ-ity is thus contributing to missegregation of chromatids. Whether the activities of Set1C in methylation of H3K4 and of Dam1 functionally interact remains unclear. It was proposed, however, that both substrates are controlled by overlapping regulatory pathways involving the ubiquitination of histone H2B on lysine K123, consistent with the existence of a coordinated function (Lathamet al.2011).
Benomyl is a microtubule destabilizing drug, which contains the active compound methyl benzimidazol-2-yl-carbamate (MBC). MBC is known to cause the depolymerization of microtubules in vivo (Jacobs et al. 1988) and in vitro
(Kilmartin 1981), most likely by directly binding to tubulin (Neffet al.1983). Interestingly, MBC treatment of yeast cells results in metaphase arrest and chromosome nondisjunction due to defective mitotic spindles (Wood 1982).
Here, we report the identification of a benomyl toxicity pathway that implicates Set1C and methylation of H3K4. Absence of methylation, or of the H3K4 methyl binding pro-tein Pho23, promotes resistance toward benomyl and the suppression of defects associated with a temperature-sensitive
ipl1-2allele. Our results implicate Set1C in proper transcrip-tional regulation during the cell cycle. G1 transcriptranscrip-tional regulators MBF and SBF recapitulate the requirement for benomyl-sensitive growth and suppression ofipl1-2. We suggest that Set1C and H3K4 methylation contribute to a functional cross-talk that coordinates cell-cycle progression with chromosome segrega-tion during mitosis.
Materials and Methods
Growth and manipulation of yeast strains
Strains used in this study are listed in Supplemental Material,
Table S1. Yeast were grown at 30°either in rich YPD me-dium (2% bactotryptone, 1% yeast extract, and 2 or 4% glucose), or in synthetic drop-out medium (0.67% yeast nitrogen base, 13amino acids, and 2 or 4% glucose). For the benomyl spot assays, cultures were grown in YPD me-dium overnight at 25° in 96-well microtiter plates under vigorous shaking. The next day, 20-fold serial dilutions were spotted on agar plates that either lacked or contained ben-omyl in DMSO (0, 20, and 40mg as indicated in thefigures). Plates were photographed following incubation at 30°until colonies formed, usually 1–3 days; slow growing mutants or low temperatures required longer incubation times. Assays in liquid culture were performed accordingly; however, the total OD600was maintained to,1.0 to ensure exponential growth.
Copyright © 2017 by the Genetics Society of America doi: 10.1534/genetics.116.194852
Manuscript received August 16, 2016; accepted for publication November 7, 2016; published Early Online November 14, 2016.
Supplemental material is available online atwww.genetics.org/lookup/suppl/doi:10. 1534/genetics.116.194852/-/DC1.
1Corresponding authors: Centre for Cellular and Molecular Biology, School of Life and
For synchronization, wild-type (WT) andDset1cells lack-ing the Bar1 protease were grown to an OD600of 0.3–0.4 and arrested in the presence of 5 mg/ml alpha-factor peptide for 2 hr; cells were checked under the microscope to ensure that at least 95% of cells were devoid of budding. Alpha-factor was removed by three consecutive washes in 10 mM Tris-HCl, pH 7.5, and the cell cycle was continued by resuspending the cells in prewarmed (30°) YPD me-dium. The 15-ml culture aliquots were collected in 15-min intervals.
To enable EdU incorporationSET1was deleted in strain W303 (RAD5) URA3::GPD-TK5x AUR1c::ADH-hENT1 in the labora-tory of Philippe Pasero [Institute of Human Genetics (IGH), Montpellier, France]. FACS and EdU-labeling experiments were performed as previously described (Talareket al.2015).
RNA extraction, RNA sequencing, and data analysis
Total RNA was extracted using the hot phenol method as de-scribed (Dichtl et al. 2004). For RNA-sequencing (RNA-seq) analysis, 1mg of total RNA was processed for 39-end focused RNA-seq by the poly(A) tail sequencing (PAT-seq) approach (Harrisonet al.2015). To identify genes differentially regulated between WT andDset1, the equivalent of paired samplest-test, with samples paired by time, was performed. The null hypothe-sis, being that expression varies over time, but at each time, is the same for both strains. The alternative hypothesis is that the ex-pression level differs between strains, this difference being the same at each time point. If there was a difference between strains that changes over time, this was viewed as noise and reduced the significance of the result. Read counts were transformed and weighted using limma’s voom function, then they were tested using Fitnoise as described in Harrisonet al.(2015). Like limma, Fitnoise uses an empirical Bayes method to moderate the esti-mate of residual variance for each gene based on residual vari-ance observed in other genes, increasing the statistical power. The data can be viewed interactively herehttp://rnasystems.erc. monash.edu/publications/datasets/cell_cycle_Set1/. Raw RNA-seq data have been deposited in the Gene Expression Omnibus (GEO) repository with accession no. GSE83162.
As the data are cyclic, ourfirst approach was tofit a sine wave with a period of 1 hr (reflecting the experimental sampling) but unknown amplitude and phase to the log-transformed expression levels. This had the advantage that it could befit as a linear model by decomposing the sine wave into sin and cos terms plus an intercept term, using a standard differential expression analysis approach. This was sufficient to identify a set of cycling genes in both WT andDset1(File S2), but examining these genes showed that a sine wave was not the bestfit to the data. The oscillation tended to decrease over time, and there was an initial perturbation associated with synchronization. Therefore, to more accurately charac-terize these data, we developed a nonlinear model with fur-ther parameters to take these effects into account. We aimed for a model complex enough to characterize the data, while remaining mathematically simple, settling on a damped har-monic oscillator with an additional exponentially decaying
term for any initial perturbation. This may also be viewed as the solution to a three variable matrix ODE:
fðxÞ5Aeð2BxÞsin
x
period1C
1D1Ee2Fx
where Ais the amplitude of the sine wave,Bis the rate of decay, period is 67.32 min,Cis the phase shift of the wave,D
is the vertical translation of the function,Eis the multiplica-tive coefficient for the exponential function, andFis the rate of growth of the exponential function. For Figure 3 and Fig-ure 4, a least squaresfit for this model was found by numer-ical optimization using the Nelder–Mead downhill simplex method. The model was fitted to log2-transformed read counts for each gene normalized to the control geneSRP68. Clustering was performed using mclust version 4 for R: (Frayleyet al.2012). Data werefirstfiltered for genes with.10 reads in all samples. Remaining reads were transformed us-ing the R package Varistan. This uses Anscombe’s variance stabilizing transformation for the negative binomial distribu-tion to produce moderated log2-transformed reads per million (RPM), in which noise is independent of expression level,
https://github.com/MonashBioinformaticsPlatform/varistran
(Anscombe 1948). Time series were further modified to be centered around a mean of zero. Nine clusters were found, using the mclust model“EII,”in which dimensions are uncor-related and have equal variance, and clusters are expected to be of equal size. The dimensions in this instance are the time points. For the purpose of clustering, the time series from the WT andDset1strains were treated as two separate points, so a gene may belong to one cluster in the WT and a different cluster inDset1.
39-end. Data were analyzed as for PAT-seq except that nor-malization was to SRP68 rather than RPM. To determine the extent of replication between data analyzed by PAT-seqvs.mPAT, circular correlation coefficient described in Jammalamadaka and SenGupta (2001). This is analogous to the Pearson correlation coefficient, but for angular variables.
Protein analysis
Protein extracts for Western blotting were prepared from 15-ml cultures using zirconium-bead homogenization. Cell pellets and zirconium beads 50% (v/v) were vortexed four times for 30 sec in 300ml total volume in lysis buffer (20 mM Tris-HCl pH 8.0, 150 mM KCl, 10% glycerol, 0.01% NP-40, 0.5 mM DTT, 0.5 mM PMSF, 1mM leupeptin, 1mM pepstatin, and 0.15mM aprotinin). Crude extracts were cleared by three consecutive 30-min centrifugation steps at maximum speed in a table-top centrifuge at 4°and concentration of total pro-tein was determined by Bradford analysis. For Figure 4B, 40– 50mg total protein were separated on two different NuPAGE 4–12% Bis-Tris mini gels, which were then transferred side by side onto a single PVDF membrane in a semidry blotting apparatus (Bio-Rad, Hercules, CA). Antibodies for detection of alpha-tubulin (Abcam ab6161) were used in a 1:1000 di-lution. A slower migrating nonspecific band was used as ref-erence (loading control) for quantification, which was done with Image Lab software.
Strains are available upon request. File S1 contains RNA-seq data derived from cell-cycle experiments. File S2
contains information about sine wave genes and cluster changing genes.Table S1contains the list of strains used in this study. Table S2 contains sequences of oligonucleotides used. The data can also be viewed interactively at the follow-ing website:http://rnasystems.erc.monash.edu/publications/ datasets/cell_cycle_Set1/.
Data availability
The authors state that all data necessary for confirming the conclusions presented in the article are represented fully within the article. Raw RNA-seq data have been deposited in the GEO repository with accession no. GSE83162.
Results
H3K4 methylation governs benomyl toxicity
To test for a potential role of H3K4 methylation in cell-cycle control, we performed drop-test assays on rich YPD media in the absence and presence of the microtubule destabilizing drug benomyl. We found thatDset1strains displayed a dis-tinct growth advantage compared to WT at 25°for 20mg/ml benomyl, while 40mg/ml gave the strongest differences at 32°(Figure 1A). In liquid YPD media containing 40mg/ml benomyl, both WT and Dset1 strains underwent one dou-bling of the OD600, with growth severely reduced after 2 hr. However, after 6–7 hr (two to three doublings of the OD600),
the curves diverged withDset1displaying a growth advan-tage over WT (Figure 1B).
We asked whether the benomyl phenotype correlated with defects in H3K4 methylation status that we previously asso-ciated with Set1C mutants (Schneideret al.2005; Dehe and Geli 2006; Margaritiset al.2012).Dset1,Dswd1, andDswd3 strains are deficient in formation of H3K4 me1, me2, and me3 andDsdc1andDbre2mutants are deficient in formation of me2 and me3, with less impact on me1;Dspp1is mainly de-ficient in me3 but maintains robust levels of me1 and me2;
Dshg1is dispensable for methylation activity and even results in higher level of me2 and me3 (Dehe and Geli 2006; Margaritiset al.2012). Figure 1C shows analyses of mutants derived from BY4741 background strains.Dset1,Dswd1, and
Dswd3displayed the most robust resistance toward benomyl, whileDsdc1andDbre2showed a low level of resistance and
Dspp1andDshg1had similar sensitivity as WT. Moreover, a catalytically deficient Set1 G951S mutant (Nislow et al.
1997; Sollieret al.2004) displayed robust resistance relative to isogenic WT, although lower thanDset1. These results in-dicated that loss of H3K4 methylation and not the absence of any Set1C subunits caused benomyl resistance (Figure 1C). Consistent with this, a H3K4A cismutation duplicated the growth advantage on benomyl; in contrast, H3K9A or H3S10A mutations behaved like WT (Figure 1D).
Dissection of benomyl-resistance pathways identifiesDpho23
To evaluate the significance of the benomyl phenotype asso-ciated with H3K4 methylation, we analyzed mutants affecting chromatin structure (Figure S1A). No benomyl-resistant growth was observed withDset2, which is deficient in meth-ylation of H3K36,Ddot1, which lacks methylated H3K79, and it was also not dependent on Jhd2, the H3K4 demethylase. Strains lacking the Bre1 ubiquitin ligase (E3) that monoubi-quitylates H2BK123 to promote H3K4 me2 and me3 (Sun and Allis 2002) showed benomyl growth similar to Dset1, while the absence of the Rad6 ubiquitin-conjugating enzyme (E2) that functions in the same pathway had less effect. We also tested mutants of the Paf1 complex, which is known to promote H3K4 methylation (Krogan et al.2003; Ng et al.
2003b). Interestingly,Drtf1, but none of the other Paf1C mu-tants (Dpaf1,Dleo1,Dctr9, andDcdc73) displayed a strong benomyl phenotype. SinceDrtf1 is associated with global loss of H3K4 me1 (Nget al.2003a; Deheet al.2005), it confirmed that benomyl resistance may be largely due to the loss of this modification. In contrast, the Not4 ubiquitin ligase (E3) that regulates levels of the Jhd2 demethylase (Mersman et al.
2009) did not impact on benomyl resistance, consistent with its requirement for H3K4 me3 (Laribeeet al.2007; Mulder
et al.2007); furthermore, no resistance was observed with
Dccr4, which forms an alternative deadenylase complex with Not4 (Tuckeret al.2001).
PhDfinger proteins Pho23, Set3, Bye1, and Cti6 have been implicated in recognition of methylated H3K4 (Shi et al.
Dpho23duplicated resistant growth in the presence of 40mg/ml benomyl (Figure S1B), which is consistent with the idea that Pho23 contributed to the H3K4 methylation-dependent benomyl phenotype. Interestingly, Pho23 is associated with the Rpd3L histone deacetylase complex (Loewith et al.
2001). We thus analyzed HAT and HDAC activities to further define benomyl resistance. HAT mutants Dhat1, Dgcn5,
Dvps75, andDrtt109grew similarly to WT, whileDyaf9 dis-played some hypersensitivity. Of the HDAC mutants analyzed here, we found that Drpd3 displayed hypersensitivity, whereasDhda1andDhda2displayed resistance.Dhda3and
Dhos1,Dhos2,Dhos4,Dcpr1,Dsif2,Dsin3, andDsnt1 compo-nents of HDACs Set3C, Rpd3S, and Rpd3L showed no clear growth phenotypes. Of all analyzed HAT and HDAC compo-nents, onlyDpho23,Dhda1, andDhda2mutants showed in-creased resistance toward benomyl. While Pho23 has been shown to mediate Rpd3L activity on chromatin (Loewith
et al. 2001), it seems possible thatDrpd3mutants did not duplicate benomyl resistance (indeed it displayed hypersen-sitivity) perhaps because the protein is associated with mul-tiple complexes that may have opposing effects (Carrozza
et al.2005; Keoghet al.2005).
Benomyl-resistance mutations genetically interact with Aurora kinase Ipl1
mutations. When Dset1 and ipl1-2were combined, we ob-served suppression of ts growth at intermediate tempera-tures, 32°, but not at 37° (Figure 2A), consistent with previous reports (Zhanget al.2005). Interestingly,Dset1also suppressed hypersensitive growth ofipl1-2in the presence of benomyl. Genetic suppression of both ts and benomyl pheno-types ofipl1-2strains byDset1suggests that both phenotypes resulted from the same underlying biochemical defect.
Next, we testedDpho23and observed suppression of ipl1-2ts growth at intermediate temperatures (32°) but not at 37° (Figure 2B). In addition,Dpho23conferred some suppression of theipl1-2hypersensitive growth on benomyl but appeared less potent in this capacity compared toDset1. These obser-vations link Pho23 to Aurora kinase. Since Pho23 contains a PHD domain, these results were consistent with the idea that methylation of H3K4 contributed to the regulation of chro-mosome segregation.
Transcriptional profiling of synchronized cells reveals defective gene transcription inDset1 strains
In an attempt to identify gene expression changes that pro-moted enhanced benomyl resistance for Dset1 strains, we initially employed microarray analyses and RNA isolated from asynchronous WT and Dset1 cultures grown for 5 hr in the presence or absence of 40 mg/ml benomyl. However, gene expression associated withDset1under these conditions was highly similar to results obtained with strains grown in synthetic complete (SC) media (Margaritiset al.2012) and did not enable us to identify gene expression changes, which could account for the benomyl-resistance phenotype (data not shown).
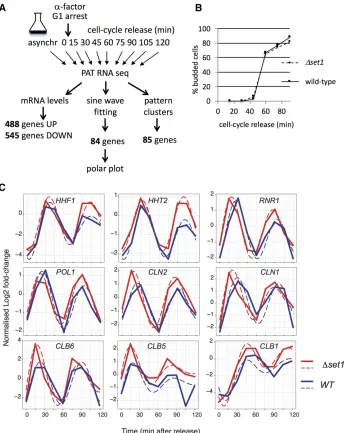
We reasoned thatfluctuation of expression levels during the cell cycle may potentially escape detection in an asyn-chronous culture. Because of that, we synchronized WT and
Dset1strains through alpha-factor block and analyzed gene expression changes following release into the cell cycle using PAT-seq, a custom RNA-seq approach (Figure 3A; Harrison
et al.2015). This identified transcripts that deviated between both strains with high significance over the 2-hr duration of the experiment (P-value,0.05;File S1). A total of 448“UP” genes had higher levels in Dset1 compared to WT, and 545“DOWN”genes displayed lower levels (File S1). Gene ontology terms of UP genes revealed metabolic processes, consistent with an up-regulation of stress response genes as previously reported (Margaritiset al.2012; O’Duibhiret al.
2014). The DOWN genes, in contrast, were enriched in terms related to conjugation, reproduction, and pheromone re-sponse, suggesting that H3K4 methylation contributed to these processes (File S1).
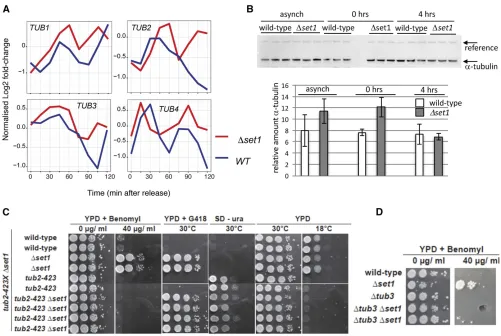
Increased tubulin expression inDset1 strains
Most interestingly, we found that all four tubulin messenger RNAs (mRNAs), TUB1, TUB2, TUB3, andTUB4 were con-tained in the UP genes (Figure 4A). Since benomyl interacts with tubulin (Neffet al.1983), increased TUB gene expression may contribute to the observed resistance to the drug. To fur-ther consolidate this observation, we analyzed alpha-tubulin protein levels (Tub1 and Tub3) in strains before and after alpha-factor synchronization (Figure 4B). We found thatDset1 cells displayed increased levels of alpha-tubulin relative to WT when cells were arrested in G1 (0 hr); an apparent increase of alpha-tubulin inDset1in asynchronous culture was observed in some but not all experiments.
We further evaluated the link between tubulin and the observed benomyl resistance by combiningDset1with tubulin mutations. We used a deletion of the nonessentialTUB3gene, which contributes about 10% of the cellular alpha-tubulin protein (Bode et al. 2003) and the cold-sensitive (cs)
Figure 2 Genetic interaction ofDset1and
Dpho23 with aurora kinase ipl1-2. (A) A diploid strain containing the Dset1 and temperature-sensitiveipl1-2mutations was sporulated and haploid ascospores with the genotypes indicated on the left were obtained. Drop tests were done as de-scribed in Figure 1A at indicated tempera-tures on YPD, YPD containing G418, and YPD containing 20 mg/ml benomyl. Defi -cient growth at 37° is due toipl1-2 and growth on G418 marks the Dset1 allele. (B) A diploid strain containing theDpho23 and temperature sensitiveipl1-2mutations was sporulated and analyzed as described in A above. Deficient growth at 37°is due to ipl1-2and growth on G418 marks the
tub2-423 allele, which has been found to be defective in spindle elongation (Reijoet al.1994). Interestingly, both tu-bulin mutations conferred benomyl sensitivity toDset1, dem-onstrating that disturbance of tubulin levels and function, respectively, interfered with the benomyl growth phenotype (Figure 4C). Conversely, however, the cs growth oftub2-423
was not suppressed by Dset1, consistent with the idea that Set1 was impacting on tubulin function indirectly via H3K4 methylation rather than direct interaction with tubulin protein.
Requirement for Set1 in cell-cycle-dependent gene expression
Inspection of cell-cycle-dependent genes in WT and Dset1 revealed tightly aligned timing and levels for a selection of genes, including POL1 and HHF1 (Figure 3C). For other genes, we observed distinct differences for both cell-cycle phase and/or expression levels. For example, expression of
RNR1(G1 phase) andHHT2(S phase) occurred slightly ear-lier inDset1, where the latter also showed a subtle increase of expression in Dset1. The G1 cyclins CLN1 and CLN2, the S-phase cyclins CLB5, andCLB6 and the G2/M cyclinCLB1
peaked slightly earlier at elevated levels inDset1. These ob-servations suggested a requirement for Set1 in the proper expression of cell-cycle-regulated genes and prompted a search for genes that displayed a shift in phasing or in ampli-tude between WT and Dset1. For this purpose, we initially fitted the data to a sine wave and identified 84 genes [false discovery rate (FDR) 0.05] that best adhered to such an ex-pression pattern in both strains (File S2).
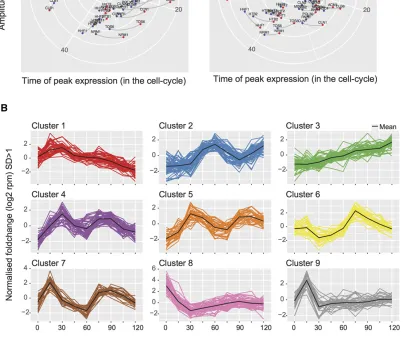
To visualize the impact ofDset1on cell-cycle phase, polar plots were constructed (Figure 5A,Figure S2and see Mate-rials and Methods). The polar plots highlight changes in sine wave phasing as lines that are parallel to the time coordinate and that connect peak expression levels. In contrast, lines that are not parallel to the time coordinate indicate differences
between peak expression levels. Polar plots thus highlight dif-ferences in phasing, peak expression, or both. The mathemat-ical modeling in these data summarize all data points after cell-cycle release. Strikingly, the majority of gene expression changes resulted in slightly earlier onset and/or peak levels in
Dset1 and occurred within 20–40 min, covering mainly the G1/S phase (Figure S2). Consistent with this, the GO term analysis of the 84 sine wave gene sets revealed highly signif-icantP-values for G1/S-specific genes involved in DNA dam-age, DNA repair, cell cycle, and DNA replication (File S2). To verify expression data obtained with the global RNA-seq ap-proach, an independent biological replicate of the cell-cycle experiment was performed and analyzed, using a multiplexed amplicon sequencing approach (mPAT; Figure 5A, see Mate-rials and Methods). The data from the two approaches were highly correlated in terms of phase and amplitude of cell-cycle expression (circular correlation coefficient of 0.9570182). We also observed qualitatively similar gene expression changes for
the majority of the analyzed genes underscoring the observa-tions made in the genome-wide approach (Figure S2). Nota-bly, only 9 of 84 sine wave genes can be found within the 1033 genes that contain both the 488 UP and 545 DOWN genes, illustrating a role for Set1 in differential cycle phasing in addition to oscillation amplitude.
We noted that strict sine wavefitting of the expression data were limited by perturbations at the start of the experiment when the alpha-factor block was removed and that damp-ening of the amplitude occurred in consecutive oscillations. We therefore refined the mathematical model with further parameters to take these effects into account (seeMaterials and Methods), and this was applied tofitting of both linear plots (dashed lines in Figure 3) and the polar plots in Figure 5.
To identify additional expression differences across the time course of cell-cycle reentry, the mclust R package was applied to accommodate all transcripts of the data set into nine discrete
expression clusters (Figure 5B; seeMaterials and Methods). This approach allowed us to search specifically for mRNA differences betweenDset1and WT with respect to their expression pattern through a change in cluster association. We identified 85“cluster changing”genes, which had a different expression profile in
Dset1, and 25 of these genes overlapped with the 84 genes identified by sine wave analysis (File S2). GO terms of cluster
changing genes with the highest statistical significance included the mitotic cell cycle and its regulation (File S2).
Delayed G1/S transition in theDset1 strain
The observed differences in gene expression suggested that
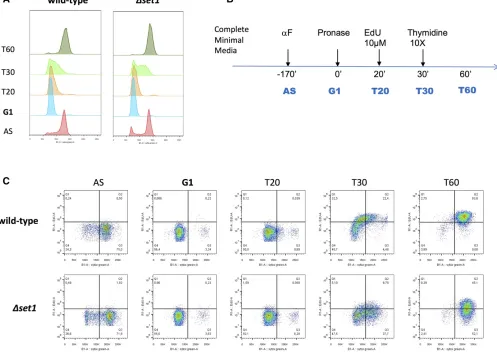
Dset1 strains may be defective in cell-cycle progression. To address this, we employed a new method that relies on the
Figure 5 Sine wave analysis and clustering of gene expression changes in WT andDset1strains. (A) Polar plots were constructed to visualize gene expression differences that occurred between WT andDset1strains due to differences in cell-cycle phasing. Lines parallel to the time coordinate indicated differences in the phasing of gene expression, whereas lines perpendicular to the time coordinate indicate differences in expression amplitude. The two plots show data collected from two independent biological experiments of the cell-cycle synchronization, thefirst analyzed by the PAT-seq approach the second by the mPAT approach as indicated. To avoid overloading of the representation, both plots only show those genes that were validated by mPAT. (B) To capture additional cell-cycle-dependant gene expression in WT andDset1strains, all transcripts having at least 10 reads in PAT-seq data were grouped using mclust. An optimal cluster number of nine was found using the in-built Bayesian information criterion. The data were thenfiltered to the expression patterns of genes having a SD of,1 (SD.1 log2-moderated transformation) from the cluster mean. From these data,
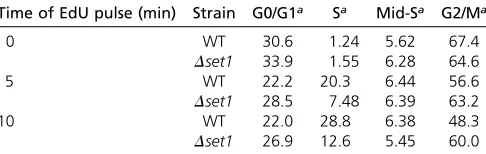
incorporation of the thymidine analog 59-ethynyl-29deoxyuridine (EdU) into DNA (Talareket al.2015). This procedure pro-vides high spatial and temporal resolution of cell-cycle phases inS. cerevisiaethat cannot be obtained by conven-tional FACS analyses (Talarek et al.2015). WT and Dset1 strains were generated that allowed the cellular uptake of EdU and exponentially growing cultures were exposed to three different EdU pulses of 0-, 5-, and 10-min duration. The incorporation of the analog into DNA was detected fol-lowing the attachment of azide-modifiedfluorochromes us-ing “click” chemistry allowing the determination of the fraction of cells in S phase. FACS analysis revealed repro-ducible differences of cell-cycle progression betweenDset1 and WT cells (Table 1 andFigure S3). For both EdU pulses, the percentage of cells that were in S phase was higher for the WT than forDset1(Table 1). To further confirm a distinct de-fect at the G1/S transition in theDset1mutant, alpha-factor-treated cells were released from the G1 arrest (Figure 6A). Twenty minutes after release from G1, EdU was added to the cultures for 10 min and then chased by addition of thymidine according to the scheme indicated in Figure 6B. Analysis of EdU incorporation in the FACS profile revealed a reduced number of cells in S phase in the Dset1mutant (Figure 6C). Taken together, these results indicate thatDset1cells exhibit a signif-icant delay at the G1/S transition.
Defective expression of G1-specific genes duplicates benomyl resistance
Our results implicate methylation of H3K4 by Set1C in cell cycle progression and the control of chromosome segregation. The predominant effect of methylated H3K4 in gene expres-sion appears to involve repressive mechanisms, which are relying on noncoding antisense RNA transcription (Margaritis
et al.2012; Weineret al.2012, Castelnuovoet al.2014). We therefore asked whether benomyl resistance of Dset1 was modulated by the 39–59exonuclease Rrp6, the main activity involved in the turnover of unstable noncoding RNA (ncRNA) (Wyerset al.2005). Interestingly, growth ofDrrp6 was comparable to WT in the presence of benomyl but the mutation promoted a complete suppression of benomyl re-sistance associated withDset1, possibly via the expression of ncRNA (Figure 7A).
We searched for evidence of ncRNA expression that could explain changes toTUB1-4expression within the cell cycle.
However, none of the four TUB genes was associated with ncRNA in previously reported tiling arrays of the yeast cell cycle (Granovskaiaet al.2010). We next searched tiling ar-rays from steady-state yeast bearing either single or double
Dset1 and Drrp6 mutations (http://steinmetzlab.embl.de/ cgi-bin/viewArrayProfile.pl). In these data, .7000 ncRNA are annotated and therefore most genes hold annotations for either antisense transcription, bidirectional promoter ac-tivity, or sense transcription associated with the promoter or the 39-UTR. For theTUBgenes, theTUB139-UTR overlaps in antisense with ncRNA2479/SUT287. TUB2 shows no evi-dence for local ncRNA expression (including for RUF21).
TUB3 is associated with an annotated RNA ncRNA2455, but which is not expressed at steady state in the mutants in question. The TUB4gene appears to be associated with bi-directional promoter activity that is Rrp6 dependent (ncRNA2263/CUT281); however, the expression of this RNA is anticorrelated with the upstream gene PHO84 and not TUB4. Therefore, none of these ncRNA easily explains the increase in TUBgene expression within the Dset1 cell cycle. Next, we searched the local ncRNA landscape around each of the 84 sine wave genes and 85 genes that change in cluster membership in the Dset1 cell cycle. Using the same criteria as above, 77/84 (92%) and 77/85 (90%) of the genes, respectively, were associated with annotated ncRNA either in the sense, antisense, or bidirectional configuration (seeFile S2). Two issues make direct comparisons between published expression of these ncRNA and their potential im-pact on our data problematic. First, we are comparing steady-state expression to cell-cycle expression in different strains. And second, while we see evidence for adenylated ncRNA expression in PAT-seq data, we did not identify changes in ncRNA expression that directly explain the phenotypes ob-served. For example, SUT287 is detected in our data with an adenylation site overlap of100 bases withTUB1; however, the expression of the ncRNA is not significantly different be-tween the WT and Dset1 cell cycle and thus cannot easily explainTUB1overexpression inDset1. In sum, the deregula-tion of a single ncRNA is unlikely to drive the complex changes to gene expression that underlie resistance to beno-myl or the earlyfiring of the cell cycle in theDset1mutant.
We considered the possibility that defective gene expres-sion of Dset1 during G1/S and delayed S-phase entry may contribute to benomyl-resistant growth. Since gene expres-sion during G1/S phase is regulated by the MBF and SBF transcription factors, we analyzedDmbp1andDswi4strains on benomyl and observed resistant growth similar toDset1 (Figure 7B). To further link G1/S transcription to chromo-some segregation, we then combined Dmbp1 and ipl1-2
mutations and we observed suppression of ts growth at in-termediate temperatures, 30°and 32°, but not at 37°(Figure 7C). Moreover,Dmbp1also efficiently suppressed hypersen-sitive growth ofipl1-2in the presence of benomyl. Similarly, suppression ofipl1-2ts growth and benomyl hypersensitivity was observed with Dswi4(Figure 7D). These data suggest that regulation of G1/S genes is intimately linked to the
Table 1 Distribution of WT andDset1strains in different cell-cycle phases as determined by EdU incorporation
Time of EdU pulse (min) Strain G0/G1a Sa Mid-Sa G2/Ma
0 WT 30.6 1.24 5.62 67.4
Dset1 33.9 1.55 6.28 64.6
5 WT 22.2 20.3 6.44 56.6
Dset1 28.5 7.48 6.39 63.2
10 WT 22.0 28.8 6.38 48.3
Dset1 26.9 12.6 5.45 60.0
aValues are fromFigure S3and indicate percentage of cells relative to total
proper implementation of the spindle assembly checkpoint during mitosis. Regulation of gene expression during G1/S phase may thus use H3K4 methylation to coordinate proper cell-cycle progression with chromosome segregation during the metaphase–anaphase transition.
Discussion
In this work, we analyzed a cellular pathway for benomyl toxicity and show that Set1C activity, probably at the level of monome-thylation, is required for WT benomyl sensitivity. This requirement involves histone methylation, since H3K4A strains duplicated benomyl resistance as did the absence of the H3K4 methyl binding protein Pho23. In an attempt to identify the molecular basis for benomyl resistance, we found that Set1C was required for proper maintenance of tubulin levels, the timely expression of genes during G1/S, and the transition into the S phase. In addition, suppression of temperature sensitivity and benomyl hypersensi-tivity associated withipl1-2linkDset1andDpho23to the regu-lation of chromosome segregation. Based on these observations we propose that H3K4 methylation contributes to the
coordina-tion of cell-cycle progression, which links regulacoordina-tion at G1/S to the metaphase–anaphase transition during mitosis.
The role of H3K4 methylation in regulation of gene ex-pression is now well established (Margaritis et al. 2012; Weineret al.2012; Castelnuovoet al.2014) but the impact of this regulation on the implementation of biological func-tion remains unclear. We synchronized WT and Dset1cells with alpha-factor pheromone and collected gene expres-sion data of cells following their release into the cell cycle. Approximately 500 transcripts were significantly up- or down-regulated in Dset1, respectively, during a 2-hr period of cell-cycle progression. In addition, we analyzed cyclic gene expression using sine wavefitting and a pattern clustering, which enabled the detection of differences with respect to cell-cycle phase, pattern, and peak level transcription.
In Figure 8 we summarize how H3K4 methylation can modulate benomyl toxicity. The metaphase-to-anaphase transition requires proper bipolar spindle–kinetochore at-tachment to ensure equal distribution of the genetic material into the emerging daughter cells (Musacchio and Salmon 2007). Benomyl induces cell-cycle arrest during mitosis,
since destabilization of microtubules triggers the SAC (Li and Murray 1991; Pinskyet al.2006). Growth in the presence of benomyl will thus be limited by the ability to resolve the SAC and to complete mitosis. Benomyl resistance may therefore be caused by enhanced microtubule stability or enhanced spin-dle formation. We considered it unlikely that detoxification was causing resistance, since overexpression of multidrug re-sistance genes was not observed inDset1. Interestingly, it was previously shown that benomyl sensitivity of mad mutants, which have compromised SAC function, could be suppressed by delaying exit from mitosis (Li and Murray 1991). In partic-ular, this was achieved by extending S phase with the ribonu-cleotide reductase inhibitor hydroxyurea, which promoted the formation of the mitotic spindle to compensate for the negative impact of benomyl (Li and Murray 1991). Our results are con-sistent with this proposal in that we observed misregulation of
G1/S gene expression inDset1and a defect in the transition to S phase. The argument is strongly supported by the fact that
Dmbp1andDswi4also displayed benomyl resistant growth. Gene expression at G1/S is thus intimately linked to beno-myl toxicity.
Aurora kinase, Ipl1, senses proper bipolar spindle–kinetochore attachment and resolves interactions in the absence of ten-sion (Dewaret al.2004). Since Ipl1 is essential for activation of the SAC (Pinsky et al. 2006) benomyl hypersensitive growth ofipl1-2ts strains likely is due to a failure to activate the SAC despite destabilized microtubules (Figure 8); there-fore, cells will continue cell-cycle progression and nondisjunc-tion of chromosomes will occur. Suppression ofipl1-2ts and benomyl phenotypes byDset1,Dpho23,Dmbp1, andDswi4is consistent with the proposal that defective H3K4 methylation and defective G1/S transcription cause enhanced microtubule
stability and/or enhanced spindle formation. Cell-cycle pro-gression will thus not have lethal impact despite a deficiency ofipl1-2cells in the activation of the SAC.
Dset1 cells display a concerted misregulation of tubulin genes and contained elevated alpha-tubulin levels. Since the active benomyl component MBC binds to microtubules, increased tubulin levels may directly contribute to benomyl resistance. It seems possible that the concerted overexpres-sion of multiple or all tubulin proteins, possibly together with other microtubule binding proteins, may be necessary to pro-mote benomyl resistance. This idea is underscored by the ob-servation that alpha-tubulin incorporation into microtubules is limited by the availability of beta-tubulin (Weinstein and Solomon 1990). Notably, Dset1 cells also had misregulated
TUB4, which represents gamma-tubulin that is involved in spin-dle pole body function (Sobel and Snyder 1995; Marschallet al.
1996). Interestingly,Dset1benomyl resistance was suppressed by cold-sensitive tub2-423mutations (Huffakeret al. 1988). This is consistent with the proposal thatDset1promotes micro-tubule stability as the mutation has been suggested to be de-ficient in spindle elongation (Reijoet al.1994). In contrast, the reason forDtub3to suppressDset1benomyl toxicity is less clear.Dtub3is nonessential for viability and Tub3 constitutes only 10% of alpha-tubulin, whereas Tub1 is the major alpha-tubulin component (Bodeet al.2003).Dtub3cells are benomyl sensitive (Schatzet al.1986), however, highlighting the contribution of all tubulin proteins to microtubule stabil-ity. Similarly,in vitroassembly experiments demonstrated dis-tinct effects of alpha-tubulin isotypes (Tub1 and Tub3) on microtubule dynamics (Bodeet al.2003).
It remains to be resolved how H3K4 methylation is in-tegrated with cell-cycle-dependent transcription. Since Rrp6 is required for benomyl resistance ofDset1it seems possible that ncRNA contributes to the regulatory mechanisms. Such a requirement could be linked to the activity of Rpd3L deacetylase that carries the methylated H3K4 binding activity of Pho23 (Loewithet al.2001). Published data indicate that ncRNA
ex-pression occurs widespread relative to Set1-dependent cell-cycle genes that were identified in this work. Strains lacking Rrp6, therefore, will harbor complex ncRNA expression patterns that are likely to have impact on the levels of a number of protein coding genes. The fact that we were not able to pinpoint a de-fined gene product to give rise to the benomyl-resistance pheno-type inDset1may indicate that the suppression of the phenotype in the absence of Rrp6 may result from the combinatorial impact on multiple genes.
Our results support a model in which transcriptional reg-ulation during the G1/S phase of the cell cycle is integrated with events that control the progression through the meta-phase–anaphase transition. The commitment of the cell to enter the cell cycle at “start” (G0) may thus be intimately linked to the implementation of chromosome segregation. We suggest that the link in part reflects the requirement to adjust the timing and duration of cell-cycle events to facilitate fluent transitions between cell-cycle phases. While this man-uscript was in preparation it was reported that benomyl re-sistance in theset1G951Smutant was associated with a thick mitotic spindle and regulation of the SAC resolution by H3K4 methylation. Schibleret al.(2016) proposed that theDset1 -induced benomyl resistance relies on sequestration of active C-Mad2 by H3K4me2/me3. While these observations appear to agree with our work and extend the repertoire of pathways that link H3K4 methylation to cell-cycle progression during mitosis, we clearly propose a different explanation for the benomyl resistance inDset1cells.
Control of the G1/S transition and thus of cell proliferation in humans involves H3K4 methylation and Mll and Set1 histone methyltransferases (Tyagiet al.2007). Our results suggest that yeast employs this chromatin modification to coordinate cell-cycle events. It will be interesting to see whether human cells employ H3K4 methylation to sustain similar cross-talk be-tween G1/S phase and mitosis. Future analyses of yeast Set1C likely will provide valuable insight to further the understand-ing of its higher eukaryotic homologs.
Acknowledgments
We are particularly grateful to Phillipe Pasero (Institute of Human Genetics, Montpellier, France) and Etienne Schwob (Institute of Molecular Genetics, Montpellier, France) for their help with EdU experiments and FACS analysis. We thank Sharon Dent (M. D. Anderson Cancer Center, Houston) for theipl1-2strain and Tim Huffaker (Cornell University, Ithaca, New York) for thetub2-423mutant. We thank David Powell from the Monash Bioinformatics and Monash Next Genera-tion Sequencing platforms, Micromon, and the Monash Health Translation Precinct’s Medical Genomics Facility.
Literature Cited
Anscombe, F. J., 1948 The transformation of poisson, binomial and negative-binomial data. Biometrika 35: 246–254.
Bean, J. M., E. D. Siggia, and F. R. Cross, 2005 High functional overlap between MluI cell-cycle box binding factor and Swi4/6 cell-cycle box binding factor in the G1/S transcriptional pro-gram inSaccharomyces cerevisiae. Genetics 171: 49–61. Bernstein, B. E., E. L. Humphrey, R. L. Erlich, R. Schneider, P. Bouman
et al., 2002 Methylation of histone H3 Lys 4 in coding regions of active genes. Proc. Natl. Acad. Sci. USA 99: 8695–8700. Bertoli, C., J. M. Skotheim, and R. A. de Bruin, 2013 Control of
cell cycle transcription during G1 and S phases. Nat. Rev. Mol. Cell Biol. 14: 518–528.
Boa, S., C. Coert, and H. G. Patterton, 2003 Saccharomyces cerevi-siae Set1p is a methyltransferase specific for lysine 4 of histone H3 and is required for efficient gene expression. Yeast 20: 827–835.
Bode, C. J., M. L. Gupta, K. A. Suprenant, and R. H. Himes, 2003 The two alpha-tubulin isotypes in budding yeast have opposing effects on microtubule dynamics in vitro. EMBO Rep. 4: 94–99. Briggs, S. D., M. Bryk, B. D. Strahl, W. L. Cheung, J. K. Davieet al.,
2001 Histone H3 lysine 4 methylation is mediated by Set1 and required for cell growth and rDNA silencing in Saccharomyces cerevisiae. Genes Dev. 15: 3286–3295.
Carrozza, M. J., B. Li, L. Florens, T. Suganuma, S. K. Swansonet al., 2005 Histone H3 methylation by Set2 directs deacetylation of coding regions by Rpd3S to suppress spurious intragenic tran-scription. Cell 123: 581–592.
Castelnuovo, M., J. B. Zaugg, E. Guffanti, A. Maffioletti, J. Camblong et al., 2014 Role of histone modifications and early termination in pervasive transcription and antisense-mediated gene silencing in yeast. Nucleic Acids Res. 42: 4348–4362.
de Bruin, R. A., and C. Wittenberg, 2009 All eukaryotes: before turning off G1-S transcription, please check your DNA. Cell Cy-cle 8: 214–217.
de Bruin, R. A., T. I. Kalashnikova, C. Chahwan, W. H. McDonald, J. Wohlschlegel et al., 2006 Constraining G1-specific transcrip-tion to late G1 phase: the MBF-associated corepressor Nrm1 acts via negative feedback. Mol. Cell 23: 483–496.
Dehe, P. M., and V. Geli, 2006 The multiple faces of Set1. Bio-chem. Cell Biol. 84: 536–548.
Dehe, P. M., M. Pamblanco, P. Luciano, R. Lebrun, D. Moinieret al., 2005 Histone H3 lysine 4 mono-methylation does not require ubiquitination of histone H2B. J. Mol. Biol. 353: 477–484. Dewar, H., K. Tanaka, K. Nasmyth, and T. U. Tanaka, 2004 Tension
between two kinetochores suffices for their bi-orientation on the mitotic spindle. Nature 428: 93–97.
Dichtl, B., R. Aasland, and W. Keller, 2004 Functions for S. cerevi-siae Swd2p in 39end formation of specific mRNAs and snoRNAs and global histone 3 lysine 4 methylation. RNA 10: 965–977.
Fraley, C., A. E. Raftery, T. B. Murphy, and L. Scrucca, 2012 mclust Version 4 for R: Normal Mixture Modeling for Model-Based Clustering, Classification, and Density Estimation. Technical Re-port No. 597. Department of Statistics, University of Washington, Seattle.
Granovskaia, M. V., L. J. Jensen, M. E. Ritchie, J. Toedling, Y. Ning et al., 2010 High-resolution transcription atlas of the mitotic cell cycle in budding yeast. Genome Biol. 11: R24.
Guillemette, B., P. Drogaris, H. H. Lin, H. Armstrong, K. Hiragami-Hamadaet al., 2011 H3 lysine 4 is acetylated at active gene promoters and is regulated by H3 lysine 4 methylation. PLoS Genet. 7: e1001354.
Harrison, P. F., D. R. Powell, J. L. Clancy, T. Preiss, P. R. Boaget al., 2015 PAT-seq: a method to study the integration of 39-UTR dynamics with gene expression in the eukaryotic transcriptome. RNA 21: 1502–1510.
Huffaker, T. C., J. H. Thomas, and D. Botstein, 1988 Diverse ef-fects of beta-tubulin mutations on microtubule formation and function. J. Cell Biol. 106: 1997–2010.
Jacobs, C. W., A. E. Adams, P. J. Szaniszlo, and J. R. Pringle, 1988 Functions of microtubules in the Saccharomyces cerevi-siae cell cycle. J. Cell Biol. 107: 1409–1426.
Jammalamadaka, S. R., and A. SenGupta, 2001 Topics in Circular Statistics. World Scientific, Singapore.
Janicke, A., J. Vancuylenberg, P. R. Boag, A. Traven, and T. H. Beilharz, 2012 ePAT: a simple method to tag adenylated RNA to measure poly(A)-tail length and other 39RACE applica-tions. RNA 18: 1289–1295.
Keogh, M. C., S. K. Kurdistani, S. A. Morris, S. H. Ahn, V. Podolny et al., 2005 Cotranscriptional set2 methylation of histone H3 lysine 36 recruits a repressive Rpd3 complex. Cell 123: 593–605. Kilmartin, J. V., 1981 Purification of yeast tubulin by self-assembly
in vitro. Biochemistry 20: 3629–3633.
Kim, T., and S. Buratowski, 2009 Dimethylation of H3K4 by Set1 recruits the Set3 histone deacetylase complex to 59transcribed regions. Cell 137: 259–272.
Kouzarides, T., 2007 Chromatin modifications and their function. Cell 128: 693–705.
Krogan, N. J., J. Dover, A. Wood, J. Schneider, J. Heidt et al., 2003 The Paf1 complex is required for histone H3 methylation by COMPASS and Dot1p: linking transcriptional elongation to histone methylation. Mol. Cell 11: 721–729.
Laribee, R. N., Y. Shibata, D. P. Mersman, S. R. Collins, P. Kemmeren et al., 2007 CCR4/NOT complex associates with the proteasome and regulates histone methylation. Proc. Natl. Acad. Sci. USA 104: 5836–5841.
Latham, J. A., R. J. Chosed, S. Wang, and S. Y. Dent, 2011 Chromatin signaling to kinetochores: transregulation of Dam1 methylation by histone H2B ubiquitination. Cell 146: 709–719.
Li, R., and A. W. Murray, 1991 Feedback control of mitosis in budding yeast. Cell 66: 519–531.
Loewith, R., J. S. Smith, M. Meijer, T. J. Williams, N. Bachman et al., 2001 Pho23 is associated with the Rpd3 histone deace-tylase and is required for its normal function in regulation of gene expression and silencing in Saccharomyces cerevisiae. J. Biol. Chem. 276: 24068–24074.
Margaritis, T., V. Oreal, N. Brabers, L. Maestroni, A. Vitaliano-Prunier et al., 2012 Two distinct repressive mechanisms for histone 3 lysine 4 methylation through promoting 39-end antisense transcription. PLoS Genet. 8: e1002952.
Marschall, L. G., R. L. Jeng, J. Mulholland, and T. Stearns, 1996 Analysis of Tub4p, a yeast gamma-tubulin-like protein: implications for microtubule-organizing center function. J. Cell Biol. 134: 443–454.
Miller, T., N. J. Krogan, J. Dover, H. Erdjument-Bromage, P. Tempst et al., 2001 COMPASS: a complex of proteins associated with a trithorax-related SET domain protein. Proc. Natl. Acad. Sci. USA 98: 12902–12907.
Mulder, K. W., A. B. Brenkman, A. Inagaki, N. J. van den Broek, and H. T. Timmers, 2007 Regulation of histone H3K4 tri-methylation and PAF complex recruitment by the Ccr4-Not complex. Nucleic Acids Res. 35: 2428–2439.
Musacchio, A., and E. D. Salmon, 2007 The spindle-assembly check-point in space and time. Nat. Rev. Mol. Cell Biol. 8: 379–393. Nagy, P. L., J. Griesenbeck, R. D. Kornberg, and M. L. Cleary,
2002 A trithorax-group complex purified from Saccharomyces cerevisiae is required for methylation of histone H3. Proc. Natl. Acad. Sci. USA 99: 90–94.
Neff, N. F., J. H. Thomas, P. Grisafi, and D. Botstein, 1983 Isolation of the beta-tubulin gene from yeast and dem-onstration of its essential function in vivo. Cell 33: 211–219. Ng, H. H., S. Dole, and K. Struhl, 2003a The Rtf1 component of
the Paf1 transcriptional elongation complex is required for ubiq-uitination of histone H2B. J. Biol. Chem. 278: 33625–33628. Ng, H. H., F. Robert, R. A. Young, and K. Struhl, 2003b Targeted
recruitment of Set1 histone methylase by elongating Pol II pro-vides a localized mark and memory of recent transcriptional activity. Mol. Cell 11: 709–719.
Nislow, C., E. Ray, and L. Pillus, 1997 SET1, a yeast member of the trithorax family, functions in transcriptional silencing and di-verse cellular processes. Mol. Biol. Cell 8: 2421–2436. O’Duibhir, E., P. Lijnzaad, J. J. Benschop, T. L. Lenstra, D. van
Leenen et al., 2014 Cell cycle population effects in perturba-tion studies. Mol. Syst. Biol. 10: 732.
Pinskaya, M., S. Gourvennec, and A. Morillon, 2009 H3 lysine 4 di- and tri-methylation deposited by cryptic transcription at-tenuates promoter activation. EMBO J. 28: 1697–1707. Pinsky, B. A., C. Kung, K. M. Shokat, and S. Biggins, 2006 The
Ipl1-Aurora protein kinase activates the spindle checkpoint by creating unattached kinetochores. Nat. Cell Biol. 8: 78–83. Pokholok, D. K., C. T. Harbison, S. Levine, M. Cole, N. M. Hannett
et al., 2005 Genome-wide map of nucleosome acetylation and methylation in yeast. Cell 122: 517–527.
Reijo, R. A., E. M. Cooper, G. J. Beagle, and T. C. Huffaker, 1994 Systematic mutational analysis of the yeast beta-tubulin gene. Mol. Biol. Cell 5: 29–43.
Roguev, A., D. Schaft, A. Shevchenko, W. W. Pijnappel, M. Wilm et al., 2001 The Saccharomyces cerevisiae Set1 complex in-cludes an Ash2 homologue and methylates histone 3 lysine 4. EMBO J. 20: 7137–7148.
Santos-Rosa, H., R. Schneider, A. J. Bannister, J. Sherriff, B. E. Bernstein et al., 2002 Active genes are tri-methylated at K4 of histone H3. Nature 419: 407–411.
Schatz, P. J., F. Solomon, and D. Botstein, 1986 Genetically es-sential and noneses-sential alpha-tubulin genes specify function-ally interchangeable proteins. Mol. Cell. Biol. 6: 3722–3733. Schibler, A., E. Koutelou, J. Tomida, M. Wilson-Pham, L. Wang
et al., 2016 Histone H3K4 methylation regulates deactivation of the spindle assembly checkpoint through direct binding of Mad2. Genes Dev. 30: 1187–1197.
Schneider, J., A. Wood, J. S. Lee, R. Schuster, J. Dueker et al., 2005 Molecular regulation of histone H3 trimethylation by COMPASS and the regulation of gene expression. Mol. Cell 19: 849–856.
Shi, X., I. Kachirskaia, K. L. Walter, J. H. Kuo, A. Lake et al., 2007 Proteome-wide analysis in Saccharomyces cerevisiae identifies several PHDfingers as novel direct and selective
bind-ing modules of histone H3 methylated at either lysine 4 or lysine 36. J. Biol. Chem. 282: 2450–2455.
Sobel, S. G., and M. Snyder, 1995 A highly divergent gamma-tubulin gene is essential for cell growth and proper microtubule organization in Saccharomyces cerevisiae. J. Cell Biol. 131: 1775–1788.
Sollier, J., W. Lin, C. Soustelle, K. Suhre, A. Nicolaset al., 2004 Set1 is required for meiotic S-phase onset, double-strand break forma-tion and middle gene expression. EMBO J. 23: 1957–1967. South, P. F., K. M. Harmeyer, N. D. Serratore, and S. D. Briggs,
2013 H3K4 methyltransferase Set1 is involved in maintenance of ergosterol homeostasis and resistance to Brefeldin A. Proc. Natl. Acad. Sci. USA 110: E1016–E1025.
Sun, Z. W., and C. D. Allis, 2002 Ubiquitination of histone H2B regulates H3 methylation and gene silencing in yeast. Nature 418: 104–108.
Talarek, N., J. Petit, E. Gueydon, and E. Schwob, 2015 EdU in-corporation for FACS and microscopy analysis of DNA replica-tion in budding yeast. Methods Mol. Biol. 1300: 105–112. Tanaka, T. U., N. Rachidi, C. Janke, G. Pereira, M. Galova et al.,
2002 Evidence that the Ipl1-Sli15 (Aurora kinase-INCENP) complex promotes chromosome bi-orientation by altering kinetochore-spindle pole connections. Cell 108: 317–329. Taverna, S. D., B. M. Ueberheide, Y. Liu, A. J. Tackett, R. L. Diaz
et al., 2007 Long-distance combinatorial linkage between methylation and acetylation on histone H3 N termini. Proc. Natl. Acad. Sci. USA 104: 2086–2091.
Tessarz, P., and T. Kouzarides, 2014 Histone core modifications regulating nucleosome structure and dynamics. Nat. Rev. Mol. Cell Biol. 15: 703–708.
Tucker, M., M. A. Valencia-Sanchez, R. R. Staples, J. Chen, C. L. Deniset al., 2001 The transcription factor associated Ccr4 and Caf1 proteins are components of the major cytoplasmic mRNA deadenylase in Saccharomyces cerevisiae. Cell 104: 377–386. Tyagi, S., A. L. Chabes, J. Wysocka, and W. Herr, 2007 E2F
acti-vation of S phase promoters via association with HCF-1 and the MLL family of histone H3K4 methyltransferases. Mol. Cell 27: 107–119.
Venkatasubrahmanyam, S., W. W. Hwang, M. D. Meneghini, A. H. Tong, and H. D. Madhani, 2007 Genome-wide, as opposed to local, antisilencing is mediated redundantly by the euchromatic factors Set1 and H2A. Proc. Natl. Acad. Sci. USA 104: 16609– 16614.
Weiner, A., H. V. Chen, C. L. Liu, A. Rahat, A. Klien et al., 2012 Systematic dissection of roles for chromatin regulators in a yeast stress response. PLoS Biol. 10: e1001369.
Weinstein, B., and F. Solomon, 1990 Phenotypic consequences of tubulin overproduction in Saccharomyces cerevisiae: differences between alpha-tubulin and beta-tubulin. Mol. Cell. Biol. 10: 5295–5304.
Wood, J. S., 1982 Genetic effects of methyl benzimidazole-2-yl-carbamate on Saccharomyces cerevisiae. Mol. Cell. Biol. 2: 1064–1079.
Wyers, F., M. Rougemaille, G. Badis, J. C. Rousselle, M. E. Dufour et al., 2005 Cryptic pol II transcripts are degraded by a nuclear quality control pathway involving a new poly(A) polymerase. Cell 121: 725–737.
Zhang, K., W. Lin, J. A. Latham, G. M. Riefler, J. M. Schumacheret al., 2005 The Set1 methyltransferase opposes Ipl1 aurora kinase functions in chromosome segregation. Cell 122: 723–734.
5 min EdU 25µM
10 min EdU 25µM
0 min EdU 25µM
Δ
set1
wild-type
Figure S3. Reduced levels of cells in S-phase in the
∆
set1
mutant.
Table S1: Yeast strains used in this study
Strain Genotype Source
BY4741 (wild-type) Mat a, his3, leu2, met15, ura3 Euroscarf YBD1122, set1 Mat a, his3, leu2, met15, ura3, set1:: KanMX4 Dehe et al., 2006 YBD780swd1 Mat a, his3, leu2, met15, ura3swd1:: KanMX4 Euroscarf YBD781swd3 Mat a, his3, leu2, met15, ura3swd3:: KanMX4 Euroscarf YBD783sdc1 Mat a, his3, leu2, met15, ura3sdc1:: KanMX4 Euroscarf YBD782bre2 Mat a, his3, leu2, met15, ura3bre2:: KanMX4 Euroscarf YBD779spp1 Mat a, his3, leu2, met15, ura3spp1:: KanMX4 Euroscarf YBD784shg1 Mat a, his3, leu2, met15, ura3shg1:: KanMX4 Euroscarf YBD247, H3
wild-type Mat , ura3-52, leu2-3,112, trp 1-289, his31, (hht1-hhf1)(hht2-hhf2) (CEN ARS URA3 HHT-1-HHF1)
Hsu et al., 2000
YBD245, H3K4A Mat , ura3-52, leu2-3,112, trp 1-289, his31, (hht1-hhf1)(hht2-hhf2) pBD364 (CEN ARS TRP1 HHT-1(K4A)-HHF1)
Dichtl et al, 2004
YBD246, H3K9A Mat , ura3-52, leu2-3,112, trp 1-289, his31, (hht1-hhf1)(hht2-hhf2) pBD364 (CEN ARS TRP1 HHT-1(K9A)-HHF1)
Dichtl et al, 2004
YBD228, H3S10A Mat , ura3-52, leu2-3,112, trp 1-289, his31, (hht1-hhf1)(hht2-hhf2) pBD364 (CEN ARS TRP1 HHT-1(S10A)-HHF1)
Hsu et al., 2000
SET1-G951S Mat a, ade2-101, trp11, leu21, his3200, lys2-801,
ura352, G951S::ura3 Sollier et al., 2004 Zk4, ipl1-2 MATα, lys2-801, his3-200, ura3-52, ipl1-2 Zhang et al, 2005 YBD1417mbp1 Mat a, his3, leu2, met15, ura3mbp1:: KanMX4 Euroscarf YBD1415swi4 Mat a, his3, leu2, met15, ura3swi4:: KanMX4 Euroscarf YCI001
set1 x ipl1-2 Mat a/, his3 his3-200, ura3/ ura3-52, SET1/set1:: KanMX4, IPL1/ ipl1-2
This work
YBD2246,
swi4 x ipl1-2 Mat a/, his3 his3-200, ura3/ ura3-52, SWI4/swi4:: KanMX4, IPL1/ ipl1-2 This work YBD2265,
mbp1 x ipl1-2 Mat a/, his3 his3-200, ura3/ ura3-52, MBP1/mbp1:: KanMX4, IPL1/ ipl1-2
This work
YBD 2267,
pho23 x ipl1-2 Mat a/, his3 his3-200, ura3/ ura3-52, PHO23/pho23:: KanMX4, IPL1/ ipl1-2 This work YBD2266,
rrp6 x set1 Mat a/, his3 HIS3 ura3/ura3, SET1/set1:: KlURA3, RRP6/rrp6:: KanMX4
This work
YBD2301,
rrp6set1 Mat a, ura3, SET1/set1:: KlURA3, RRP6/rrp6:: KanMX4
This work
YBD1243, bar1 Mat a, his3, leu2, met15, ura3bar1:: NatR This work YBD1273set1bar1 Mat a, his3, leu2, met15, ura3set1:: KanMX4,
bar1:: NatR
This work
CUY696 tub2-423 Mat , his3, ade2, leu2, lys2 tub2-423::URA3 Reijo et al., 1994 YBD2277
tub2-423 x set1 Mat a/, his3/ his3, ade2/ADE2, leu2/ leu2, lys2/LYS2 TUB2/tub2-423::URA3, SET1/set1:: KanMX4
This work
YBD2346
tub3 x set1 Mat a/, his3 HIS3 ura3/ura3, SET1/set1:: KlURA3, TUB3/tub3:: KanMX4
This work
set1 in E3087 W303 (RAD5) URA3::GPD-TK5x
AUR1c::ADH-hENT1set1 Talarek et al., 2015 YBD717bre1 Mat a, his3, leu2, met15, ura3bre1:: KanMX4 Euroscarf
YBD1496paf1 Mat a, his3, leu2, met15, ura3paf1:: KanMX4 Euroscarf YBD737leo1 Mat a, his3, leu2, met15, ura3leo1:: KanMX4 Euroscarf YBD740rtf1 Mat a, his3, leu2, met15, ura3rtf1:: KanMX4 Euroscarf YBD742ctr9 Mat a, his3, leu2, met15, ura3ctr9:: KanMX4 Euroscarf YBD743cdc73 Mat a, his3, leu2, met15, ura3cdc73::
KanMX4
Euroscarf
YBD2240not4 Mat a, his3, leu2, met15, ura3not4:: KanMX4 Euroscarf YBD2245not5 Mat a, his3, leu2, met15, ura3not5:: KanMX4 Euroscarf YBD2124ccr4 Mat a, his3, leu2, met15, ura3ccr4:: KanMX4 Euroscarf YBD2254pho23 Mat a, his3, leu2, met15, ura3pho23::
KanMX4
Euroscarf
YBD2113set3 Mat a, his3, leu2, met15, ura3set3:: KanMX4 Euroscarf YBD2255hos2 Mat a, his3, leu2, met15, ura3hos2:: KanMX4 Euroscarf YBD2256hos4 Mat a, his3, leu2, met15, ura3hos4:: KanMX4 Euroscarf YBD2257cpr1 Mat a, his3, leu2, met15, ura3cpr1:: KanMX4 Euroscarf YBD2258sif2 Mat a, his3, leu2, met15, ura3sif2:: KanMX4 Euroscarf YBD2259sin3 Mat a, his3, leu2, met15, ura3sin3:: KanMX4 Euroscarf YBD2260snt1 Mat a, his3, leu2, met15, ura3snt1:: KanMX4 Euroscarf YBD2261bye1 Mat a, his3, leu2, met15, ura3bye1:: KanMX4 Euroscarf YBD2262cti6 Mat a, his3, leu2, met15, ura3cti6:: KanMX4 Euroscarf YBD2252hat1 Mat a, his3, leu2, met15, ura3hat1:: KanMX4 Euroscarf YBD1086gcn5 Mat a, his3, leu2, met15, ura3gcn5:: KanMX4 Euroscarf YBD576yaf9 Mat a, his3, leu2, met15, ura3yaf9:: KanMX4 Euroscarf YBD2246rpd3 Mat a, his3, leu2, met15, ura3rpd3:: KanMX4 Euroscarf YBD2247vps75 Mat a, his3, leu2, met15, ura3vps75::
KanMX4
Euroscarf
YBD1378rtt109 Mat a, his3, leu2, met15, ura3rtt109:: KanMX4
Euroscarf