Diagrid Structure Square in Plan - Pushover
Kiran Kamath 1, Sachin Hirannaiah 2,Jose Camilo Karl Barbosa Noronha 3
Professor, Department of Civil Engineering, Manipal Institute of Technology, Manipal, Karnataka, India1 Post Graduate Student, Department of
Civil Engineering
, Manipal Institute of Technology, Manipal, Karnataka,India 2
Post Graduate Student, Department of
Civil Engineering
, Manipal Institute of Technology, Manipal, Karnataka, India 3ABSTRACT: This paper focuses on the study o f performance characteristics of diagrid structures square in plan
using pushover analysis. The models studied are square in plan with aspect ratio H/B, (where H is the total height and B is the base width of structure) varying from 2.67 to 4.26. Three differ en t ext er ior brace angles are considered. Seismic response of structure in terms of base shear and roof displacement corresponding to performance point were evaluated and compared. The base shear at performance does not show a specific trend with increase in the aspect ratio and brace angle considered in the study.
KEYWORDS: Diagrid Structure, Nonlinear Static Pushover Analysis, Aspect Ratio
I. INTRODUCTION
With the rapid growth of cites there is increase in number of tall buildings in the recent days. The need for structurally efficient system to resist lateral forces is gaining importance. Lateral forces induced from earthquake is the major hazard causing damage to the buildings. Among many structural forms diagrid structural form is favoured due to its structural efficiency and aesthetics. Diagrid structure is made up of perimeter grid consisting of braces in X shape. Structurally diagrid structure helps in reducing shear deformation as they carry lateral shear by axial action of diagonal members as studied by Moon et al. [1]. This type of structural form also helps in avoiding interior column and corner columns, thereby giving flexibility in floor plan. Panchal and Patel [2] compared a 20 storey frame structure with diagrid structure and found that top displacement is less in diagrid structure by performing equivalent static analysis.
II. RELATED WORK
Kim et al., (2010) [3] studied the seismic performance of typical diagrid structure. Plan of the structure considered was square of size 36m X 36m. Building of 36 storey. Also the performance is compared with tubular structure. Nonlinear static analysis and Dynamic analysis are carried out. It is concluded that as the slope of the brace increases, the effect of shear lag increases and lateral strength decreases. Diagrid structure with brace angle in between 60° and 70° seemed to be most efficient in resisting lateral as well as gravity loads.
III. PUSHOVER ANALYSIS
Pushover analysis can be categorized into two types, force controlled and displacement controlled. In force controlled analysis, the structure is subjected to lateral forces and the displacements are calculated. In displacement controlled method, the structure subjected to incremental increase in displacement and response is calculated.Krawinkler and Seneviratna [5] showed that pushover analysis gives insight to structural aspects that control performance during severe earthquake. Inel and Ozmen [6] carried out nonlinear static pushover analysis using SAP2000 software comparing the performance of the structure using default hinge properties and user defined hinge properties. They noticed that the result obtained from user defined hinge properties are more accurate
IV.PRESENTSTUDY
In the present study, steel diagrid structure model with brace angles of 59°, 71° and 78 and aspect ratios varying from 2.67 to 4.8 were modelled and analysed using ETABS. The width of the base is kept constant at 12m an d height of the structure is varied accordingly. The nonlinear behaviour of the elements is modelled using plastic hinges based on moment- curvature relationship as described in FEMA 356 [7] guidelines. PMM, M3 and P hinges are assigned to columns, beams and braces. A displacement controlled pushover analysis is performed.
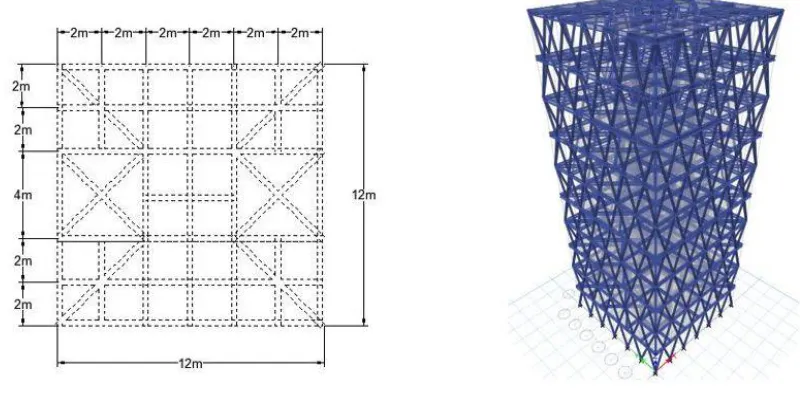
V. DESCRIPTIONOFSTRUCTURALMODEL
The model considered in the present study is square in plan. The typical plan, elevation and 3-D model of the diagrid structural model are as shown in Figure 1. The model has a base width of 12m and each of storey height 3.2m. All the structural models are assumed to be hinged at the base. The members are designed according to IS 800:2007 [8]. For beams, ISLB 300 sections are used. Columns are of ISWB 500 sections. For braces, steel tube section of outer diameter 150mm and 10mm thickness is used. Steel of grade Fe250 is used for all sections. The concrete slab of 150mm thick is considered in the present study. A rigid diaphragm is assigned to each floor. The density of concrete and steel are adopted as 25kN/m3 and 78.5kN/m3 respectively. The building is steel moment resisting frame and periphery brace members are considered to be pin jointed. The structure is situated in seismic zone III founded on a medium soil in accordance with IS 1893:2002 (Part I) [9].
.
VI. MODELLING DETAILS
Modelling and analysis has been done using ETABS. A basic computer model is created and user defined plastic hinges are incorporated. For user defined hinges moment-curvature data was generated for beams and columns using following equations.
My Zefy (1)
Mp Zpfy (2)
Mp = 1.18 Zpfy (1- (3)
Фp = Mp/EI (4)
Where My is the yield moment and Mp is the plastic moment for beams and can be obtained by Equations (1) and (2)
respectively. Zp is the plastic section modulus and Ze is the elastic section modulus. Equations (3) gives the plastic
moment for the column with varying axial load P and load at yield Py as per FEMA 356 [7]. Фp is the curvature
corresponding to plastic moment Mp and is obtained by Equation (4).
VII. RESULTS
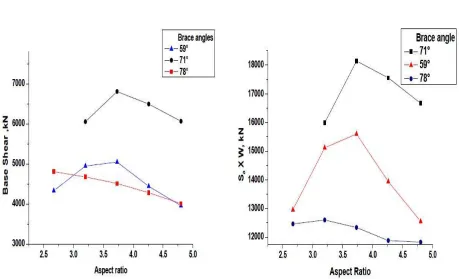
Figure 2: Variation of Base shear at Performance with Aspect Ratio for Different Brace Angles
Figure 3: Variation of Sa x W with Aspect ratio for different Brace Angles
From Figure 2 it can be observed that for models with brace angles 59° and 71°, the base shear at performance point shows an increasing trend up to an aspect ratio 3.73 and thereafter base shear follows a decreasing trend. Whereas for models with 78° brace angle, the base shear at performance shows a decreasing trend with increase in aspect ratio. Base shear is a function of spectral acceleration (Sa) and seismic weight (W). Base shear is directly proportional to Sa, and
seismic weight. From Table 1 it can be observed that with increase in aspect ratio, Sa at performance decreases. Also
with increases in aspect ratio seismic weight of structure increases. The plot of product of Sa and seismic weight vs.
with brace angle of 59° and 71°. This variation might be the probable reason for increase of base shear at performance for 59° and 71° brace angle model at aspect ratio 3.73. This type of changes are not observed for 78° brace angle model.
Table 1 Spectral acceleration at Performance Point for varying Aspect Ratio and Brace angles
Brace angle 59° 71° 78°
Aspect ratio Spectral acceleration , (mm/sec2)
2.67 0.902 - 0.858
3.2 0.877 0.8954 0.735
3.73 0.776 0.8709 0.52
4.26 0.606 0.7374 0.617
4.8 0.485 0.6224 0.439
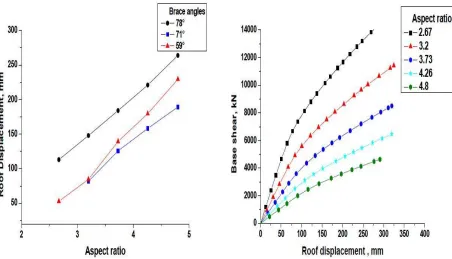
From Figure 4 it can be observed that for models with brace angles of 59°, 71° and 78° roof displacements at performance point shows an increasing trend with increase in aspect ratios. Models with 71° brace angle shows lesser roof displacements at performance at all the aspect ratio considered. While models with 78° brace angle have larger roof displacement at performance in comparison with roof displacements at performance for 59° and 71° brace angle models at all the aspect ratios considered. The reason for such behaviour might be due the larger brace angle (78°), due to which the structure is as a whole less stiff, hence forth gives larger roof displacements. Model with brace angle 71° and aspect ratio 2.67 does not have roof displacement at performance due to larger stiffness of the structural model.
Figure 4: Variation of Roof Displacement at performance with Aspect Ratio for Different Brace Angles Figure 5: Capacity Curves for 78° Structural Model of Different Aspect Ratio
models with lower aspect ratios have higher stiffness when compared to models with higher aspect ratio. It can also be observed that models are displaced linearly in the initial steps and thereafter show a non-linear behaviour due to yielding of members.
VIII. CONCLUSION
The following are the observations drawn from the present analysis
1. Variation of the base shear at performance with aspect ratio for different brace angles do not show a specific trend.
2. Models with 78° brace angle at all the aspect ratios considered in this study have higher roof displacement at performance.
3. Models with 71° brace angle at all the aspect ratios considered in this study have higher base shear at performance.
4. Brace angle and the aspect ratio influence the performance of the structure.
REFERENCES
[1] Moon, K., Connor, J., and Fernandez, J., “Diagrid Structural System for Tall buildings: Characteristics and Methodology for Preliminary Design”, the structural design of tall and special buildings, Vol. 16, pp.205-230, 2007.
[2] Panchal, N., and Patel, V., "Diagrid Structural systems: Strategies to reduce lateral forces on high rise building", International journal of Research
in Engineering andTechnology, Vol. 03, pp.2319-1163, 2014.
[3] Kim, J., Jun, Y., and Lee, Y., “Seismic Performance Evaluation of Diagrid System Buildings”, 2nd Specialty Conference on Disaster Mitigation
2010.
[4] ATC-40, “Seismic Evaluation and Retrofit of Concrete Buildings”, Applied Technical Council, California Seismic Safety Commission, Redwood City, California, 1996.
[5] Krawinkler, H., and Seneviratna, G., “Pros and cons of a push-over analysis of seismic performance evaluation”, Engineering Structures, Vol. 20, pp.452–464, 1998.
[6] Inel, M., and Ozmen, H., “Effects of Plastic Hinge Properties in Nonlinear Analysis of Reinforced Concrete Buildings”, Engineering Structures, Vol. 28, pp.1494–1502, 2006.
[7] FEMA 356, “Prestandard and Commentary for the Seismic Rehabilitation of Buildings”, Federal Emergency Management Agency, Washington DC, 2000.
[8] IS: 800, “General construction in steel-code of practice”, Bureau of Indian Standards, New Delhi, 2007.