Identifying Intrusion Patterns using a Decision Tree
Anusha Jayasimhan
M.E Computer studentThadomal Shahani Engineering College Mumbai,India
Jayant Gadge
Asst. Professor, Computer Department Thadomal Shahani Engineering College
Mumbai,India
ABSTRACT
Computer networks are usually vulnerable to attacks by any unauthorized person trying to misuse the resources.. Hence they need to be protected against such attacks by Intrusion Detection Systems (IDS). The traditional prevention techniques such as user authentication, data encryption, avoidance of programming errors, and firewalls are only used as the first line of defense. But, if a password is weak and is compromised, user authentication cannot prevent unauthorized use. Similarly, firewalls are vulnerable to errors in configuration and sometimes have ambiguous/undefined security policies. They fail to protect against malicious mobile code, insider attacks and unsecured modems. Therefore, intrusion detection is required as an additional wall for protecting systems.
Previously many techniques have been used for the effective detection of intrusions. One of the major issues is however the accuracy of these systems. To improve accuracy, data mining programs are used to analyze audit data and extract features that can distinguish normal activities from intrusions. This paper shows the implementation of by viewing intrusion detection as a data mining problem. One of the most common data mining approaches i.e classification via decision trees has been adopted to detect intrusion detection patterns.
General Terms
Pattern recognition, intrusion detection
Keywords
Decision trees, feature selection, data mining
1.
INTRODUCTION
With the rapid progression of computer technology, computer violations are increasing at a fast pace. Such malevolent activities become more and more sophisticated and can easily cause millions of dollar in damage to an organization. Detecting those intrusions becomes an important issue of computer security.
Generally, there exist two main intrusion detection techniques: anomaly detection and misuse detection. Misuse detection involves the comparison of observed traffic data with a set of extracted patterns that describe signatures of intrusions. If the signature of observed network traffic is matched with any of predefined rules, it is declared as an attack. This approach can detect the recognized attacks in an efficient way with high level of accuracy. However, it suffers from its inability of identifying attacks which differ from those predefined patterns. A minor variation of an attack may not be identified during the whole detection procedure. Anomaly detection stores the patterns of the network records that define a normal activity. It searches for intrusions by
comparing the incoming traffic against the stored patterns. If the pattern of observed data is different from those learned normal ones, the data is classified as an attack. This approach can successfully detect novel and unseen malicious occurrences from computer users.
This paper mainly focuses on the signature based intrusion detection systems and presents a way to identify signatures/patterns of harmful attacks by training the system on a database and testing the same. In order to support the training and testing the KDD dataset is used, which consists of different types of network connections labeled with the category.
2.
LITERATURE REVIEW
Currently building an effective IDS is an enormous knowledge engineering task. System builders rely on their intuition and experience to select the statistical measures for anomaly detection. Experts first analyze and categorize attack scenarios and system vulnerabilities, and hand-code the corresponding rules and patterns for misuse detection. Because of the manual and ad hoc nature of the development process, current IDSs have limited extensibility and adaptability. Many IDSs only handle one particular audit data source, and their updates are expensive and slow [1].In the following section some of the techniques that have already been used in the past have been discussed.
2.1
Genetic Algorithm
Genetic algorithms were originally introduced in the field of computational biology. Since then, they have been applied in various fields with promising results. Fairly recently, researchers have tried to integrate these algorithms with IDSs.
The REGAL System [2] [3] is a concept learning system based on a distributed genetic algorithm that learns First Order Logic multi-modal concept descriptions. REGAL uses a relational database to handle the learning examples that are represented as relational tuples.
2.2
Neural Networks
The application of neural networks for IDSs has been investigated by a number of researchers. Neural networks provide a solution to the problem of modeling the users’ behavior in anomaly detection because they do not require any explicit user model. Neural networks for intrusion detection were first introduced as an alternative to statistical techniques in the intrusion detection expert system (IDES) to model . In particular, the typical sequence of commands executed by each user is learned [5]. IDSs should involve the use of pattern recognition and learning by example approaches for the following two main reasons:
• The capability of learning by example allows the system to detect new types of intrusion.
• With earning by example approaches, attack “signatures” can be extracted automatically from labeled traffic data. This basically eliminates the inaccuracy and other problems introduced by the presence of the human factor.
2.3
Clustering Techniques
Clustering is another data mining technique used for finding patterns in unlabelled data with multidimensional data sets. It seeks to identify homogenous groups of objects based on the values of their attributes. Clustering and outlier detection are closely related From the viewpoint of a clustering algorithm, outliers are objects not located in the clusters of the data sets. Hence they are considered as an attack or an anomaly. The distance between points is a very important factor in clustering. The most common distance used is the Euclidean distance [6].
2.4
Fuzzy Logic
Fuzzy logic is derived from fuzzy set theory dealing with reasoning that is approximate rather than precisely deduced from classical predicate logic. It can be thought of as ”the application side of fuzzy set theory dealing with well thought out real world expert values for a complex problem”[7].
In Dickerson and Dickerson 2000 [8] the authors classify the data based on various statistical metrics. They then create and apply fuzzy logic rules to these portions of data to classify them as normal or malicious. They found that the approach is particularly effective against scans and probes.
An enhancement of the fuzzy data mining approach has also been applied by Florez et al[9] The authors use fuzzy data mining techniques to extract patterns that represent normal behavior for intrusion detection. They describe a variety of modifications that they have made to the data mining algorithms in order to improve accuracy and efficiency. They use sets of fuzzy association rules that are mined from network audit data as models of “normal behavior.” To detect anomalous behavior, they generate fuzzy association rules from new audit data and compute the similarity with sets mined from ”normal” data. If the similarity values are below a threshold value, an alarm is issued.
3.
DESIGN ISSUES
As mentioned before, intrusion detection can be viewed as a data mining problem. A basic premise for intrusion detection is that when there a huge amount of data presented to the system, it can extract some decisions and rules out of them. However, because of the sheer volume of data, both in the amount of network records and in the number of system features (i.e., the fields describing the network records), efficient and intelligent data analysis tools are required to
discover the behavior of system activities. This leads to some drawbacks in the intrusion detection systems.
• Current IDS are usually tuned to detect known service level network attacks. This leaves them vulnerable to original and novel malicious attacks.
• Data overload: Although not directly related with intrusion detection, a very large amount of data raises a problem as well. The system must be able to handle such a large amount of training data along with effectively analyzing it.
• False positives (FP): A common complaint is the amount of false positives an IDS will generate. A false positive occurs when normal attack is mistakenly classified as malicious and treated accordingly.
• False negatives: This is the case where an IDS does not generate an alert when an intrusion is actually taking place(Classification of malicious traffic as normal). Hence in order for making the system as efficient and accurate as possible the following issues have been considered.
3.1
Feature Selection
Feature selection, also known as subset selection or variable selection, is a process commonly used in machine learning, wherein a subset of the features available from the data is selected for application of a learning algorithm. Feature selection is necessary either because it is computationally infeasible to use all available features, or because of problems of estimation when limited data samples (but a large number of features) are present [10]. Features in a given data enhance the decisions that are made by the analysis of the dataset. A data set that includes a large amount of network traffic is necessary to be collected in advance for designing an intrusion detection system. The size of data collected from the network is always large. It includes a great amount of traffic records with a number of various features such as the length of connection, the type of protocol, the network service and other information. Based on this set of data, misuse detection techniques specify well defined attack signatures and anomaly detection techniques construct acceptable user behaviors.
3.2
Data mining
4.
SYSTEM ARCHITECTURE
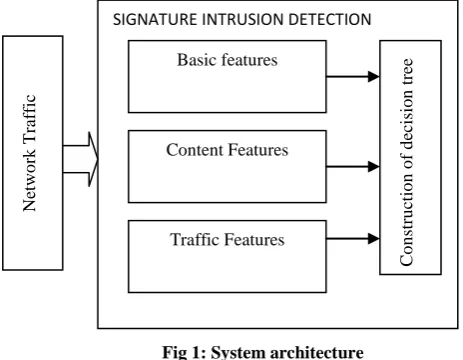
[image:3.595.53.285.175.355.2]In all the existing intrusion detection systems there exists a drawback of a high false positive rate. In order to improve the accuracy and the efficiency a very common classification approach i.e decision trees is used. The goal is to find rules that represent normal behavior of network traffic stream for the intrusion detection task. The issues discussed in the previous section is considered and the architecture of the system is shown in Fig 1 :
Fig 1: System architecture
The features of a network traffic can be classified broadly into 3 categories as described below [12].
4.1
Basic Features
Basic features can be derived from packet headers without inspecting the payload. this category encapsulates all the attributes that can be extracted from a TCP/IP connection. Most of these features lead to an implicit delay in detection.
4.2
Content Features
These features involve knowledge about the content i.e payload of the network packets. This includes features such as the number of failed login attempts. Content features, extracted from packet content within a connection, allow information at access level. They provide different indicators on connections status such as the number of root and access control files access, the identity of logged entity and others. Some attacks are embedded in the data portions of the packets, and normally involves only a single connection. To detect these kinds of attacks, we need some features to be able to look for suspicious behavior in the data portion, e.g., number of failed login attempts.
4.3
Traffic Features
These features are designed to capture properties that mature over a time based interval/window. One example of such a feature would be the number of connections to the same host over the 2 second interval. This category includes features that are computed with respect to a window interval and is divided into two groups:
a) “same host” features: examine only the connections in the past 2 seconds that have the same destination host as the current connection, and calculate statistics related to protocol
b) “same service” features: They examine only the connections in the past 2 seconds that have the same service as the current connection, behavior, service, etc.
The above two mentioned types of “traffic” features are called time-based. However, there are several slow probing attacks that scan the hosts (or ports) using a much larger time interval, for example, one in every minute. As a result, these attacks do not produce intrusion patterns with a time window of a few seconds. To solve this problem, the “same host” and “same service” features are re-calculated but based on the connection window of 100 packets.
4.4
Constructing the Decision Tree
C4.5 builds a decision tree where each internal node denotes an attribute, each branch represents an outcome of the test, and leaf nodes represent classes or class distributions. Here the leaf nodes represent the class of the network records i.e type of the attack/normal. The top-most node in a tree is the root node. The tree is a model generated by the classification algorithm. In order to classify an unknown sample, the attribute values of the sample are tested against the decision tree. A path is traced from the root to a leaf node that holds the class prediction for that sample. The C4.5 algorithm builds a decision tree, from the root node, by choosing one remaining attribute with the highest information gain as the test for the current node.
Using the network records and their features a decision tree is built using the C4.5 decision tree algorithm. Each internal node of the decision tree is associated to an attribute describing a feature of the dataset (domain data), and each outgoing arc is labeled with a possible value (set of values) for that feature. Each leaf node is associated to the attribute we want to predict a value for (the classification attribute), and to a value for that attribute. In this case the attributes considered for building the decision tree are the 41 features of the network record. Learning algorithms based on decision trees generally adopt the divide-and-conquer strategy, i.e. they build the decision tree by recursively dividing the data set of examples into subsets according to some splitting criterion (splitting test). The splitting criterion is very important in the process of building the tree, because it determines if we must attach a node or a leaf as next element in the tree. Some of the well known splitting techniques are information Gain and Information Gain Ratio [13].
4.5
Experimental Methodology
For the purpose of experiments, a large database called as DARPA KDD is used that contains a large volume of network traffic connections describing TCP connections. Each connection includes 41 features plus a label of either normal or a type of attack. The content of those features are continuous, discrete, or symbolic with vary scales and ranges All attacks in DARPA Sets can be categorized into 4 classes of attacks. The classes are summarized as follows [14].
Denial of Service (dos): Attacker tries to prevent legitimate users from using a service.
Remote to Local (r2l): Attacker does not have an account on the victim machine, hence tries to gain access.
User to Root (u2r): Attacker has local access to the victim machine and tries to gain super user privileges.
Probe: Attacker tries to gain information about the target host.
5.
RESULTS
For training the system a part of the DARPA KDD dataset is considered which consists of 12190 records of the network connection out of which 6503 records are of normal non-SIGNATURE INTRUSION DETECTION
Ne
two
rk
Traffic
Basic features
Content Features
Traffic Features
Co
n
stru
cti
o
n
o
f
d
ec
isio
n
malicious category, 0 connections of land, 4041 connections of neptune,81 connections of warezclient,321 connections of ipsweep,87 connections of teardrop,273 connections of portsweep,30 connections of pod,12 connections of guess_passwd,145 connections of nmap,333 connections of satan,258 connections of smurf,5 connections of multihop,83 connections of back,2 connections of ftp_write,4 connections of buffer_overflow,2 connections of imap,2 connections of phf,3 connections of rootkit,5 connections of warezmaster.
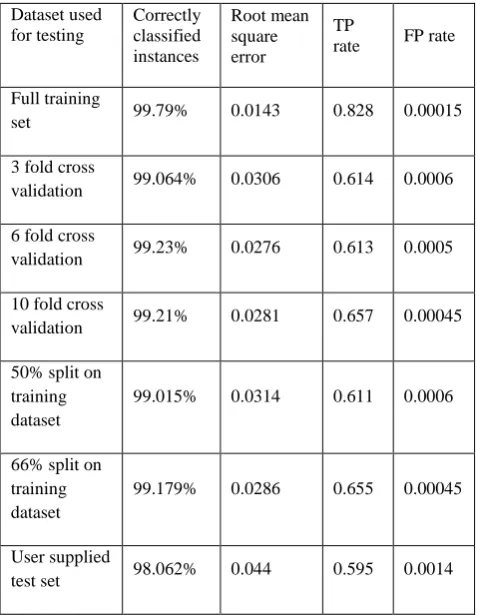
[image:4.595.313.560.119.306.2]For the purpose of testing a part of KDD test dataset is considered that consists of 5073 records. Out of the entire record set 2569 records are of the class normal,5 records of the class land,1716 of the class neptune,33 of the class warezclient,151 records of the class ipsweep,32 records of the type teardrop,136 connections of the portsweep,17 of the type pod,19 of the class guess_passwd,56 records of the class nmap,166 records of the class satan,94 of the class smurf,10 records of multihop,33 connections of back,4 connections of ftp_write,4 records of the class buffer_overflow,1 connection of imap,2 connections of phf,10 connections of rootkit and 15 records of warezmaster. Once the system has been trained, it can be tested for it’s performance on different sets. The different sets include whole training set itself, a cross validation of different folds on the training set, splitting the training dataset and providing a completely different test dataset. The performance metrics used for comparison of accuracy is the error obtained, the true positive rate (TP) and the false positive rate. Based on the above records the results are obtained separately for the system as shown in the Table 1.
Table 1: Testing the system on different datasets
Fig 2 shows a sample decision tree being constructed after the system is trained. The number of network connections used to build the tree is 399 records. We can see that the rules have
been generated based on the values of each of the features the network connection holds and the leaves represent the class of the network connections.
Fig 2: Visualization of the decision tree
6.
CONCLUSION AND FUTURE WORK
The accuracy of any intrusion detection system is determined by the TP rate and the FP rate i.e the TP rate must be as high as possible and false positive must be as low as possible. The signature based intrusion detection systems are more efficient when a known attack occurs. However it has one major drawback of not being able to detect unknown attacks. Hence this drawback can be removed by creating a hybrid system where both signature and anomaly based intrusion detection systems can be combined together in order to detect known as well as unknown attacks.
The future enhancements of the above system could be to extract the patterns of attacks and use them as real time IDS. The system can be combined with detectors and sensors to monitor the incoming network traffic and detect any packet that matches the stored records.
7.
REFERENCES
[1] Lee,Salvatore J. Stolfo,” A framework for constructing features and models for intrusion detection systems,” ACM Transactions on Information and System Security, Vol. 3, No. 4, November 2000, Pages 227–261.
[2] Neri, F., ”Comparing local search with respect to genetic evolution to detect intrusion in computer networks”, In Proc. of the 2000 Congress on Evolutionary Computation CEC00, La Jolla, CA, pp. 238243. IEEE Press, pp 16-19 July, 2000.
[3] Neri, F., ”Mining TCP/IP traffic for network intrusion detection”, In R. L. de M’antaras and E. Plaza (Eds.), Proc. of Machine Learning: ECML 2000, 11th European Conference on Machine Learning, Volume 1810 of Lecture Notes in Computer Science, Barcelona, Spain, pp. 313-322,May 31- June 2, 2000.
[4] Dasgupta, D. and F. A. Gonzalez, ”An intelligent decision support system for intrusion detection and response”,In Proc. of International Workshop on Mathematical Methods, Models and Architectures for Dataset used
for testing
Correctly classified instances
Root mean square error
TP
rate FP rate
Full training
set 99.79% 0.0143 0.828 0.00015
3 fold cross
validation 99.064% 0.0306 0.614 0.0006
6 fold cross
validation 99.23% 0.0276 0.613 0.0005
10 fold cross
validation 99.21% 0.0281 0.657 0.00045
50% split on training dataset
99.015% 0.0314 0.611 0.0006
66% split on training dataset
99.179% 0.0286 0.655 0.00045
User supplied
[image:4.595.54.293.412.720.2]Computer Networks Security (MMM-ACNS), St.Petersburg. Springer-Verlag, 21-23 May, 2001.
[5] Debar, H., Becker, M., and Siboni, D., ”A neural network component for an intrusion detection system”, IEEE Computer Society Symposium on Research in Security and Privacy, Los Alamitos, CA, pp. 240–250, Oakland, CA, May 1992.
[6] Hsaio-Hung,”A hybrid Network intrusion detection model using Random Forests and K Nearest Neighbour”, University of Information Management, June 2008
[7] G. J. Klir, “Fuzzy arithmetic with requisite constraints”, Fuzzy Sets and Systems, 1997.
[8] Dickerson, J. E. and J. A. Dickerson, ”Fuzzy network profiling for intrusion detection”, In Proc. of NAFIPS 19th International Conference of the North American Fuzzy Information Processing Society, Atlanta, pp. 301-306. North American Fuzzy Information Processing Society (NAFIPS),July 2000.
[9] G. Florez, SM. Bridges, Vaughn RB, ”An improved algorithm for fuzzy data mining for intrusion detection”, Annual Meeting of The North American Fuzzy Information Processing Society Proceedings, 2002.
[10]http://www.wikipedia.com
[11]Wenke Lee , Salvatore J. Stolfo , Philip K. Chan , Eleazar Eskin , Wei Fan , Matthew Miller , Shlomo Hershkop , Junxin Zhang,” Real time data mining-based intrusion detection ,2001
[12]Mahbod Tavallaee, Ebrahim Bagheri, Wei Lu, and Ali A. Ghorbani,” A Detailed Analysis of the KDD CUP 99 Data Set”, Proceedings on the 2009 IEEE Symposium on Computation Intelligence in Security and Defense Application, July 2009, pp 1-6
[13]L Prema Rajeswari, Kannan Arputharaj, ”An active rule approach for network intrusion detection with enhanced C4.5 algorithm”, Network and System Sciences, 2008, pp 285-385