Enhanced Image Compression Algorithm for
Image Processing Applications
B. Kranthi
M.Tech. (DECS), Gudlavalleru Engineering College,Gudlavalleru, Krishna Dt., AP, India
Dr. M. Kamaraju
Professor & Head, ECE, Gudlavalleru Engineering College, Gudlavalleru, Krishna Dt., AP, India
Dr. B. Ananda Krishna
Professor, ECE, Gudlavalleru Engineering College, Gudlavalleru, Krishna Dt., AP, India
B. Rajasekhar
Associate Professor, ECE, Gudlavalleru Engineering College, Gudlavalleru, Krishna Dt., AP, India
Abstract-Due to the increasing traffic caused by multimedia information and digitized form of representation of images; image compression has become a necessity. New algorithms for image compression based on wavelets have been developed which offers considerable improvement in picture quality at high compression ratios. To achieve lowest errors per compression rate and highest perceptual quality, the existing image compression algorithms are need to be modified. In this paper, with the objective of achieving high image compression ratio with minimum number of errors, the features of existing image compression algorithms like Haar Wavelet Transform are increased and named as Modified Fast Haar Wavelet Transform (MFHWT). The Set Partitioning In Hierarchical Trees (SPIHT) along with Run Length Encoding (RLE) increases the compression ratio without degrading the image quality. Also, the modified algorithm reduces the number of computations in Haar transform, which decreases the processing time. The proposed work was simulated using MALAB and the results shows that the compression ratio increases without affecting the Peak Signal to Noise Ratio (PSNR) standards.
Keywords- Image Compression, DWT, MFHWT, ESPIHT, RLE
1. INTRODUCTION
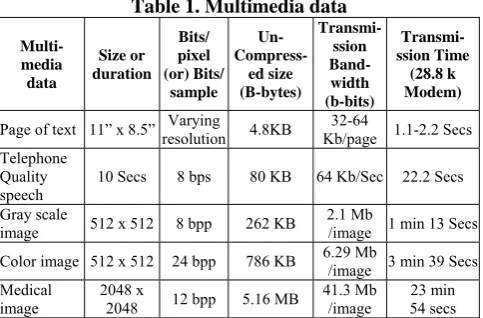
The uncompressed multimedia like graphics, audio and video data requires large storage capacity and transmission bandwidth despite rapid progress in mass storage density, processor speed, digital communication system performance and data transmission bandwidth continues to exceed the capabilities of available technologies. The recent growth of data demanding multimedia-based web applications have not only the need for more competent ways to encode signals and images but have made compression of such signals central to storage and communication technology. The Table 1 shows multimedia data types and uncompressed storage space, transmission bandwidth and transmission time required. The Table 1 clearly illustrates the need for sufficient storage space, large transmission bandwidth and long transmission time for image, audio and video data. At the present technology, the only solution is to compress multimedia data before its storage and transmission, and decompress it at the receiver for playback [1].
Table 1. Multimedia data
Multi-media data
Size or duration
Bits/ pixel (or) Bits/
sample Un-
Compress-ed size (B-bytes)
Transmi-ssion Band-width (b-bits)
Transmi-ssion Time
(28.8 k Modem)
Page of text 11” x 8.5”resolutionVarying 4.8KB Kb/page 32-64 1.1-2.2 Secs
Telephone Quality
speech 10 Secs 8 bps 80 KB 64 Kb/Sec 22.2 Secs Gray scale
image 512 x 512 8 bpp 262 KB
2.1 Mb
/image 1 min 13 Secs Color image 512 x 512 24 bpp 786 KB 6.29 Mb /image 3 min 39 Secs
Medical
image 2048 x 2048 12 bpp 5.16 MB 41.3 Mb /image 54 secs 23 min
1.1 Image Compression
the quantization stage which intentionally discards less related parts of the image information [1]. Over the past few years, a variety of novel and sophisticated wavelet-based image coding schemes have been developed. They are
• Embedded Zero tree Wavelet (EZW),
• Set-Partitioning in Hierarchical Trees (SPIHT), • Set Partitioned Embedded block coder (SPECK), • Wavelet Difference Reduction (WDR),
• Adaptively Scanned Wavelet Difference Reduction (ASWDR),
• Space –Frequency Quantization (SFQ),
• Compression with Reversible Embedded Wavelet (CREW),
• Embedded Predictive Wavelet Image Coder (EPWIC), • Embedded Block Coding with Optimized Truncation
(EBCOT), • Stack- Run (SR).
SPIHT introduced in [13] is an enhancement of EZW algorithm. By adopting set partitioning algorithm and exploring self-similarity across different scales in an image wavelet transform, SPIHT algorithm reaches high compression performance. With SPIHT, the image is first decomposed into a series of wavelet coefficients. Those coefficients are then grouped into sets known as spatial orientation trees. After that, the coefficients in each spatial orientation tree are encoded progressively from the most significant bit planes to the least significant bit planes, starting with the coefficients with the highest magnitude [14].
As with EZW, the SPIHT algorithm involves two coding passes: the sorting pass and the refinement pass. The sorting pass looks for zerotrees and sorts significant and insignificant coefficients with respect to a given threshold. And the refinement pass sends the precision bits of the significant coefficients. After one sorting pass and one refinement pass, which can be considered as one scan pass, the threshold is halved, and the coding process is repeated until the expected bit rate is achieved. SPIHT achieves very compact output bit stream and low bit rate than that of its predecessor’s EZW without adding an entropy encoder, which allows its efficiency in terms of computational complexity. Moreover, it uses a subset partitioning scheme in the sorting pass to reduce the number of magnitude comparisons, which also decrease the computational complexity of the algorithm. Finally, the progressive mode of SPIHT allows the interruption of coding/decoding process at any stage of the compression [2]. Despite these advantages, SPIHT presents the limitations like large memory and delay shortcomings. To minimize these limitations, a novel technique is proposed by enhancing the SPIHT algorithm with the combination of Run Length coding for image compression.
The rest of this paper is organized as follow. The next section, Section2, gives an outline of the related works on image compression. The Section 3 gives the objective of the proposed algorithm. The ESPIHT algorithm is
explained in Section 4. Section5 shows results on the performance metrics and provides comparisons with the SPIHT coder. Finally Section 6 concludes the paper.
2. LITERATURE SURVEY
The authors Albertus Joko Santoso et al. considered the test images of size 512x512 and analyzed with different wavelets like Daubechies, Coiflet and Symlet with the objective of achieving high PSNR and compression ratio. The result analysis proved that Haar wavelet attains highest Compression Ratio and PSNR than Coiflet and Symlet wavelets [3].
The authors S.Narasimhulu et al. proposed lossy image compression algorithm which is simple and effective for gray-scale image compression with the combination of Huffman coding and proposed to extend the work for the color image and video compression [4].
Anuj Bhardwaj et al. compared different image compression techniques like Haar Transform (HT), Fast Haar Transform (FHT), and Modified Fast Haar Wavelet Transform (MFHWT) on the basis of the Compression Ratio and PSNR. The results illustrates that the MFHWT has characteristics like sparse representation and fast transformation and easy to implement. The comparison results showed that the quality of reconstructed image is high in MFHWT [5].
Kiran Arora et al. compared the image compression algorithms HT, FWT, MFHWT on the basis of processing time. The results showed that the time taken by MFHWT is least as compared to HT and FHT while compression [6]. The authors Navjot Kaur et al. proposed a new method of image compression using SPIHT and MFHWT and they do not implement [7]. The authors Ms.MansiKambli et al. proposed a modified SPIHT algorithm and implemented on gray scale fingerprint images to analyze the PSNR vales [8].
3. PROBLEM STATEMENT
The objective of this work is to minimize the memory requirement by achieving high compression ratio without degrading the quality of image by using both lossy and lossless compression techniques. Also, the compression techniques reduce the delay and consume less power by transmitting the compressed data. The compressed information resembles a scramble message and an attacker in middle cannot able to understand. Therefore, the data compression not only reduces the size of the original data, but also gives data security.
4. OVER VIEW OF PROPOSED METHOD
Fig 1: Block diagram for proposed system
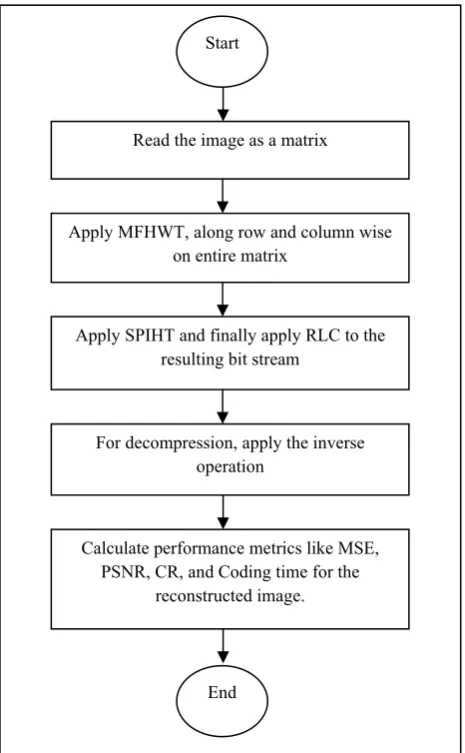
This section provides overview of the proposed algorithm and in this algorithm MFHWT is combined with SPIHT to enhance the compression ratio without losing information. The Figure 2 is the flow chart of the proposed work.
Fig 2: Flow chart of proposed algorithm
4.1 Modified Fast Haar Wavelet Transform
(MFHWT)
Modified Fast Haar Wavelet Transform (MFHWT), is one of the algorithms which can lessen the computation work in Haar Transform (HT) and Fast Haar Transform (FHT). Modified Fast Haar Transform not only allows certain calculation in the process decomposition be overlooked without affecting the results, but also still remains in simple type of calculation as for FHT. The MFHWT works based on the idea that approximate coefficients can be ignored since it is not involve in the reconstruction work as well as threshold process in multi-resolution wavelet analysis. As FHT, we use 2N data. For Modified Fast Haar Transform,
MFHWT, it can be done by just taking (w+ x + y + z)/ 4 instead of (x + y)/ 2 for approximation and (w+ x −y −z)/ 4 instead of (x −y)/ 2 for differencing process. 4 nodes have been considered at once time. Notice that the calculation for (w+ x −y −z)/ 4 will give up the detail coefficients in the level of n – 2. In MFHWT, for data of size 2N, the approximations are calculated as
, where i = 0, 1,……, (2 ) and detail sub signal at the same level is given as
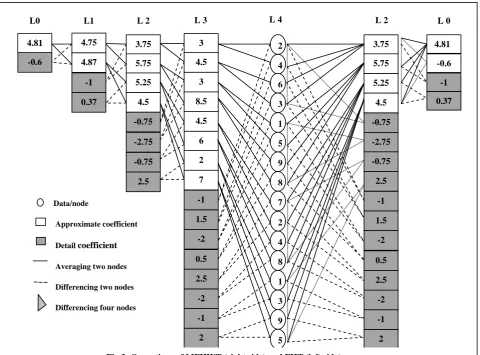
, where i = 0, 1,……, (2 ) For the purpose of getting detail coefficients, still the differencing process between two nodes (x − y)/ 2 need to be done. The Figure 2 shows the calculation of the Modified Fast Haar Wavelet Transform, MFHWT, for n = 4, given by the data F = [2 4 6 3 1 5 9 8 7 2 4 8 1 3 9 5] T. In MFHWT the decomposition can be done by using matrix formulation and get the values of approximation and detail coefficients one level (L) in advance than the FHT and HT (Figure 3).
At each level in MFHWT, we need to store only half of the original data used in FHT shown in the Figure 3, due to which it increases its efficiency. It is used to reduce the memory requirements and the amount of inefficient movement of Haar coefficients. The Table 2 shows the comparison between FHT and Modified Fast Haar wavelet transform in terms of the computation parameters for N=8.
Table 2. Comparison between FHT and MFHWT
Proce-dure
No of Addition/ Subtraction
Operations
No of Multiplication/
Division Operations
No of Move-ments
No of
Approx-imation coefficients
FHT 510 510 510 255
MFHWT 850 340 340 85
An important enlargement for the proposed MFHWT is the number of approximate coefficients can be reduced as well as number of division operations. This fulfils the target of trying to reduce the memory requirements of the transform and the amount of incompetent movement of Haar coefficients. The negative aspect in escalating the number of addition and subtraction operation is balanced by the diminishing in number of division operation as shown in the Table 2.
Original
image (MFHWT + SPIHT + RLC)ESPIHT
Storage or Transmission Compressed image
Inverse ESPIHT Reconstructed image
Compressed image
End
Read the image as a matrix
Apply MFHWT, along row and column wise on entire matrix
For decompression, apply the inverse operation
Apply SPIHT and finally apply RLC to the resulting bit stream
Calculate performance metrics like MSE, PSNR, CR, and Coding time for the
4.2 SPIHT Algorithm
SPIHT algorithm is based on Embedded Zero tree Wavelet (EZW) coding method and it uses set partitioning sorting algorithm. Coefficients corresponding to the same spatial location in different sub bands in the pyramid structure exhibit self-similarity characteristics. SPIHT defines parent children relationships between these self- similar sub bands to establish spatial orientation trees [10].
The terms and notations are used in SPIHT algorithm is shown here, as
• C (i, j): wavelet transformed coefficient at coordinate (i, j).
• O (i, j): set of coordinates of all offspring of node (i, j); children only.
• D (i, j): set of coordinates of all descendants of node (i, j) children, grandchildren, great-grand, etc.
• L (i, j): set of coordinates of all leaves of node (i, j). L (i, j) = D(i, j) - O(i, j) grandchildren, great-grand, etc.. • H(I, j): set of coordinates of all nodes in the coarsest
level of wavelet coefficient pyramid; ); parents
• Sn(i, j): significance test of a set of coordinates {(i, j)} at
bit plane level n
Sn (i, j) = 1 0 ( , ) | ( , )|
• Type A sets: for sets of type A the significance tests
are to be applied to all descendants.
• Type B sets: for sets of type B the significance tests are to be applied only to the leaves.
The flow chart of SPIHT Algorithm is shown in the Figure 4.
Fig 4: Flow chart of ESPIHT Algorithm
L0 L1 L 2 L 3 L 4 L 2 L 0
6
4 6
9 3
8 1 2
5
5 9 3 1 8 4 2 7
2 -1 -0.75 -2.75 -0.75 2.5
-1 1.5 -2
-2 0.5 2.5 3.75 5.75 5.25 4.5
4.81
-1 -0.6
0.37
2 -1 1.5
-2
-2 0.5 2.5 4.5
2 7 -1 3 4.5
3 8.5 3.75
-2.75 -0.75 2.5 5.75 5.25 4.5 -0.75 4.87
-1 0.37 4.75 4.81
-0.6
Data/node
Approximate coefficient Detail coefficient
Averaging two nodes Differencing two nodes Differencing four nodes
Initialization
Sorting
Refinement
Is Quantization level =1? Next
Quantization
No
4.2.1 SPIHT Algorithm steps:
1) Initialization: At the initialization stage first define the number of decomposition levels indicated by n using the following Eq.(1).
n = log max( , ) |C(i, j)| (1)
Then set the threshold value indicated by T = 2n ; after then set the List of Significant Pixels (LSP) as an empty list, and position the coordinates in the coarsest level of wavelet coefficient pyramid to the List of Insignificant Pixels (LIP), and those which have descendants moved to the List of Insignificant Sets (LIS) as type A entries.
2) Sorting Pass: In sorting pass there are two steps as follows
(i) Assessment of List of Insignificant Pixels
In the sorting pass, the first step is to examine List of Insignificant Pixels. In this step the LIP is scanned to
find out whether an entry coefficient is significant at the current threshold or not. If an entry is found to be significant, then output a bit 1 and another bit is used to represent the sign of the coefficient, which is marked by either 1 for positive or 0 for negative. Now the significant coefficient is moved to the LSP. If an entry is found to be insignificant, then the output is 0 bit followed by another bit for the sign of the coefficient.
(ii) Assessment of List of Insignificant Sets
The second step of sorting pass is to examine the entries in LIS. First check the entry is type A or type B. When an entry is the set of all descendants of a coefficient, named type A, then apply the magnitude tests for all descendants of the current entry is passed out to decide whether they are significant or not. If the entry is found to be as significant, the direct offsprings of the entry undergoes magnitude tests. If direct offspring is significant, it is moved into LSP; otherwise it is moved into LIP similar to the previous step. If the entry is found to be insignificant, a bit 0 is output and no further processing is needed. Finally, this insignificant entry is moved to the end of LIS as type B, which is the set of all descendants except for the immediate offspring (children) of a coefficient. If the entry in LIS is type B, significance test is performed on the descendants of its direct offsprings. If significance test is true, the spatial orientation tree with root of type B entry is split into four sub-trees that are rooted by the direct offspring and these direct off springs are added in the end of LIS as type A entries and remove this entry as type B in the LIS. The imperative thing in LIS sorting is that entire sets of insignificant coefficients are represented with a single zero [10].
3) Refinement pass: it is used to output the refinement bits (nthbit) of the coefficients in LSP at current threshold. Before the algorithm proceeds to the next round, the current threshold is halved that is T/2. 4) Quantization-Step Update: decrement n by 1 and go to
step 2. This process is going on until the last quantization level will be equal to 1.
4.3 Run Length Coding (RLC)
Run-length coding is probably the simplest method of compression. The general idea behind this method is to replace consecutive repeating occurrences of a symbol by one occurrence of the symbol followed by the number of occurrences. Individual channel matrices were retrieved and used for processing. Firstly each matrix was scanned row wise for identifying repetitive pixels. Each group of such repetitions was then replaced by the pixel value and the frequency of occurrence. This was done exhaustively throughout the image matrix. For single occurrence of a particular value frequency was not used because that would cause an overhead affecting the compression efficiency. Sample processing example:
Input stream: 22 22 22 57 57 57 57 33 33 33 33 33 22 Output stream: 322 457 533 22
The output stream produced a series of frequency-pixel value pairs and this new representation of original matrix information for individual matrices was forwarded to the next section for processing [12].
5. IMPLEMENTATION AND RESULT ANALYSIS
The proposed algorithm is simulated using MATLAB on different color images of 512 X 512 sizes with the following metrics to evaluate the image quality.
5.1 Mean Square Error (MSE):
It refers to some sort of average or sum (or integral) of squares of the error between two images as shown in the Eq. (2).
MSE = ∑ ∑ [ ( , ) − ′( , )] (2) Where I (x, y) is the original image data and I' (x, y) is the compressed image data.
5.2 Peak Signal to Noise Ratio (PSNR):
It is defined as the ratio between signal variance and reconstruction error variance. Peak Signal to Noise Ratio and Compression Ratios are calculated from the following Eq.(3).
PSNR = 10log10 (3)
Where MAXI is the maximum size of the image
5.3 Compression Ratio (CR):
Compression ratio is defined as the ratio between the original image size (n1) and compressed image size (n2) as
in Eq.(4).
CR = / (4)
5.4 Coding Time:
It is the total time taken for the image compression and decompression.
Original Image
(a)
Reconstructed Image with SPHIT
(b)
Reconstructed Image with ESPHIT (c)
Fig 5: Results of image compression (a) Original image (b) SPIHT and (c) ESPIHT
algorithms
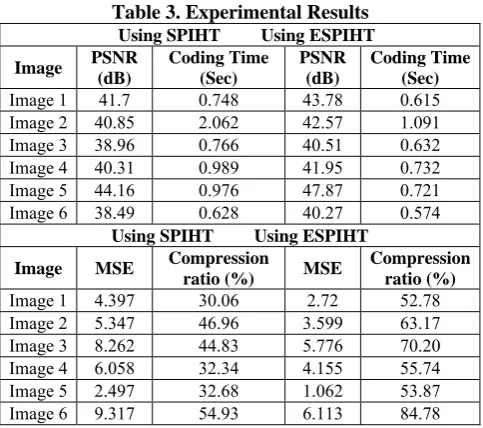
The analysis shows that the proposed algorithm reduces the computational complexity and in turn reduces the execution time with high PSNR. The Table 3 shows the comparison between two image compression techniques with different performance metrics.
Table 3. Experimental Results Using SPIHT Using ESPIHT Image PSNR
(dB)
Coding Time (Sec)
PSNR (dB)
Coding Time (Sec)
Image 1 41.7 0.748 43.78 0.615
Image 2 40.85 2.062 42.57 1.091
Image 3 38.96 0.766 40.51 0.632
Image 4 40.31 0.989 41.95 0.732
Image 5 44.16 0.976 47.87 0.721
Image 6 38.49 0.628 40.27 0.574
Using SPIHT Using ESPIHT Image MSE Compression
ratio (%) MSE
Compression ratio (%)
Image 1 4.397 30.06 2.72 52.78
Image 2 5.347 46.96 3.599 63.17
Image 3 8.262 44.83 5.776 70.20
Image 4 6.058 32.34 4.155 55.74
Image 5 2.497 32.68 1.062 53.87
Image 6 9.317 54.93 6.113 84.78
Figure 6 shows, the Mean Square Error (MSE) calculated for different images using SPIHT and ESPIHT algorithms. The number of images which are compressed using SPIHT and ESPIHT are plotted on the x-axis, where as MSE is plotted on the y-axis. It is observed that ESPIHT has lowest Mean Square Error as compared to SPIHT coding for all six test images considered and proved that it can maintain good quality of image.
Fig 6: Analysis of MSE
Fig 7: Analysis of PSNR
Figure 7 shows, the PSNR calculated for different images using SPIHT and ESPIHT algorithms. The number of images which are compressed using SPIHT and ESPIHT are plotted on the x-axis, where as PSNR is plotted on the y-axis. It is observed that ESPIHT has highest PSNR as compared to SPIHT coding for all six test images considered and proved that the quality of reconstructed image in case of ESPIHT coding is highest.
Fig 8: Analysis of Compression Ratio
image
1 image 2 image 3 image 4 image 5 image 6 SPIHT 4.397 5.437 8.262 6.058 2.497 9.317 ESPIHT 2.72 3.599 5.776 4.155 1.062 6.113
0 1 2 3 4 5 6 7 8 9 10
MS
E
MSE
image 1
image 2
image 3
image 4
image 5
image 6 SPIHT 41.7 40.85 38.96 40.31 44.16 38.49 ESPIHT 43.78 42.57 40.51 41.95 47.87 40.27
0 10 20 30 40 50 60
PSNR (dB)
PSNR
image 1
image 2
image 3
image 4
image 5
image 6 SPIHT 30.06 46.96 44.83 32.34 32.68 54.93 ESPIHT 43.78 42.57 40.51 41.95 47.87 40.27
0 10 20 30 40 50 60
CR (%
)
Figure 8 shows, the Compression ratio calculated for different images using SPIHT and ESPIHT algorithms. The number of images which are compressed using SPIHT and ESPIHT are plotted on the x-axis, where as Compression ratio is plotted on the y-axis. It is observed that ESPIHT has highest Compression ratio as compared to SPIHT coding for all six test images considered and proved that the ESPIHT is better technique for compression.
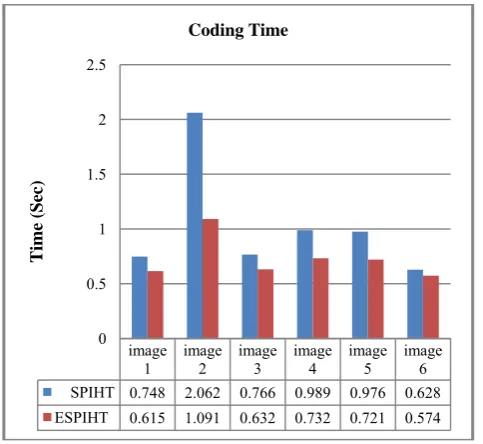
From Figure 9 it is observed that ESPIHT has lowest values for Coding Time as compared to SPIHT coding in all six types of test images taken.
Fig 9: Analysis of processing time
6. CONCLUSION
In this work, ESPIHT algorithm which is efficient for compression is implemented and simulated successfully using MATLAB. The simulation results have shown that ESPIHT gives better compression ratio as compare to SPIHT without degrading the image quality and takes less time for compression using MFHWT. In future SPIHT can also be implemented for lossless image compression for higher image quality i.e. high PSNR without much decrease in compression ratio.
REFERENCES
[1] R.Sudhakar, R Karthiga, S.Jayaraman , “Image Compression using Coding of Wavelet Coefficients – A Survey”, ICGST-GVIP Journal, Volume (5), Issue (6), June 2005.
[2] Vidhi Dubey, N.K.Mittal, and S.G.kerhalkar, “A Review on Wavelet-Based Image Compression Techniques”, International Journal of Scientific Engineering and Technology (ISSN: 2277-1581), Volume No. 2, Issue No. 8, pp : 783-7881 Aug. 2013. [3] Albertus Joko Santoso, Dr.Lukito Edi Nugroho, Dr.Gede Bayu
Suparta and Dr.Risanuri Hidayat, “Compression Ratio and Peak Signal to Noise Ratio in Gray scale Image Compression using Wavelet”, ISSN : 2229-4333(Print) | ISSN : 0976-8491(Online) www.ijcst.com IJCSt Vol. 2, ISSue 2, June 2011.
[4] S.Narasimhulu and Dr.T.Ramashri, “Gray-Scale Image Compression Using DWT-SPIHT Algorithm”, International Journal of Engineering Research and Applications (IJERA) ISSN: 2248-9622 www.ijera.com Vol. 2, Issue 4, July-August 2012.
[5] Anuj Bhardwaj and Rashid Ali, “Image Compression Using Modified Fast Haar Wavelet Transform”, World Applied Sciences Journal 7 (5): 647-653, 2009 ISSN 1818-4952 © IDOSI Publications, 2009.
[6] Kiran Arora and Amanpreet Singh Brar, “Compression of 2-D images using In Place Modified Fast Haar Wavelet Transform”, International Journal for Science and Emerging Technology with Latest Trends.
[7] Navjot Kaur and Preeti Singh, “A New Method of Image Compression Using Improved SPIHT and MFHWT”, International Journal of Latest Research in Science and Technology,ISSN:(Online):2278-5299,Vol.1, Issue2: Page No124-126, July- August(2012).
[8] Ms.MansiKambli and Ms.Shalini Bhatia, “Comparison of different Fingerprint Compression Techniques”, Signal & Image Processing An International Journal (SIPIJ) Vol.1, No.1, September 2010. [9] Manik Groach and Amit Garg, “Performance Analysis of DCSPIHT
and SPIHT Algorithm for Image Compression”, International Journal of Advanced Research in Computer Science and Software Engineering Research Paper Volume 2, Issue 3, March 2012 ISSN: 2277 128X.
[10] Ritu Chourasiya and Prof. Ajit Shrivastava,“A study of image compression based transmission algorithm using spiht for low bit rate application”, Advanced Computing: An International Journal (ACIJ), Vol.3, No.6, November 2012.
[11] Dr.B.Eswara Reddy and K Venkata Narayana, “A Lossless Image Compression Using Traditional And Lifting Based Wavelets”, Signal & Image Processing: An International Journal (SIPIJ) Vol.3, No.2, and April 2012.
[12] Nagarajan and Dr.K.Alagarsamy,“An Enhanced Approach in Run Length Encoding Scheme”, International Journal of Engineering Trends and Technology- July to Aug Issue 2011.
[13] A.Said and W. A. Pearlman, “A new, fast, and efficient image codec based on set partitioning in hierarchical trees”, IEEE Transactions on Circuits and Systems for Video Technology, vol. 6, no. 3, pp. 243– 250, 1996.
[14] Abdelhamid Mammeri, Brahim Hadjou, and Ahmed Khoumsi, “A Survey of Image Compression Algorithms for Visual Sensor Networks”, International Scholarly Research Network ISRN Sensor Networks Volume 2012, Article ID 760320, 19 pages
image 1
image 2
image 3
image 4
image 5
image 6 SPIHT 0.748 2.062 0.766 0.989 0.976 0.628 ESPIHT 0.615 1.091 0.632 0.732 0.721 0.574
0 0.5 1 1.5 2 2.5
Time (Sec)