Simulation & Validation of Performance & Emission
Parameters of Jatropha Blends in Diesel with Exhaust Gas
Recirculation
Kapil naharP
1
P
, Alwar Singh YadavP
2
P
, Gaurav TiwariP
3
P
1
P
Mechanical Engineering Department, Mewar University, Gangrar, Chittorgarh, Rajasthan, India-312901
P
2
P
Mechanical Engineering Department, Mewar University, Gangrar, Chittorgarh, Rajasthan, India-312901
P
3
P
Mechanical Engineering Department, Mewar University, Gangrar, Chittorgarh, Rajasthan, India-312901
Abstract: In the present study, a simulation code is written for diesel engine with various combinations of jatropha blends and with exhaust gas recirculation (EGR), based on steady-state phenomenological model. The emission model was developed by using chemical equilibrium reactions and calculation of thermodynamics properties based on their mixture composition. The model has been developed to predict the inlet and exhaust manifold temperature, pressure, engine torque and exhaust species variation at different percentage of jatropha blends and EGR. The system has been validated with experimental data.
Keywords: Exhaust gas recirculation, Jatropha
blends, Simulation, Equilibrium combustion
1. Notation
𝑝𝑖𝑚= Inlet Manifold Pressure
𝑝𝑒𝑚= Exhaust Manifold Pressure
𝑇𝑖𝑚 = Inlet Manifold Temperature 𝑇𝑒𝑚 = Exhaust Manifold Temperature 𝑉𝑖𝑚 = Inlet manifold volume
𝑊𝑐 = Mass flow rate at compressor
𝑊𝑒𝑔𝑟= Mass flow rate of re-circulated exhaust gas
𝑊𝑒𝑖 = Mass flow rate of at engine inlet 𝑊𝑒𝑜 = Mass flow rate of at engine outlet 𝑊𝑡 = Mass flow rate at turbine
RRaR = ideal gas constant for air
𝑊𝑓 = Mass flow rate of fuel
𝜂𝑠 = compensation factor for non ideal cycles
𝑞𝑖𝑛= Specific energy content of the charge per unit mass
𝑥𝑟 = Residual gas fraction
𝑥𝑐𝑣= Ratio of fuel consumed during constant volume combustion
𝜂𝑣𝑜𝑙 = Volumetric efficiency
N= Number of cylinders VRDR = Displacement volume
2. Introduction
The mathematical modelling is one of the important tools to simulate a diesel Engine using Jatropha bio-fuel to predict: (i) engine performance; (ii) engine emissions (oxides of nitrogen and carbon) at various percentage of EGR. The combustion process is very complex in a diesel engine [1]. Combustion models can be classified as thermodynamic model [2] and detailed model [3]. Thermodynamics and phenomenological models give reasonable prediction of intake and exhaust pressure and temperature, so a phenomenological steady state model has been used and numerical model is validated against experimental data.
3. Mathematical Modelling
To develop a simple model, that captures the dominating effects in the mass flows, the following assumptions were made:
• The manifolds are modelled as standard isothermal models.
• All gases are considered to be ideal and there are two sets of thermodynamic properties:
a) Air has the gas constant RRaR and
b) Exhaust gas has the gas constant RRe Rand the specific heat capacity
ratio CReR.
• The EGR gas in the intake manifold affects neither the gas constant nor the specific heat capacity in the intake manifold.
• No heat transfer takes place in the intake manifold.
• No backflow can occur in the EGR valve, compressor, turbine or the cylinder. • The oxygen fuel ratio is always larger than
1.
• The mixture of air and fuel is treated as perfect gas.
• The mixture inside the cylinder is homogeneous.
• Equivalence ratio is assumed to be 0.5 for analysis with EGR.
• Effect of radiation is neglected.
• No chemical change takes place in the mixture of air and fuel before combustion. • All properties of gases inside the cylinder
is only time dependent.
• The percentage of re-circulated exhaust gases is ranging from 0 to 35.
The standard isothermal model that is based upon mass conservation and the ideal gas law, gives the differential equations for the manifold pressures as [4]:
𝑑𝑝𝑖𝑚
𝑑𝑡 = 𝑅𝑎𝑇𝑖𝑚
𝑉𝑖𝑚 (𝑊𝑐+𝑊𝑒𝑔𝑟− 𝑊𝑒𝑖) (1)
𝑑𝑝𝑒𝑚
𝑑𝑡 = 𝑅𝑒𝑇𝑒𝑚
𝑉𝑒𝑚 (𝑊𝑒𝑜− 𝑊𝑒𝑔𝑟− 𝑊𝑡) (2)
The total mass flow from the intake manifold into the cylinders is modelled using the volumetric efficiency
𝑊𝑒𝑖 =𝜂𝑣𝑜𝑙120𝑅𝑝𝑖𝑚𝑎𝑇𝜂𝑖𝑚𝑒 𝑉𝑑 (3)
The volumetric efficiency is in its turn modelled as: 𝜂𝑣𝑜𝑙 =𝐶𝑣𝑜𝑙1�𝑝𝑖𝑚+𝐶𝑣𝑜𝑙2√𝑁+𝐶𝑣𝑜𝑙3 (4)
Where 𝐶𝑣𝑜𝑙1,𝐶𝑣𝑜𝑙2𝑎𝑛𝑑𝐶𝑣𝑜𝑙3 are constants for volumetric efficiency determination.
The fuel mass flow𝑊𝑓 into the cylinders is controlled by 𝑈𝛿 which gives the injected mass of fuel in mg per cycle and cylinder:
𝑊𝑓= 10
−6 𝑈
𝛿𝑁𝜂𝑐𝑦𝑙
120 (5)
The mass flow 𝑊𝑒𝑜 out from the cylinder is given by the mass balance as
𝑊𝑒𝑜=𝑊𝑓+𝑊𝑒𝑖 (6)
The cylinder out temperature 𝑇𝑒𝑚 modelled based upon ideal gas Seliger cycle
Tem =ηs �ppemim�
1−�1� �γ �V2
V1�
γ−1
�1 +
qin
CvT1�
V2
V1�
γ−1
xcv� 1�γ−1
∗ �qin�1−xCpcv+xCcvv�+
T1�VV12� γ−1
� (7)
The temperature at inlet valve closing after intake stroke and mixing
TR1R= 𝑥
𝑟𝑇𝑒𝑚+ (1− 𝑥𝑟)𝑇𝑖𝑚 (8) Where the residual gas fraction is modelled as
𝑥𝑟= �𝑝𝑝𝑒𝑚
𝑖𝑚�
�1 𝛾� �
�1 + 𝑞𝑖𝑛
𝐶𝑣𝑇1�
𝑉2
𝑉1�
𝛾−1 𝑥𝑐𝑣�
−1 𝛾� (9)
4. Chemical Equilibrium Combustion and Mole Fraction of Species
When the blend of diesel fuel and Jatropha bio fuel is combusted in presence of air with the percentage of re-circulated exhaust gases, it will replace the amount of oxygen and nitrogen from the fresh air entering the cylinder with the carbon dioxide and water vapour. The considerable 10 species, which are considered, are H, O, N, H2, OH, CO, NO, CO2, H2O and N2 [5]. The chemical reaction of combustion of diesel and bio-fuel blend, with EGR, is as follows [6]:
D (CRaRHRbRORcRNRdR) + B (CRmRHRnRORpR) +
(1-EGR)*�𝑎𝑠
𝜙�(OR2R+3.76NR2R)
+EGR*(ZR1RCOR2R+ZR2RHR2RO+ZR3RNR2R+ZR4ROR2R+ZR5RCO+ZR6RHR
2R+ZR7RH+ZR8RO+ZR9ROH+ZR10RNO)
(ZR1RCOR2R+ZR2RHR2RO+ZR3RNR2R+ZR4ROR2R+ZR5RCO+ZR6R
HR2R+ZR7RH+ZR8RO+ZR9ROH+ZR10RNO)
Carbon balancing:
Hydrogen balancing
Bn+ Db = (1-EGR)*(2xR2R+2xR6R+2xR7R+xR9R)* NRt
Oxygen balancing
Bp+ Dc+ (1-EGR)* 2�𝑎𝑠
𝜙� = (1-EGR)*(2xR1R+xR2R+2xR4R+xR5R+xR8R+xR9R+xR10R)* NRt
Nitrogen balancing
Dd+ (1-EGR)* 2�𝑎𝑠
𝜙�*3.76= (1-EGR)*(2xR3R+xR10R)* NRt
Where 𝑥𝑖 = 𝑍𝑖 𝑍 𝑡
� ;𝑍𝑡=∑ 𝑍𝑖 ; ∑ 𝑥𝑖 = 1
Dissociation reaction
1/2HR2R H K1= 𝑥7 √𝑃
�𝑥6
1/2OR2R O K2= 𝑥8 √𝑃
√𝑥4
1/2HR2R +1/2OR2R OH K3= 𝑥9
�𝑥6 ∗𝑥41 4�
1/2NR2R +1/2OR2R NO K4= 𝑥10
�𝑥3∗𝑥4
HR2R +1/2OR2R HR2RO K5= 𝑥2
�𝑃∗𝑥4∗𝑥6
CO+1/2OR2 R COR2 RK6= 𝑥1
�𝑃∗𝑥4∗ 𝑥5
Where, Ki = exp(- ΔG 𝑅𝑇)
Ki= equilibrium constant for species i [14]. ΔG=Gibbs function at specified temperature
R= universal gas constant T= combustion temperature
5. Simulation Code
A computer code has been written to solve the equations representing the models of gas species, reaction chemistry, and thermodynamic properties of mixture in the cycle. Effective iteration methods have been used for simulation [12]. The time step used in the calculation, especially when combustion takes place, was very small.
6. Results, Validation and Conclusions
The results were presented for full cycle for four strokes DI diesel engine. The runs were made using specification of Kirloskar diesel engine ( B = 110 mm, S = 110 mm, speed = 1500 rpm) [7]. The simulation results have been validated with experimental data.
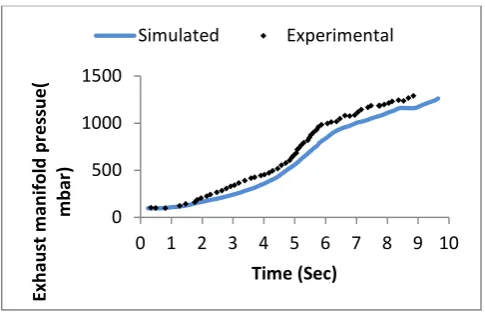
For intake manifold pressure, the deviation is about 0.48-3.58 %. The deviation in exhaust manifold pressure and engine torque is about 0.25-4.31 % and 0.95-5.86 % respectively [8].
6.1 Intake Manifold Pressure
The fig.1 shows the comparison between the simulated data and the experimental data. This variation of intake manifold pressure is for the engine running at 1500 rpm, the fuel injection rate is 114.4 mg/cycle, EGR rate 50 % [13].
Fig.1 Variation of intake manifold pressure with time
6.2 Exhaust Manifold Pressure
Fig. 2 Variation of exhaust manifold pressure with time
6.3Engine Torque
0 200 400 600 800 1000 1200
0 1 2 3 4 5 6 7 8 9 10
In
ta
ke
ma
ni
fo
ld
p
re
ss
ure
(mb
ar)
Time ( Sec )
Experimental
Simulated
0 500 1000 1500
0 1 2 3 4 5 6 7 8 9 10
Ex
ha
us
t ma
ni
fo
ld
p
re
ss
ue
(
mb
ar)
Time (Sec)
The variation of torque produced by the engine with time and the comparison of simulated data and experimental data is shown in fig. The maximum engine torque produced by the diesel engine in the present study is about 230 N-m as shown in fig 3.
Fig. 3 Variation of engine torque with time
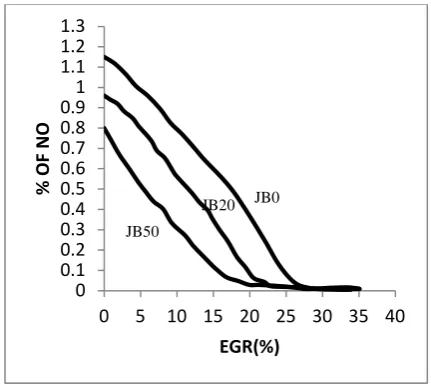
6.4 Nitrogen Oxide Formation
The reactions forming NO are very temperature dependent, as the rate of dissociation of nitrogen is directly proportional to the temperature increase.
Fig. 4 Variation of Nitrogen oxide with EGR %
JBD (Jatropha biodiesel) blends emitted NOx was slightly lower than that of DF, at 0% EGR. At 0% EGR, the NOx emission of JB20 and JB50 was lower than that of diesel fuel. The NOx emission of all fuels decreased linearly, when EGR was operated [9]. As the percentage of EGR increases,
the amount of NO decreased rapidly for different blends.
6.5 Carbon Monoxide Formation
Fig. 5 Variation of Carbon monoxide with EGR %
The CO emission increased with increasing EGR rates. The amount of CO in the engine exhaust increases slowly till 10% EGR and after that the amount of CO is increased very rapidly. The amount of CO is lower for 50% Jatropha blend than that for 0% and 20% Jatropha blends [10].
6.6 Carbon Dioxide Formation
The COR2R emission increased with increasing
biodiesel amount in the blends. The COR2 Remission
of DF increased slightly, when EGR was operated. While, the COR2R emission of JBD blends increased
rapidly; especially at over 20% EGR. Beyond 20% EGR, the COR2R emission from JBD blends was
higher than that of DF [11].
0 50 100 150 200 250
0 1 2 3 4 5 6 7 8 9 10
En
gi
ne
T
orq
ue
( N
-m)
Time ( Sec)
Simulated Experimental
0 0.1 0.2 0.3 0.4 0.5 0.6 0.7 0.8 0.91 1.1 1.2 1.3
0 5 10 15 20 25 30 35 40
%
O
F N
O
EGR(%) JB0 JB20
JB50
0 1 2 3 4 5 6 7
0 10 20 30 40
%
O
F C
O
EGR(%) JB
JB50 JB20
0.580.6 0.62 0.64 0.66 0.680.7 0.72 0.74 0.76 0.780.8 0.82 0.84 0.86
0 5 10 15 20 25 30 35 40
%
O
F C
o2
EGR (%)
JB 50
JB 20
Fig. 6 Variation of Carbon dioxide with EGR %
7. References
1. K K Kenneth. 'Principles of Combustion.' Wiley-Int Publication, 1986.
2. N Watson and A D Pilley. 'A Combustion Correlation of Diesel Engine Simulation.' SAE, 1980.
3.Z Bazari. 'A DI Diesel Engine Combustion and Emision Predictive Capability for use in Cycle Simulation.' SAE, 1992.
4. Jerhammar A. And H¨ockerdal E.,” Gas flow observer for a Scania Diesel Engine with VGT and EGR”, Linkopings university, February 10, 2006. 5. N V Deshpande, M K Madnani, A Joshi and A Gupta. 'Exhaust Gas Simulation.' IE(I) Journal-MC, 2004.
6. Roy M. M., Hoque S. M. N., Islam Md. A. and Rahman Md. M.,“ Use of Exhaust Gas Recirculation (EGR) and cyclonic separator for simultaneous NOx and PM reduction in DI diesel engine”, Journal of Petroleum and Gas Engineering, Vol. 2(3), pp. 54-63, March 2011. 7. Karthikeyan S., Hariganesh R., Sathyanadan M. and Krishnan S.,“ Computational analysis of EGR mixing inside the intake system and experimental investigation for diesel engine for LCV”, International Journal of Engineering Science and Technology, Vol. 3 No. 4 March 2011.
8. Shuai Y., Ling L. and Guo-Feng C., “EGR control and simulation about EGR rate influence on diesel engine operation performance”, Tongji University (2009).
9. Gomaa M., Alimin A. and Kamarudin K.,”The effect of EGR rates on NOX and smoke emissions of an IDI diesel engine fuelled with Jatropha biodiesel blends”, INTERNATIONAL JOURNAL OF ENERGY AND ENVIRONMENT Volume 2, Issue 3, 2011 pp.477-490.
10. Wiznia D., Geist G. and Ellis H.,”Implementation and emission analysis of biofuels in a combustion ignition light duty vehicles”, New Haven, 2006.
11. Aggarwal D. and Aggarwal A.,” Performance and emission characteristics of Jatropha oil in a
direct injection compression ignition engine”, Applied thermodynamics, Vol. 27, pp. 2314-2323, 2007.
12. Dr Sarkar J.,”DI Diesel Engine Cycle Simulation and Validation”, Vol. 89, January 2009. 13. Forson F.K., Oduro E.K. and Hammond-Donkoh E.,”Performance of jatropha oil blends in a diesel engine”, Renewable Energy 29 (2004) 1135– 1145.
14. 'Compilation Published by National Bureau of Standard, Called JANAF Table.' (1971)
Biographies
Kapil Nahar: B.E.(Hons.), M.Tech( Thermal Engg.), Worked with Larsen & Toubro Ltd. For 2 years as senior engineer, Presently working as Lecturer in Mewar University. Currently working in field of energy conservation and bio-fuels.
Alwar Singh Yadav: B.tech ,M.tech ( Thermal) From NIT, Kurkshetra, Presently working as Assistant Professor in Mewar University.