SELECTING A SMALLER SUBSET OF INFORMATIVE GENES
FROM MICROARRAY DATA VIA A THREE-STAGE METHOD
Mohd Saberi Mohamad1,2, Sigeru Omatu1, Safaai Deris2 and Michifuci YoshiokaI
I Department of Computer Science and Intelligent Systems, Graduate School of Engineering, Osaka Prefecture University,
Sakai, Osaka 599-8531, Japan 2Department of Software Engineering, Faculty of Computer Science and Information System, Universiti Teknologi Malaysia, 81310 Skudai, Johor, Malaysia
Email: [email protected].{sigeru.yoshioka}@.cs.osakafu-u.ac.jp. [email protected]
Abstract: Microarray data produced by microarray are useful for cancer classification. However, the process of gene selection for the classification faces with a major problem due to the properties of the data such as the small number of samples compared to the huge number of genes (higher-dimensional data), irrelevant genes, and noisy data. Hence, this paper proposes a three-stage gene selection method to select a smaller subset of informative genes that is most relevant for the cancer classification. It has three stages: I) pre-selecting genes using a filter method to produce a subset of genes; 2) optimising the gene subset using a multi-objective hybrid method to yield near-optimal subsets of genes; 3) analysing the frequency of appearance of each gene in the different near-optimal gene subsets to produce a smaller (final) subset of informative genes. Two microarray data sets are used to test the effectiveness of the proposed method. Experimental results show that the performance of the proposed method is superior to other experimental methods and related previous works. A list of informative genes in the final gene subset is also presented for biological usage.
Keywords: Cancer Classification, Gene Selection, Genetic Algorithm, Hybrid Method, Three-Stage Method.
1. INTRODUCTION
Microarray technology is used to measure the expression levels of thousands of genes simultaneously, and finally produce microarray data. A comparison between the gene expression levels of cancerous and normal tissues can also be done. This comparison is useful to select those genes that might anticipate the clinical behaviour of cancers. Thus, there is a
e of the followirq d to the small m
To overcome the
. works have usel
. Thus, d
.genes (mini
accuracy
(ItS is evalUlle
need to select informative genes that contribute to a cancerous state. An informative gene is
useful for cancer classification. However, the gene selection process poses a major challenge
because of the following characteristics of microarray data: the huge number of genes
compared to the small number of samples (higher-dimensional data), irrelevant genes, and
noisy data.
To overcome the challenge, a gene selection method is used to select a subset of
genes for cancer classification. The gene selection method has several advantages such as
maintaining or improving classification accuracy, reducing the dimensionality of data, and
removing irrelevant and noisy genes.
There are two types of gene selection methods [10]: if a gene selection method is
carried out independently from a classifier, it belongs to the filter approach; otherwise; it is
said to follow a hybrid (wrapper) approach. In the early era of microarray analysis, most
previous works have used the filter approach to select genes because it is computationally
more efficient than the hybrid approach [1],[4],[11]. However, the filter approach results in
inclusion of irrelevant and noisy genes in a gene subset for the cancer classification. The
hybrid approach usually provides greater accuracy than the filter approach. Until now, several
hybrid methods, especially a combination between a genetic algorithm (GA) and a support
vector machine (SYM) classifier (GASVM), have been implemented to select informative
genes [2],[3],[5-8],[10]. The drawbacks of the hybrid methods (GASYM-based methods) in
the previous works are [2],[3],[5-8],[10]: 1) intractable to efficiently produce a smaller subset
of informative genes when the total number of genes is too large (higher-dimensional data);
2) the high risk of over-fitting problems.
In order to solve the problems derived from microarray data and overcome the
limitation of the hybrid methods in the previous works [2],[3],[5-8],[10], we propose a three
stage gene selection method (3-SGS). This proposed method is able to perform well in the
higher-dimensional data and reduce the high risk of over-fitting problems since it has three
stages as follows: stage 1 for producing a subset of genes; stage 2 for resulting near-optimal
subsets of genes; stage 3 for yielding a smaller (final) subset of informative genes based on
the frequency of appearance for each gene in the near-optimal subsets. The diagnostic goal is
to develop a medical procedure based on the least number of possible genes that needed to
detect diseases. Thus, the ultimate goal of this paper is to select a smaller subset of
informative genes (minimise the number of selected genes) for yielding higher cancer
classification accuracy (maximise the classification accuracy). To achieve the goal, we adopt
3-SGS. 3-SGS is evaluated on two real microarray data sets of tumour samples.
The outline of this paper is as follows: Sections 2 and 3 discuss previous works and
the detail of the proposed three-stage method, respectively. In Section 4, microarray data sets
used, experimental setup, and experimental results are described. The conclusion of this paper is provided in Section 5.
2. PREVIOUS WORKS
Several hybrid methods, i.e., GASVM-based methods have been proposed for genes selection of microarray data [2],[3],[5-8],[10]. The hybrid methods usually provide greater accuracy than filter methods since genes are selected by considering relations among genes. Generally, our previous GASVM-based methods performed well in higher-dimensional data, e.g., microarray data since we proposed a modified chromosome representation and a multi objective approach [5-7]. However, the methods yielded inconsistent results when they were run independently.
The work of Huang and Chang can simultaneously optimise genes and SVM parameter settings by using a GASVM-based method (2). Next, integrated algorithms based on GASVM have been proposed by the works of Shah and Kusiak (10), and Lee (3) to produce a small subset of genes. Peng et al. introduced a recursive feature elimination post processing step after the step of a GASVM-based method in order to reduce the number of selected genes again (8).
Nevertheless, the GASVM-based methods of the previous works are still intractable to efficiently produce a smaller subset of informative genes from higher-dimensional data due to their binary chromosome representation drawback [2],[3],[6-8],[10]. The total number of gene subsets produced by GASVM-based methods is calculated by Me = 2M
-I where Me is the total number of gene subsets, whereas M is the total number of genes. Based on this equation, the GASVM-based methods are almost impossible to evaluate all possible subsets of selected genes if M is too many (higher-dimensional data). Although the work of Peng et al. have implemented a pre-processing step to decrease the dimensionality of data, but it can
only reduce a small number of genes, and many genes are still available in the data [8]. The GASVM-based methods also face with the high risk of over-fitting problems. The over-fitting problem that occurred on hybrid methods (e.g., GASVM-based methods) was also reported in a review paper in Saeys et al. [9].
3. THE PROPOSED THREE-STAGE GENE SELECTION METHOD (3-SGS)
In order to overcome the drawbacks of GASVM-based methods in the related previous works [2],[3],[5-8],[10], we propose a three-stage gene selection method (3 SGS). 3-SGS in our work differs from the methods in the previous works in one major
Jurnal Teknologi Maklumat Cancer classification by using an SVM classifier A near-optimal subset of genes
A smaller (final) subset of informative genes
r-~~~~~----~---Pre-processing
Save a near optimal subset
No Gene expression data
(training set)
Jilid 20, Bil. 4 (Disember 2008)
Figure I. The proposed method (3-SGS).
3.1 Stage 1: Pre-selecting Genes Using a Filter Method
A filter method such as gain ratio (GR) or information gain (IG) is used to pre-select genes
and finally produce a subset of genes. After the pre-select process, the dimensionality of data
is also decreased. The filter method calculates and ranks a score for each gene. Genes with the
highest scores are selected and put into a gene subset. This subset is then used as an input to
the second stage.
Since GASVM-based methods in previous works performs poorly in higher
dimensional data, and meanwhile, we also use a GASVM-based method, i.e., a multi
objective GASVM (MOGASVM) in the second stage of 3-SGS, a filter method (GR or IG) in
this first stage is used to reduce the higher-dimensional in order to overcome the drawback of
GASVM-based methods. If the subset that produced by the filter method is in small
dimension, the combination of genes is not complex, and then MOGASVM can possible to
produce near-optimal genes subsets.
part. The major difference is that our proposed method involves three stages, whereas
the previous works usually used only one stage (using a hybrid method) [2],[3],[5
7],[10] or two stages (using a filter method and a hybrid method) [8] for gene
selection. In the third stage, our method implements frequency analysis to identify the
most frequently selected genes in near-optimal gene subsets, whereas the previous
works [2],[3],[5-8],[10] rely solely on a filter method or a hybrid method in the first
stage of their methods. The difference is necessary in order to produce near-optimal
gene subsets from higher-dimensional data, reduce the high risk of over-fitting
problems, and finally yield a smaller subset of informative genes. 3-SGS is shown in
Fig. I. The detailed stages are described as follows:
Stage 3: Analysing the frequency of
each gene in near-optimal subsets , I
1
~ .1
r---
1 1
I 1
I I
I I
--A: th~e~~st;ie- ie-n~
- - - -C;~I~-=C;~I~-:"-1-. ' A subset of genes3.2 Stage 2: Optimising a Gene Subset Using MOGASVM
In this stage, we develop MOGASVM to automatically optimise a gene subset that is
produced by the first stage, and finally yield near-optimal subsets of genes. This stage is
cycled until the maximum number of cycles is satisfied. The near-optimal subsets are
identified by an evaluation function in MOGASVM that uses two criteria: maximisation of
leave-one-out-cross-validation (LOOCV) accuracy and minimisation of the number of
selected genes. MOGASVM selects and optimises genes by considering relations among
them in order to remove irrelevant and noisy genes. The near-optimal subsets are possible to
be found due to the dimensionality and complexity of data has been firstly reduced by the first
stage. The high risk of over-fitting problems can be also decreased because of the reduction.
The detail ofMOGASVM can be found in our previous work [7].
3.3 Stage 3: Analysing the Frequency of Each Gene in Near-optimal Subsets
The frequency of appearance for each gene in each near-optimal gene subset is examined and
analysed to assess the relative importance of genes for cancer classification. The most
frequently selected genes in near-optimal gene subsets are presumed to be the most relevant
for the classification. Finally, a smaller (final) subset of inforinative genes (K genes, K is a
number of genes) is produced and used to construct an SVM classifier. This subset contains a
smaller number of informative genes with higher classification accuracy. This paper has
produced two methods of 3-SGS obtained from combinations of two different filter methods
(GR and IG) and MOGASVM. These methods are 3-SGS-GR and 3-SGS-IG.
4. EXPERIMENTS
4.1 Data Sets and Experimental Setup
Two benchmark microarray data sets that contain binary classes and multi-classes of cancer
samples are used to evaluate 3-SGS. It is summarised in Table I. Table 2 contains parameter
values for 3-SGS. These values are chosen based on the results of preliminary runs. Three
criteria following their importance are considered to evaluate the performance of 3-SGS: test
accuracy on the test set, LOOCV accuracy on the training set, and the number of selected
genes. Higher accuracies and a smaller number of selected genes are needed to obtain an
excellent performance. The top,'200 genes are pre-selected by using GR and IG in the first
stage of the 3-SGS, and are then used for the second stage.
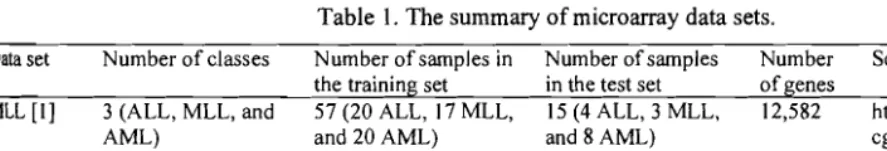
Table 1. The summary of micro array data sets.
Number of classes Number ofsampJes in Number of samples Number Source the trainin set in the test set of enes
3 (ALL, MLL, and 57 (20 ALL, 17 MLL, 15 (4 ALL, 3 MLL, 12,582 http://www.broad.mit.edu/
AML) and 20 AML) and 8 AML) cgi-bin/cancer/datasets.cgi
2 (Normal and 62 (22 normal and 40 Not available 2,000 http.z/microarray.princeto
tumour) tumour) n.edu/oncology/affydata/i
ndex.html
Note:
ALL=acute lymphoblastic leukaemia. AML = acute myeloid leukaemia. LL= mixed-lineage leukaemia.
Table 2. Parameter settings for 3-SGS.
Parameters MLL data set Colon data set
Size of population 100 100
Number of generation 300 300
Crossover rate 0.7 0.7
Mutation rate 0.01 0.01
Maximum number of cycles 10 10
Cost for an SYM classifier 100 100
4.1 Experimental Results
4.1.1 Classification accuracies of final informative genes
As shown in Fig. 2, the best results of the MLL (100% LOOCY and 100% test accuracies), and the colon data sets (96.77% LOOCY) are obtained by using the only six (using 3-S0S
OR) and 20 (using 3-SGS-GR) final selected informative genes (K genes), respectively.
I~IL'"
"j;;:
I~I
rr··
;:~:;
..
~~,~~~~~~~~~~~
9 11 13 1~ 11 19 21 13 2~ 1 3 5 7 9 11 13 15 17 19 21 z) Zi 'ZT 29 31 33 315 'S1 39 ", 43
The numbel of final selected Informative genes The number of final eerect ed Informative genes
(a) 3-SGS-GR on the MIL data set (b) 3-SGS-IG on the MIL data set
ll'~.:I~
~
...::::...
~_: r~
...
=....
The number of flnel .~dInfonnlltive gene. The number (If final selected Informative genes
(c) 3-SGS-GR on the colon data set (d) 3-SGS-IG on the colon data set
Figure 2. A relation between classification accuracies and the number of final selected informative genes (K genes) using 3-SGS.
. Table 3. The list of informative genes in the final gene subsets.
Rank
Data Set Gene ID
Score MLL 9 7 3 3 2 2 MlI722 M13143 U41843 Z83844 L08895 U59878
8 R62945
8 T51261
7 T52003
6 T62947
5 5 5 R54097 030755 R38513
4 H42477
Colon
4 4
RI5447 U29l71
4 R49459
4 H87135
4 M76378
4 102854
3 3 3 3 3 3 U07695 T47377 Z11502 M63391 H82719 H72110
Gene Description
human terminal transferase mRNA, complete cds nucleotide sequence of the eDNA insert of lambda human Dr l-associated corepressor (DRAP I) mRNA vicpro2.D07.r Homo sapiens eDNA, 5' end
homo sapiens MADS
human low-Mr GTP-binding protein (RAB32) mRNA
COMPLEMENT DECAY-ACCELERATING FACTOR I PRECURSOR (Homo sapiens) GLIA DERIVED NEXIN PRECURSOR (Mus musculus)
CCAA T/ENHANCER BINDING PROTEIN ALPHA (Rattus norvegicus)
60S RIBOSOMAL PROTEIN L24 (Arabidopsis thaliana)
TRANSLATIONAL INITIAnON FACTOR 2 BETA SUBUNIT (HUMAN);.
Human mRNA (HA1652) for ORF, partial cds. FIBROBLAST GROWTH FACTOR RECEPTOR 2 PRECURSOR (Homo sapiens)
RAS-RELATED C3 BOTULINUM TOXIN SUBSTRATE I (Homo sapiens)
CALNEXIN PRECURSOR (Homo sapiens) Human casein kinase I delta mRNA, complete cds. TRANSFERRIN RECEPTOR PROTEIN (Homo sapiens)
IMMEDIATE-EARLY PROTEIN IE 180 (Pseudorabies virus)
Human cysteine-rich protein (CRP) gene, exons 5 and 6.
MYOSIN REGULATORY LIGHT CHAIN 2, SMOOTH MUSCLE ISOFORM (HUMAN);contains element TAR I repetitive element;.
Human tyrosine kinase (HTK) mRNA, complete cds. S-IOOPPROTEIN (HUMAN).
H.sapiens mRNA for intestine-specific annexin. Human desmin gene, complete cds
BETA-ADAPTIN (Homo sapiens)
T-CELL RECEPTOR BETA CHAIN PRECURSOR (Oryctolagus cuniculus)
Many runs have achieved 100% LOOCV accuracy especially on the MLL the data
sets. This has proved that 3-SGS has efficiently selected and produced a smaller subset of
informative genes from a solution space. This is due to the fact that a filter method in the first
stage of 3-SGS reduces the dimensionality of the solution space in order to produce a gene
subset. Next, MOGASVM in the second stage of 3-SGS optimise the subset automatically to
yield near-optimal subsets of genes. These subsets are obtained since MOGASVM in 3-SGS
considers and optimise:
·fi-equently are selected I
,~.
.4.1.2 A list of informa
the proposed 3·SGS at
among the thousand c
investigations. Biologis
have higher possibility
4.1.3 3-SGS versus otl
Table 4 displays the be
hybrid approaches. Ov
MLL the data set in t<
selected genes. For tt
Mohamad et al. [6] ~
samples to finally yielc
not be done because his
Generally, filte
since they may result ir
classification. This sit!
discriminative power f
GASVM-basel
of informative genes'
chromosome represent
applications because a
nea~optimalone.On
the first stage can red
then optimised by M<
Finally, the first K
informative genes (a 5
Jilid 20, Bi\. 4 (Diseml
considers and optimises a relation among genes. Finally, the first K genes appearing most frequently are selected as the final selected informative genes for cancer classification.
4.1.2 A list of informative genes for biological usage
The informative genes and their rank scores (frequency) of the final subsets as produced by
the proposed 3-SGS and reported in Fig. 2 are listed in Table 3. These informative genes
among the thousand of genes may be the excellent candidates for clinical and medical
investigations. Biologists can save much time since they can directly refer to the genes that
have higher possibility to be useful for cancer diagnosis and drug target in the future.
4.1.3 3-SGS versus other previous methods
Table 4 displays the benchmark of this work and previous related works that used filter and
hybrid approaches. Overall, 3-SGS in this work has outperformed the previous works on
MLL the data set in terms of the test accuracy, the LOOCV accuracy, and the number of
selected genes. For the colon data set, the average cross-validation result produced by
Mohamad et ai. [6] was slightly higher than our work. Our work only unclassified two
samples to finally yield 96.77% LOOCV accuracy. However, an objective comparison could
not be done because his work only used one benchmark microarray data set.
Generally, filter methods in previous works [I ],[4],[II] achieved poor performances
since they may result in inclusion of irrelevant and noisy genes in a gene subset for the cancer
classification. This situation is happen because the methods evaluate a gene based on its
discriminative power for the target classes without considering its relations with other genes.
GASVM-based methods [2],[3],[5-8],[10] may be unable to produce a smaller subset
of informative genes because they perform poorly in higher-dimensional data due to their
chromosome representation drawback. GASVM-II [5] method is impractical to be used in real
applications because a variety number of selected genes should be tested in order to obtain the
near-optimal one. On the contrary, the proposed 3-SGS that pre-selects a number of genes at
the first stage can reduce the data dimensionality and produce a gene subset. This subset is
then optimised by MOGASVM in the second stage of 3-SGS to yield near-optimal subsets.
Finally, the first K genes appearing most frequently are selected as the final selected
informative genes (a smaller subset) for cancer classification.
Table 4. The benchmark of 3-SGS with previous methods on the MLL and colon data sets. plexity of solutj . matical1y optim
Gene Selection Method (Category) [Reference]
MLL Data Set
#Selected Accuracy (%)
Genes CV Test
Colon Data Set #Selected CV Accuracy
Genes (%)
. gene subsets. Fi
.-.elected informativ
i<',
3-SGS (Filter, hybrid, and frequency
analysis) 6 100 100 20 96.77
GASVM (Hybrid) [2]
GASVM (Filter and hybrid) [8]
(3.5) (100)
12 93.55 of the large m:
F-test and Cho's method (Filter) [II] 23 97.2 .er, due to the apl
Principal component analysis (Filter) [I] 100 95 d genes is di
Information gain (Filter) [4] 100 with higher ace
An integrated algorithm (Hybrid) [3] (99.13) , a combinati
GAS VM-II+GASVM(Hybrid) [6] (6.5) (100) (92) (11.6) (99.52)
GASVM-II (Hybrid) [5] (30) (100) (84.67) (30) (99.03)
MOGASVM (Hybrid) [7] (4,465.2) (94.74) (90) (446.3) (93.23)
GASVM (Hybrid) [5] (6,298.8) (94.74) (87.33) (979.8) (91.77)
Note: The results of the best subsets shown in shaded cells. '-' means that a result is not reported in the related previous work. A result in '( )' denotes an average result. CV and #Selected Genes represent cross-validation and a number of selected genes, respectively. Methods in italics style are experimented in this work.
The gap between LOOCV accuracy and test accuracy that resulted by 3-SGS was also
lower. This small gap shows that the risk of the over-fitting problem can be reduced. On the
other hand, the results of LOOCV accuracy of the related previous works were much higher
than their test accuracy because they were unable to avoid or reduce the risk of over-fitting
problems. Other previous works that used GASVM-based methods [2],[8] did not provide any
test accuracy results and thus, the over-fitting problem could not be investigated in their
works. Over-fitting is a major problem on hybrid methods in gene selection and classification
of microarray data when the classification accuracy on training samples, e.g., LOOCV
accuracy is much higher than the test accuracy. This is also supported by a review paper in
Saeys et al. [9] which reported that hybrid methods (e.g., GASVM-based methods) confront
with the high risk of over-fitting problems because ofthe higher-dimensional data.
5. CONCLUSIONS
In this paper, a three-stage gene selection method (3-SGS) has been proposed and tested for
gene selection on two microarray data sets that contain binary classes and multi-classes of
tumour samples. Based on the experimental results, the performance of3-SGS was superior to
other methods in related previous works. This is due to the fact that the filter method in the
first stage of the 3-SGS can pre-select genes and reduce dimensionality of data in order to
produce a subset of genes. When the dimensionality was reduced, the combination of genes
4 (Disember
and complexity of solution spaces were automatical1y decreased. The second stage of 3-SGS
can automatical1y optimise the subset that is yielded by the first stage in order produce near
optimal gene subsets. Final1y, the first K genes appearing most frequently are selected as the
final selected informative genes (a smal1er subset) for cancer classification. Hence, the gene
selection using 3-SGS is needed to produce a smal1er subset of informative genes for better
cancer classification of microarray data. 3-SGS in this paper also obtains short running time
because of the large number of genes are removed by a filter technique in the first step.
However, due to the application of a filter method in the first stage of 3-SGS, the number of
pre-selected genes is difficult since it is manual1y done. Even though 3-SGS has classified
tumours with higher accuracy, it is still not able to completely avoid the over-fitting problem.
Therefore, a combination between a statistical approach and a hybrid method will be
proposed to solve the problem.
ACKNOWLEDGEMENTS
This study was supported and approved by Universiti Teknologi Malaysia, Osaka Prefecture
University, and Malaysian Ministry of Higher Education. The authors grateful1y thank the
referees for the helpful suggestions.
REFERENCES
[I] Armstrong, S. A., Staunton, 1. E., Silverman, L. 8., Pieters, R., Boer, M. L., Minden, M.
D., Sal1an, S. E., Lander, E. S., Golub, T. R. and Korsmeyer, S. J., "MLL trans locations
specify a distinct gene expression profile that distinguishes a unique leukemia", Nature
Genetics, Volume 30, ppAI-47, 2002.
[2] Huang, H. L. and Chang, F. L., "ESVM: Evolutionary support vector machine for
automatic feature selection and classification of microarray data", BioSystems, Volume
90, pp.516-528, 2007.
[3] Lee, Z. 1. "An integrated algorithm for gene selection and classification applied to
microarray data of ovarian cancer", Artificial Intel1igence in Medicine, Volume 42,
pp.81-93,2008.
[4] Li, J., Liu, H., Ng, S. K. and Wong, L., "Discovery of significant rules for classifying
cancer diagnosis data", Bioinformatics, Volume 19, pp.93-102, 2003.
[5] Mohamad, M. S., Deris, S. and Illias, R. M., "A hybrid of genetic algorithm and support
vector machine for features selection and classification of gene expression microarray",
International Journal of Computational Intelligence and Applications, Volume 5, pp.91
107,2005.
[6] Mohamad, M. S., Omatu, S., Deris, S., Misman, M. F. and Yoshioka, M., "Selecting
PRO]
informative genes from microarray data by using hybrid methods for cancer
CONSTRl
classification", International Journal of Artificial Life & Robotics, Volume 13, Issue 2,
2008.
[7] Mohamad, M. S., Omatu, S., Deris, S., Misman, M. F. and Yoshioka, M., "A multi Facul~
objective strategy in genetic algorithm for gene selection of gene expression data",
International Journal of Artificial Life & Robotics, Volume 13, Issue 2, 2008.
[8] Peng, S., Xu, Q., Ling, X. B., Peng, X., Du, W. and Chen, L., "Molecular classification of
cancer types from microarray data using the combination of genetic algorithms and
support vector machines", FEBS Letters, Volume 555, pp.358-362, 2003.
[9] Saeys, Y'; Inza, 1. and Larranaga, P., "A review of feature selection techniques in
bioinformatics", Bioinformatics, Volume 23, Issue 19, pp.2507-25 17, 2007.
[10] Shah, S. and Kusiak, A., "Cancer gene search with data-mining and genetic
algorithms", Computers in Biology & Medicine, Volume 37, Issue 2, pp.251-26I, 2007.
(II] Yang, K., Cai, Z., Li, J. and Lin, G., "A stable gene selection in microarray data
analysis", BMC Bioinformatics, Volume 7, pp.228-246, 2006.
Jilid 20, Bi\. 4 (Disember 2008) Jurnal Teknologi Maklumat