ABSTRACT
WILSON, CORINNE EILEEN. A Comparison of Runoff Quality and Quantity from an Innovative Underground Low Impact Development and a Conventional Development. (Under the direction of Dr. William F Hunt III.)
Urbanization and its associated increased impervious footprint lead to stream impairment through erosion, flooding, and augmented pollutant loads. Low Impact Development (LID) focuses on disconnecting impervious areas, increasing infiltration and evapotranspiration, and harvesting stormwater on site through the use of stormwater control measures (SCMs). In this study, a conventional development (centralized stormwater management) and an adjoining infiltration-based LID commercial site in Raleigh, North Carolina, were compared with respect to hydrology and water quality. The conventional development (2.76 ha, 61% directly connected impervious area (DCIA)) and the LID (2.53 ha, 84% DCIA) have
underlying hydrologic soil group B soils Cecil and Appling. A dry detention basin, designed to mitigate peak flow rate, was the conventional development SCM. The LID site consisted of a 44,300-liter aboveground cistern used for indoor toilet flushing, two underground cisterns (57,900 liters and 60,600 liters), used for landscape irrigation, and an underground detention system, which overflowed into a series of infiltration galleries beneath the parking lot of the shopping center. The LID shopping center was designed to mimic predevelopment hydrology for the 10-year return period, 24-hour duration storm and meet nutrient
requirements for total nitrogen (TN).
development had an 11 times higher peak flow value, for the median storm, than the LID site when normalized by DCIA. For three storms more intense than the 10-year, 5-minute
intensity storm, the conventional site averaged a 7.7 times higher peak flow than the LID, when normalized by DCIA.
Flow proportional, composite water quality samples were analyzed for TN, total phosphorus (TP), total Kjeldahl nitrogen (TKN), total ammoniacal nitrogen (TAN), nitrite-nitrate
(NO2+NO3), orthophosphate (Ortho-P) and total suspended solids (TSS). For the 20 water quality storms sampled, the LID site pollutant loadings for all species studied were less than 5% of pollutant loadings at the conventional site. Results from this innovative combined detention, stormwater harvesting, and infiltration commercial LID demonstrate highly
A Comparison of Runoff Quality and Quantity from an Innovative Underground Low Impact Development and a Conventional Development
by
Corinne Eileen Wilson
A thesis submitted to the Graduate Faculty of North Carolina State University
in partial fulfillment of the requirements for the Degree of
Masters of Science
Biological and Agricultural Engineering
Raleigh, North Carolina 2013
APPROVED BY:
________________________ ________________________ Dr. Gregory D. Jennings Mr. Andrew Fox
Biography
Corinne Wilson was born April 4, 1989 to Mr. & Mrs. Bruce and Eileen Dumonceau. Her family, including her younger brother, Adam Dumonceau, grew up in St. James, NY, a town a short drive from the beach on the north shore of Long Island. Although she did not develop much of a “lon-guyland accent” while living in NY, she gained many experiences
Acknowledgements
I feel like I have had a very blessed academic career and life, filled with the support of colleagues, friends, and family, all of who played a part in these past two years. The first ‘thank you’ would be to my husband, Greg, for finding Dr. Bill Hunt’s website and encouraging me to meet with him about graduate school. Without Greg’s encouragement and superman-like ability to network, I would not be where I am today.
I’d like to thank the Clean Water Management Trust Fund for funding this project. It has been a great experience to work in a city I’m passionate about on such an innovative project. Patrick Smith at Soil & Environmental Consultants, the designer of the project I studied, has been more than willing to help throughout this entire process, and I am so happy and thankful that he is so passionate about this design. I’d like to thank Regency for allowing me to work on such an interesting project.
Table of Contents
List of Tables ... vii
List of Figures ... ix
Chapter 1: A Review of Literature ...1
1.1 Urban Stormwater Impacts and Regulations ...1
1.2 Conventional Stormwater Runoff Control ...4
1.3 Low Impact Development ...7
1.4 Impact of Development Type on Site Hydrology ...14
1.5 Impact of Development Type on Site Water Quality ...17
1.6 Conclusions ...20
1.7 References ...22
Chapter 2: Hydrologic Comparison of an Urban Commercial Low Impact Development and a Conventional Commercial Development ...27
2.1 Abstract ...27
2.2 Introduction ...29
2.3 Methodology ...31
2.4 Results ...43
2.5 Conclusions ...62
2.6 References ...64
Chapter 3: A Comparison of Water Quality from a Urban Commercial Low Impact Development and a Conventional Development ...67
3.1 Abstract ...67
3.2 Introduction ...69
3.3 Methodology ...71
3.4 Results ...82
3.5 Conclusions ...95
3.6 References ...97
Chapter 4: Assessment of a Rainwater Harvesting System as a Component of an Innovative, Underground Low Impact Development ...100
4.1 Abstract ...100
4.2 Introduction ...102
4.3 Methodology ...103
4.4 Results ...109
4.5 Conclusions ...116
4.6 References ...118
List of Tables
Table 1.1: Pollutant export rates of various residential land uses (Line et al., 2002) ...2
Table 1.2: Summary of commercial EMCs ...18
Table 2.1: Characteristics of study sites examined in North Carolina ...33
Table 2.2: LID site cost breakdown ...38
Table 2.3: Monitoring equipment used in study ...39
Table 2.4: Curve number and initial abstraction values for land uses and antecedent moisture conditions ...41
Table 2.5: Median hydrologic values of the conventional development and the LID ...44
Table 2.6: Statistical analysis for paired differences of LID runoff volume ...46
Table 2.7: Statistical analysis for paired differences of conventional development runoff volume ...48
Table 2.8: Statistical analysis for paired differences ofconventional – LID inflow and outflow ...50
Table 2.9: Peak flow values of the conventional development and the LID ...54
Table 2.10: Statistical analysis for paired differences ofinflow – outflow for the conventional development and the LID ...56
Table 2.11: Statistical analysis for paired differences of conventional development and LID peak discharges ...58
Table 2.12: Predevelopment land use characteristics ...60
Table 3.1: Pollutant export rates of various residential land uses (Line et al., 2002) ...69
Table 3.2: Characteristics of study sites examined in North Carolina ...73
Table 3.3: LID site cost breakdown ...78
Table 3.4: Monitoring equipment used in study ...79
List of Figures
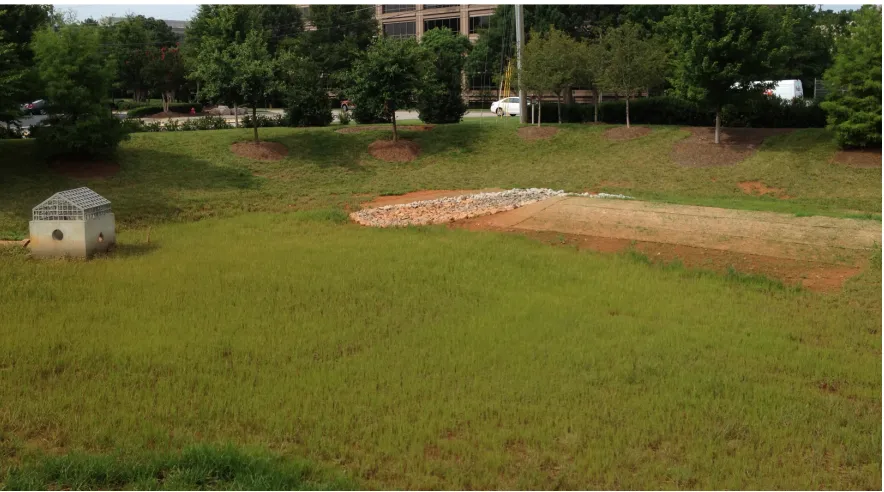
Figure 1.1: Dry detention basin in Raleigh, NC ...5
Figure 1.2: A grassed bioretention cell in Raleigh, NC ...8
Figure 1.3: A grassed swale in Raleigh, NC ...10
Figure 1.4: Permeable interlocking concrete pavers in Boone, NC ...11
Figure 1.5: RWH cisterns in Raleigh NC, from left: (a) aboveground, and (b) underground ...12
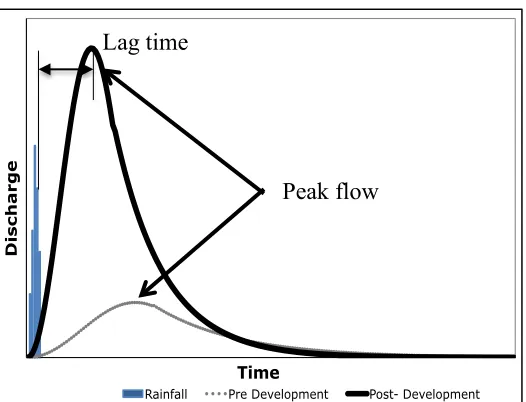
Figure 1.6: A single-event hydrograph ...15
Figure 2.1: Commercial LID diagrams, from left: (a) watershed land use and characteristics, and (b) major underground SCMs and tree irrigation zone ...32
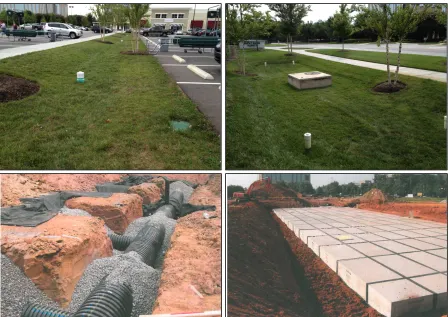
Figure 2.2: LID SCMs, clockwise from top left: (a) grassed swales, (b) pretreatment bioretention cell, (c) underground detention basin, and (d) underground infiltration trenches ...34
Figure 2.3: Drainage areas of cisterns, a bioretention cell, and a grassed swale ...35
Figure 2.4: Conventional site diagrams, from left: (a) watershed land use and characteristics, and (b) major SCMs ...36
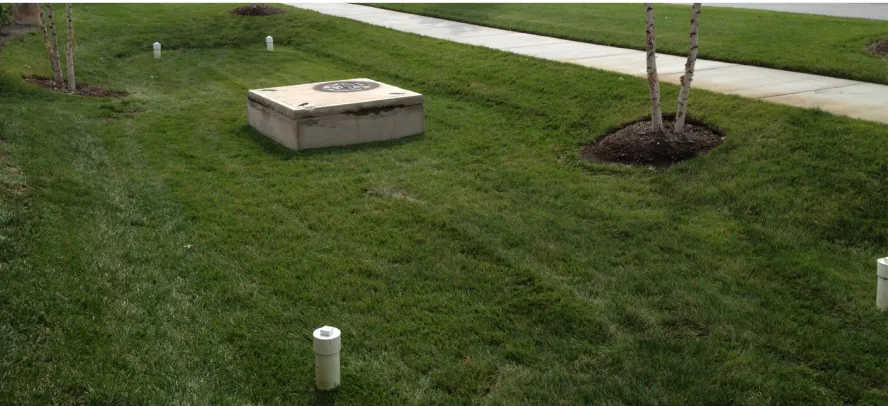
Figure 2.5: Conventional development design features, from left: (a) dry detention basin with grassed perimeter pretreatment swales and concrete outlet structure, and (b) pretreatment swales ...37
Figure 2.6: Monitoring equipment, from left: (a) ISCO 674 tipping bucket rain gage, (b) v-notch weir at outlet of LID site, and (c) compound v-notch weir at outlet of dry detention basin ...39
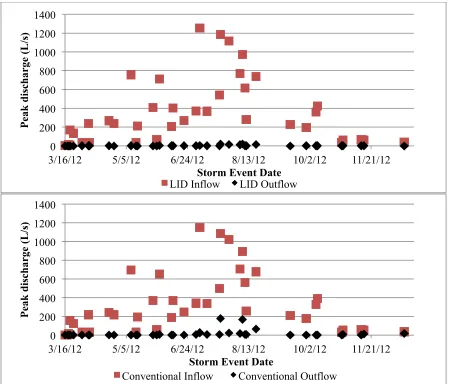
Figure 2.7: LID estimated inflow and measured outflow ...45
Figure 2.8: Conventional development estimated inflow and measured outflow ...47
Figure 2.9: Outflow from the conventional development and the LID ...49
Figure 2.10: Cumulative rainfall and runoff depths for the conventional development and the LID for inflow and outflow ...51
Figure 2.11: From top: calculated and measured outflow from the (a) LID, and (b) conventional development ...55
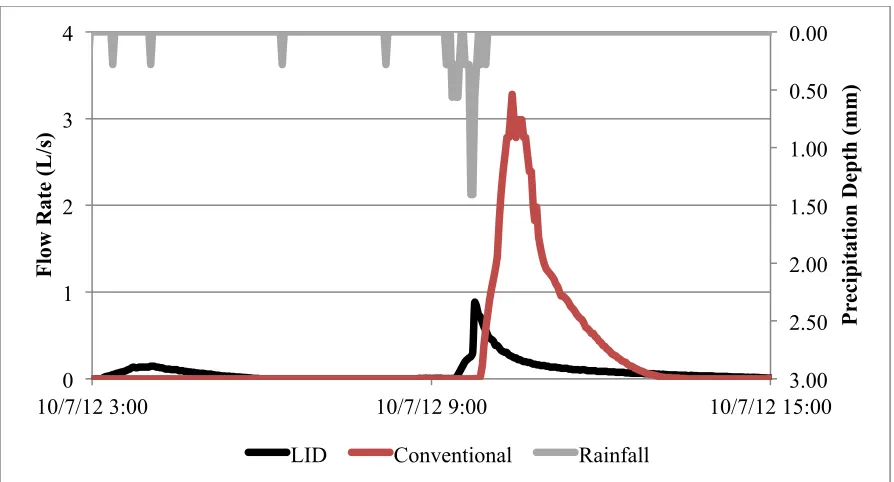
Figure 2.13: Hydrograph of rainfall, LID outflow, and conventional development outflow from a 9.7-mm storm event October 7, 2012 ...59 Figure 2.14: Peak discharges for predevelopment, postdevelopment with no stormwater treatment, postdevelopment with conventional SCM treatment, and postdevelopment with LID treatment for three monitored storm events larger than the 10-year storm in Raleigh, NC ...61 Figure 3.1: Commercial LID diagrams, from left: (a) watershed land use and characteristics, and (b) major underground SCMs and tree irrigation zone ...72 Figure 3.2: LID SCMs, clockwise from top left: (a) grassed swales, (b) pretreatment bioretention cell, (c) underground detention basin, and (d) underground infiltration trenches ...74 Figure 3.3: Drainage areas of cisterns, a bioretention cell, and a grassed swale ...75 Figure 3.4: Conventional site diagrams, from left: (a) watershed land use and characteristics, and (b) major SCMs ...76 Figure 3.5: Conventional development design features, from left: (a) dry detention basin with grassed perimeter pretreatment swales and concrete outlet structure, and (b) pretreatment swales ...77 Figure 3.6: Monitoring equipment, from left: (a) ISCO 674 tipping bucket rain gage, (b) v-notch weir at outlet of LID site, and (c) compound v-notch weir at outlet of dry detention basin ...79 Figure 3.7: Effluent nitrogen species EMCs by storm date, clockwise from top left: (a) TKN, (b) TAN, (c) NO2+NO3, and (d) TN ...88
Figure 4.3: Monitoring location of Underground Cistern 1 ...106 Figure 4.4: Inlet (downspout) monitoring setup, from left: (a) flow diversion device constructed to capture flow-proportional samples, (b) connection of downspout to sampling bottle, and (c)
monitoring box ...106 Figure 4.5: Outlet (irrigation) monitoring setup, from left: (a) sampling bottle with funnel, and (b) monitoring setup with irrigation line ...108 Figure 4.6: Influent and effluent storm EMCs, from left: (a) TAN, and (b) NO2+NO3 ...113
Chapter 1: A Review of Literature
1.1 Urban Stormwater Impacts and Regulations
As a result of growing concern for controlling water pollution, the United States
Environmental Protection Agency (USEPA) introduced the Clean Water Act in 1972. The goal of this legislation was for waterways to be “fishable and swimmable,” or meet their intended use, by reducing both point source and nonpoint source water pollution. Point sources are any “discernable, confined, and discrete conveyance…from which pollutants are or may be discharged.” Nonpoint sources for pollution include rainfall, snowmelt, and groundwater. For example, nonpoint source pollution may include nutrients in fertilizers applied on agricultural land and residential lawns or oils and hydrocarbons from vehicles on roadways that are mobilized by surface water runoff and conveyed toward receiving waters. The USEPA’s National Water Quality Inventory: 2004 Report to Congress identified
nonpoint source pollution as one of the top sources of impairment in assessed waterways (USEPA, 2009).
Of the pollutant sources described in the National Water Quality Inventory: 2004 Report to Congress, urban stormwater runoff is one of the leading sources of impairment in waterways (USEPA, 2009). Dietz and Clausen (2008) monitored runoff volume in CT during
increased impervious area due to urbanization, even if limited to 10% of the total watershed, increases flood frequency, increases discharge volume, and disturbs channel geomorphology (Moscrip and Montgomery, 1997). Streambed alterations such as incision and stream bank widening occur to accommodate the increased runoff volume, causing stream erosion and impairment to aquatic ecosystems (Hammer, 1973; Wang and Lyons, 2003).
Another important metric for evaluating impairment to receiving waterways is pollutant loads, a product of runoff volumes and pollutant concentrations. Line and White (2007) monitored a residential development in NC for runoff quality and quantity, comparing site hydrology and pollutant loads to an undeveloped property with a similar drainage area and location. Compared to the undeveloped property, the developed lot had a 68% greater runoff, 95% greater total suspended solids (TSS), and 66-88% higher nutrient loadings for nitrogen and phosphorus. Line et al. (2002) sampled water quality from various land uses, and determined pollutant export rates for total nitrogen (TN), total phosphorus (TP), and TSS for undeveloped and developed conditions (Table 1.1). Concentrations and loadings for each pollutant increased from undeveloped conditions to developed conditions in both studies by Line et al. (2002) and Line and White (2007), with TN, TP, and TSS pollutant export rates increasing threefold.
Table 1.1: Pollutant export rates of various residential land uses (Line et al., 2002)
Pollutant Export Rate (kg/ha/yr)
Several states, such as North Carolina and Maryland, have implemented stormwater control design requirements addressing postdevelopment stormwater quantity and quality issues. Requirements include peak flow attenuation, stormwater runoff volume control, and nutrient loading reduction (NCDENR, 2009a; MDE, 2009). The U.S. has termed waterways and watersheds with a history of high nutrient loading “Nutrient Sensitive Waters”, or NSWs. The Tar-Pamlico River Basin was the first watershed to be added to North Carolina’s NSW list in 1991 (NCDENR, 1990), followed by the Neuse River Basin in 1997 (NCDENR, 1999), the Jordan Lake Watershed in 2009 (NCDENR, 2009b), and most recently, the Falls Lake Watershed in 2010 (NCDENR, 2012).
North Carolina’s 16,000-km2 Neuse River Basin, encompassing a large expanse of agricultural land (approximately one-third of the watershed) and the Raleigh-Durham metropolitan area, has a history of poor water quality and fish kills due to nitrogen loading. Consequently, the Neuse River Basin is listed on the state’s 303(d) list of impaired
requires that the peak flow rate must not increase from predevelopment conditions for the 1-year return period, 24-hour duration storm. Further stormwater rules for the city of Raleigh include peak flow attenuation of the 2- and 10-year storm events (City of Raleigh, 2002).
Nutrient and hydrological reduction is met either through source reduction, which reduces influent pollutant loadings, or the use of stormwater control measures (SCMs) to capture and treat stormwater runoff (Stanley, 1996). Source reduction through decreased impervious areas, public education of stormwater issues, and routine maintenance of streets and storm drains are effective non-structural measures to reduce stormwater issues (NCDENR, 2009a). SCMs mitigate effluent water quality and quantity through peak flow mitigation, runoff volume control, and nutrient removal mechanisms of particle settling, nitrification, and denitrification.
1.2 Conventional Stormwater Runoff Control
resuspension of TSS particles and insufficient detention time (Fortunato et al., 2005; Jonathan et al., 1993; Stanley, 1996; Tillinghast et al., 2011).
Figure 1.1: Dry detention basin in Raleigh, NC
Dry detention basins, illustrated in Figure 1.1, are designed to mitigate the peak runoff during a storm and release the water at a slower rate to a storm drainage network (Roesner et al., 2001). Dry detention basins are designed to only hold water intra-event, staying dry otherwise. A major advantage of this SCM is its ability to effectively reduce peak flows from both small and large watersheds, typically up to 25 acres (NCDENR, 2009a). Dry detention basins successfully remove TSS and particle-bound nutrients through
(Hossain et al., 2005). Along with TSS, particle-bound nitrogen and phosphorus species settle and were generally removed, while dissolved nutrients have not been removed through dry detention (Pettersson, 1998). In a study of a dry detention basin in Greenville, NC, removal efficiencies of 71% for TSS, 45% for particulate nitrogen, and 33% for particulate phosphorus were shown. Dissolved nutrient concentrations did not statistically improve in the basin, with the exception of a 25% removal of dissolved phosphorus (Stanley, 1996). Middleton and Barrett (2008) studied a dry detention pond in Austin, TX. They found statistically significant removals of TSS (91%), TP (52%), total Kjeldahl nitrogen (TKN) (35%), and dissolved phosphorus (orthophosphate, Ortho-P) (7%).
Wet retention basins differ from dry detention basins only in that they hold a permanent pool of water throughout the year, allowing sufficient retention time for nitrification,
denitrification, and/or particle settling to occur. Wet retention basins are not designed to infiltrate runoff water, but to capture and release stormwater runoff slowly and mitigate peak flow rates. With the exception of evapotranspiration, runoff volume is not mitigated
Science parking lot runoff were studied. The former reduced TN, TP, and TSS by 36%, 36%, and 92%, respectively, while the latter had 59%, 57%, and 89% reductions, respectively (Winston et al., 2013). A retention basin in New Jersey showed seasonal variation as a strong covariate in determining pollutant reduction (Rosenzweig et al., 2011). For example, “reductions” of NO3-, NH4+, and TN were found to be -38%, 60%, and -10% during the winter and 19%, -10%, and 45% during the spring, respectively (Rozenweig et al., 2011). Seasonal variation in nutrient loads may be a result of fertilization patterns and temperature and climate variation affecting nutrient cycling.
Conventional SCMs successfully mitigate peak runoff and account for some particulate settling; however, drawbacks of conventional SCMs include a relative lack of nutrient removal and stormwater infiltration (Fortunato et al., 2005; Stanley, 1996; Jonathan et al., 1993). In addition, dry detention and retention basins may be required to occupy up to 8% of a property without consideration to parking or landscape benefit. Because of the land
requirement and lack of multiple uses, conventional SCMs may not be ideal in areas of high land cost or land scarcity (NCDENR, 2009a).
1.3 Low Impact Development
Low Impact Development (LID), a term coined by Prince George’s County, MD (1999), describes an alternative approach to stormwater management, focusing on mitigating
infiltration, decreasing runoff volumes and peak flows, and addressing water reuse (Perrin et al., 2009). Rather than a sole focus on peak flow mitigation, LID SCMs generally infiltrate stormwater, capturing stormwater and its associated pollutants onsite and allowing for groundwater recharge, runoff volume mitigation, and nutrient removal mechanisms (Dietz, 2007). Individual LID SCMs such as bioretention, swales, permeable pavement, and rainwater harvesting have been shown to be effective, sometimes more effective than their storage-based conventional SCMs, in capturing and detaining runoff volumes from the small (<50 mm, or 2 in.) storm events, but decrease in effectiveness as the storm size increases (Damodaram et al., 2010).
Figure 1.2: A grassed bioretention cell in Raleigh, NC
depressed area for storage of stormwater, a layer of permeable soil media for filtration of water, vegetation for biological nutrient removal mechanisms and gross-filtration, and in some cases an underdrain with an upturned elbow for increased N and P removal (Brown and Hunt, 2011; Davis et al., 2009; Hunt et al., 2012; NCDENR, 2009a). Bioretention systems have been proven to reduce peak flows up to 99%, reduce runoff volumes by 90%, and reduce TSS, TN, and TP loadings up to 99%, especially during storms smaller than the design event (typically 25 mm; Li et al., 2009; Hunt et al., 2008; Davis et al., 2006; USEPA, 2006). Figure 1.2 pictures the bioretention cell installed at the studied site in Raleigh, NC.
Figure 1.3: A grassed swale in Raleigh, NC
Figure 1.4: Permeable interlocking concrete pavers in Boone, NC
Infiltration structures, including basins and trenches, are designed to collect stormwater runoff, allowing the water to infiltrate into the underlying soil on site rather than run off into a storm drainage system, reducing runoff volumes and peak flow rates (Akan, 2002;
80-90% (Maniquiz et al., 2010). In New Hampshire, TSS removal rates of 95% were found for an underground infiltration trench system (Roseen et al., 2006).
LID emphasizes water use onsite through the use of rainwater harvesting (RWH) systems (Figure 1.5). The primary objective for RWH systems is to provide an alternative water source for non-potable uses such as irrigation, toilet flushing, car washing, and laundry rather than using potable water. Up to a 70% reduction in the demand for potable water can be expected for a LID incorporating RWH systems versus a development without the RWH (van Roon, 2007). This reduced demand for potable water in communities with municipal water supply reduces dependence on large-scale water treatment facilities.
Although streets and parking lots are the majority of impervious surfaces, rooftops encompass approximately 20% of impervious surfaces (Bannerman et al., 1993). Roof runoff consists of various pollutants and nutrients, dependent upon rooftop material and length of antecedent dry periods (Egodawatta et al, 2009). Historically implemented in arid or semi-arid regions, RWH has recently surged in popularity in more humid regions, such as the southeastern U.S., due to increased interest in water conservation, severe drought
conditions, and restrictions on lawn irrigation (Jones and Hunt, 2010). Varying the size and usage of RWH systems can affect the efficiency, water usage, and pollutant removal of the SCM (DeBusk et al., 2013; Jones and Hunt, 2010; Khastagir and Jayasuriya, 2010). The RWH system monitored at Craven County Animal Shelter in New Bern, N.C. was sized for a dedicated, year-round water usage inside the shelter, and therefore demonstrated the highest water usage and efficiency (DeBusk et al. 2013). In contrast, a system designed for irrigation showed increased reliance on rainfall frequency because of the smaller tank size and lack of usage outside of the growing season (Jones and Hunt, 2010).
water supply when designed properly, but it also has the potential for mitigation of stormwater runoff as well as sediment-bound pollutants.
Through the use of individual LID SCMs, runoff quality and quantity improvements are observed. Vegetated SCMs such as bioretention cells and swales successfully mitigated pollutant loadings into waterways, while pervious pavement and infiltration structures
reduced peak flow rates and runoff volumes. Research is still lacking on combining multiple SCMs with a large scale commercial LID.
1.4 Impact of Development Type on Site Hydrology
Since LID focuses on disconnecting impervious areas such as streets and rooftops, and managing this water on a local scale through the installation of various infiltration and harvesting-based SCMs, runoff volume exiting a conventional development is much greater than the volume exiting a LID (Bedan and Clausen, 2009; Dietz and Clausen, 2008; Hood et al., 2007; Line et al., 2012). Brander et al. (2004) modeled the effect of adding infiltration practices, such as bioretention and swales, to various types of developments, resulting in a reduction in runoff of up to 85% in all development types. The Jordan Cove Urban Watershed Project, which monitored a LID and conventional site, compared
Figure 1.6: A single-event flow hydrograph
Peak flow, or peak discharge, is defined as the largest discharge measured during a storm event (Figure 1.6). In a study by Hood et al. (2007), the peak discharge was eleven times greater in a conventional development with 1.5 times more impervious area than a LID, indicating that rather than the percentage imperviousness, disconnecting impervious areas impacts peak discharge. LID peak flows were significantly less than the control watershed as well. At the Jordan Cove Urban Watershed Project, peak discharge increased 2800% for conventional development, but decreased 26% for the LID (Bedan and Clausen, 2009).
Lag time, one important indicator of watershed health (Leopold, 1991), is measured as the time from the center of mass of rainfall until the peak flow is reached (Figure 1.1). Many factors contribute to the lag time of a watershed, including watershed size, soils, geology, slope, and land use (Dingman, 2002). A small lag time denotes an urbanized watershed with a higher amount of directly connected impervious surfaces, allowing stormwater to move
D
is
c
h
ar
g
e
Time
Rainfall Pre Development Post- Development Peak flow
more quickly than a less urbanized watershed (Kang et al., 1998). For small storms (<1”) of short duration (<4h), the lag time of a LID was shown to be three times greater than that of a conventional development (Hood et al., 2007), indicating the LID exhibited more similar characteristics to a natural, undeveloped watershed than the conventional development.
To determine the percentage of runoff generated from a precipitation event, a runoff coefficient for a storm is generated from a ratio of the runoff generated to precipitation (Equation 1.1).
𝑅𝑢𝑛𝑜𝑓𝑓 𝑐𝑜𝑒𝑓𝑓𝑖𝑐𝑖𝑒𝑛𝑡=𝑅𝑎𝑖𝑛𝑓𝑎𝑙𝑙 𝐷𝑒𝑝𝑡ℎ𝑅𝑢𝑛𝑜𝑓𝑓 𝐷𝑒𝑝𝑡ℎ
(1.1)
Hood et al. (2007) found that a LID produced a significantly smaller runoff coefficient (0.067) than both the conventional development (0.239) and the control (undeveloped) (0.193) scenarios. At the Jordan Cove Urban Watershed Project, though the LID received a higher amount of rainfall, LID runoff coefficients did not change from predevelopment conditions through development with 21% impervious surfaces. However, an exponential relationship was found between the runoff coefficient and impervious area at the
conventional development (Dietz and Clausen, 2007). Line et al. (2012) observed a slightly higher runoff coefficient at a commercial LID site (0.58) than a conventional commercial site treated with a wet retention basin (0.44). The high LID runoff coefficient reported by Line et al. (2012) was speculated to be a result of malfunctioning and undersized LID SCMs.
and detention basin had average runoff coefficients of 0.16 and 0.35 for the two parking lots monitored.
Infiltration-based LID combined with land preservation resulted in a hydrology similar to the predevelopment conditions in a study by Williams and Wise (2006). Studies by Bedan and Clausen (2009), Dietz and Clausen (2007), Hood et al. (2007), and Line et al. (2012) confirm that LID can outperform both conventional developments and, in some cases, undeveloped conditions based on common hydrologic metrics.
1.5 Impact of Development Type on Site Water Quality
Because individual LID SCMs mitigate nutrients, the potential for water quality improvement of a LID is presumed to be at least as high. Event mean concentrations (EMCs), a metric of evaluating water quality, are average effluent flow-weighted
concentrations of a storm event. EMCs of LID and conventional commercial developments, as well as EMCs from parking lot runoff and from commercial sites in the National
The commercial LID site (76% impervious) studied by Line et al. (2012) exhibited a
reduction in all pollutant concentrations between in the inlet and the outlet, showing pollutant treatment by bioretention cells, pervious concrete, and constructed stormwater wetlands used onsite. As compared to average parking lot runoff from eight parking lots in central North Carolina, EMCs of runoff leaving the LID site were lower for TKN, TAN, TP, Ortho-P, and TSS, and higher for NO2+NO3 (Line et al., 2012). The difference in NO2+NO3
concentrations between the parking lots and the LID outlet may have been attributed to nitrogen cycle processes (Table 1.2).
The residential conventional development and LID studied in the Jordan Cove reported a different trend in water quality between development type than the commercial
developments. In the residential conventional development (32% impervious), no significant change in NO2+NO3 and TAN concentrations were found between inflow and outflow, but a
Table 1.2: Summary of commercial EMCs.
Development type (mg/L) TKN (mg/L) TAN NO(mg/L) 2+NO3 (mg/L) TP Ortho-P (mg/L) (mg/L) TSS
NSQD a 1.6 0.50 0.6 0.22 0.11 42
Parking lot runoff b 1.19 0.32 0.36 0.19 0.07 -
Commercial: Conventional c 0.87 0.13 0.13 0.09 - 31.1
Commercial: LID c 0.69 0.06 0.56 0.06 0.01 18.4
Residential: Conventional d 1 0.15 0.3 0.185 - 24
Residential: LID d 1.3 0.03 0.4 0.291 - 11
a National Stormwater Quality Database, median commercial development (Pitt et al., 2004) b Eight parking lots in NC (Passeport and Hunt, 2009)
c Commercial Development in NC (Line et al, 2012)
2009). In the residential LID (22% impervious), three of the five pollutants studied
increased from inflow to outflow, likely due to organic nitrogen and fertilization inputs from the grassed swales (Bedan and Clausen, 2009).
Due to a combination of nutrient removal mechanisms and runoff volume reduction, LIDs significantly mitigate mass exports of pollutants, including nutrients, metals, bacteria, and sediment (Bedan and Clausen, 2009; Dietz et al., 2008; Hunt et al., 2008; Line et al., 2012). Dietz et al. (2008) sampled a LID and a conventional site, revealing that as impervious land cover increased during construction, NO2+NO3, TN, and TP export increased exponentially in conventional development, but no change in pollutant export was found from the LID. For TAN in particular, a decrease in export was observed in response to increased impervious areas in LID while TAN loads continued to increase in the conventional development. A similar trend was shown in a study of the same watershed post-construction by Bedan and Clausen (2009): as stormwater volume increased from the conventional watershed, so did nutrients (NO2+NO3, TAN, TKN, and TP) and TSS from predevelopment to
1.6 Conclusions
Although conventional SCMs such as dry detention and wet retention basins both mitigate peak flows and remove sediment and (to some extent) nutrients, LID was introduced to mimic predevelopment hydrology, thereby mitigating pollutant loads. Though limited literature exists comparing LID to conventional development, research on individual
infiltration-based SCMs, such as bioretention, swales, and infiltration trenches/basins, show high potential for mitigation of runoff volume, peak flow rates, and nutrient loadings. Existing literature suggests that LID reduces peak flow and runoff volumes, sometimes beyond predevelopment conditions, while showing a longer lag time and runoff coefficient than a conventional development (Bedan and Clausen, 2009; Brander et al., 2004; Dietz and Clausen, 2007; Hood et al., 2007; Williams and Wise, 2006). LID also proves capable of reducing pollutant concentrations, and moreover pollutant loadings, of nitrogen species, phosphorus species, and TSS (Bedan and Clausen, 2009; Dietz and Clausen, 2007; Line et al., 2012).
conventional development (centralized stormwater management) and an infiltration-based LID in Raleigh, N.C., were compared with respect to hydrology and water quality
1.7 References
Abbasi, T. and Abbasi, S.A. (2011). “Sources of pollution in rooftop rainwater harvesting systems and their control.” Critical Reviews in Environmental Science and Technology, 41(23), 2097-2167.
Akan, A. (2002). "Modified rational method for sizing infiltration structures." Canadian Journal of Civil Engineering, 29(4), 539-542.
Bannerman, R.T., Owens, D.W., Dodds, R.B. and Hornewer, N.J. (1993). “Sources of pollutants in Wisconsin stormwater.” Wat. Sci. Tech, 28(3-5), 241-259.
Barrett, M.E., Walsh, P.M., Malina, J.F. and Charbeneau, R.J. (1998). “Performance of vegetative controls for treating highway runoff.” J. Environ. Eng., 124(11), 1121-1128. Bean, E.Z., Hunt, W.F. and Bidelspach, D.A. (2007). “Evaluation of four permeable pavement sites in Eastern North Carolina for runoff reduction and water quality impacts.” Journal of Irrigation and Drainage Engineering, 133(6), 583-592.
Bedan, E.S. and Clausen, J.C. (2009). "Stormwater runoff quality and quantity from
traditional and low impact development watersheds." J.Am.Water Resour.Assoc., 45(4), 998-1008.
Birch, G.F., Fazeli, M.S. and Matthai, C. (2005). “Efficiency of an infiltration basin in removing contaminants from urban stormwater.” Environmental Monitoring and Assessment, 101(1–3), 23–38.
Brander, K., Owen, K. and Potter, K. (2004). "Modeled impacts of development type on runoff volume and infiltration performance." J.Am.Water Resour.Assoc., 40(4), 961-969. Brown, R.A. and Hunt, W.F. (2011). “Underdrain configuration to enhance bioretention exfiltration to reduce pollutant loads.” J.Environ.Eng., 137(11), 1082-1091.
Chen, J. and Adams, B.J. (2006). “Urban stormwater quality control analysis with detention ponds.” Water Environment Research, 78(7), 744-753.
Collins, K.A., Hunt, W.F. and Hathaway, J.M. (2008). “Hydrologic comparison of four types of permeable pavement and standard asphalt in Eastern North Carolina.” J. Hydrol. Eng., 13(12), 1146-1157.
Damodaram, C., Giacomoni, M.H., Khedun, C.P., Holmes, H., Ryan, A., Saour, W. and Zechman, E. M. (2010). "Simulation of combined best management practices and low impact development for sustainable stormwater management." J. Am. Water Resour. Assoc., 46(5), 907-918.
Davis, A.P., Hunt, W.F., Traver, R.G. and Clar, M. (2009). “Bioretention technology: Overview of current practice and future needs.” J. Environ. Eng., 135(3), 109-117. Davis, A.P., Shokouhian, M., Sharma, H. and Minami, C. (2006). “Water quality improvement through bioretention media: Nitrogen and phosphorus removal.” Water Environ. Res., 78(3), 284-293.
Deletic, A. and Fletcher, T.D. (2006). “Performance of grassed filters used for stormwater treatment – a field and monitoring study.” J. Hydrol. (Amsterdam), 317(3-4), 261-275. DeBusk, K.M., Hunt, W.F. and Wright, J.D. (2013). “Characterization of rainwater
harvesting performance in humid regions of the United States.” J.Am.Water Resour.Assoc., (accepted February 2013).
Dietz, M.E. (2007). "Low impact development practices: A review of current research and recommendations for future directions." Water Air and Soil Pollution, 186(1-4), 351-363. Dietz, M.E. and Clausen, J.C. (2008). "Stormwater runoff and export changes with
development in a traditional and low impact subdivision." J.Environ.Manage., 87(4), 560-566.
Dingman, S.L. (2002). Physical Hydrology (2nd Edition), Macmillan, New York. Egodawatta, P., Thomas, E. and Goonetilleke, A. (2009). "Understanding the physical processes of pollutant build-up and wash-off on roof surfaces." Sci.Total Environ., 407(6), 1834-1841.
Fortunato, C., McDonough, O. and Chambers, R. (2005). “The effectiveness of dry and wet stormwater detention basins as sediment and nutrient processors.” In ASCE Conference Proceedings, 178(98), 1-12.
Hossain, M.A., Alam, M., Yonge, D.R. and Dutta, P. (2005). “Efficiency and flow regime of a highway stormwater detention pond in Washington, USA” Water, Air, and Soil Pollution, 164(1), 79-89.
Hunt, W.F., Smith, J.T., Jadlocki, S.J., Hathaway, J.M. and Eubanks, P.R. (2008). “Pollutant removal and peak flow mitigation by a bioretention cell in urban Charlotte, NC.” J. Environ. Eng., 134(5), 403-408.
Hunt, W.F., Davis, A.P. and Traver, R.G. (2012). “Meeting hydrologic and water quality goals through targeted bioretention design.” J. Environ. Eng., 138(6), 698-707.
Jonathan, C., Bryant, G.J. and Andrews, D.J. (1993). “Ontario Stormwater Best Management Practices (BMP) Planning and Design Manual.” In Proceedings of the 6th International Conference on Urban Storm Drainage, Niagara Falls, Ontario, Canada, Volume II; Marsalek, J., Tornom H.C. (Eds.) IAHR/IAWQ Joint Committee on Urban Drainage, Seapoint Publishing: Victoria, British Columbia, Canada, 1055-1061.
Jones M.P. and Hunt, W.F. (2010). “Performance of rainwater harvesting systems in the Southeastern United States.” Resources Conservation and Recycling, 54, 623-629.
Kang, S., Park, J. and Singh, V. (1998). “Effect of urbanization on runoff characteristics of the On-Cheon stream watershed in Pusan, Korea.” Hydrological Processes, 12, 351-363. Khastagir, A. and Jayasuriya, L.N.N. (2010). "Impacts of using rainwater tanks on
stormwater harvesting and runoff quality." Water Sci. Technol., 62(2), 324-329. Leopold, L. (1991). “Lag Time for Small Drainage Basins.” Catena, 18(2), 157-171.
Li, H., Sharkey, L.J., Hunt, W.F. and Davis, A.P. (2009). “Mitigation of impervious surface hydrology using bioretention in North Carolina and Maryland.” J. Hydrol. Eng., 14(4), 407-415.
Line, D.E., Brown, R.A., Hunt, W.F. and Lord, W.G. (2012). “Effectiveness of LID for commercial development in North Carolina.” J. Environ. Eng., 138(6), 680-688.
Line, D.E. and White, N.M. (2007). “Effects of development on runoff and pollutant export.” Water Environ. Res., 79(2), 185-190.
Maniquiz, M.C., Lee, S. and Kim, L. (2010). "Long-term monitoring of infiltration trench for nonpoint source pollution control." Water Air and Soil Pollution, 212(1-4), 13-26.
MDE (Maryland Department of the Environment). (2009). "Maryland Stormwater Design Manual."
Middleton, J.R. and Barrett, M.E. (2008). “Water quality performance of a batch-type stormwater detention pond.” Water Environ. Res., 80(2), 172-178.
NCDENR (North Carolina Department of Natural Resources). (2010). “Falls reservoir water supply nutrient strategy: stormwater management for new development.”
NCDENR (North Carolina Department of Natural Resources). (2009a). “Jordan water supply nutrient strategy rules.”
NCDENR (North Carolina Department of Environmental and Natural Resources). (2009b). "Stormwater Best Management Practices Manual.”
NCDENR (North Carolina Department of Natural Resources). (2001). “Tar-Pamlico river basin – nutrient sensitive waters management strategy.”
NCDENR (North Carolina Department of Natural Resources). (1999). “Neuse River Basin: Model Stormwater Program for Nitrogen Control.”
Passeport, E. and Hunt, W.F. (2009). “Asphalt parking lot nutrient characterization for eight sites in North Carolina, USA.” J. of Hydrol. Eng., 14(4), 352-361.
Perrin, C., Milburn, L., Szpir, L., Hunt, W.F., Bruce, S., McLendon, R., Job, S., Line, D., Lindbo, D., Smutko, S., Fisher, H., Tucker, R., Calabria, J., DeBusk, K., Cone, K.C., Smith-Gordon, M., Spooner, J., Blue, T., Deal, N., Lynn, J., Rashash, D., Rubin, R., Senior, M., White, N., Jones, D. and Eaker, W. (2009). “Low Impact Development: A Guidebook for North Carolina (AG-716).” NC Cooperative Extension Service, NC State University. website: http://www.ncsu.edu/WECO/LID
Pettersson, T.J.R. (1998). “Water quality improvement in a small stormwater detention pond.” Wat. Sci. Tech., 38(10), 115-122.
Pitt, R., Maestre A. and Morquecho R. (2004) “Evaluation of NPDES phase I Municipal Stormwater Monitoring Data” In: National Conference on Urban Stormwater: Enhancing the Programs at the Local Level. EPA/625/R-03/003.
Roesner, L., Bledsoe, B. and Brashear, R. (2001). "Are best-management-practice criteria really environmentally friendly?" Journal of Water Resources Planning and Management, 127(3), 150-154.
Roseen, R.M., Ballestro, T.P., Houle, J.J., Avelleneda, P., Wildey, R. and Briggs, J. (2006). “Storm water low-impact development, conventional structural, and manufactured treatment strategies for parking lot runoff.” Transportation Research Record: Journal of the
Transportation Research Board, No. 1984, 135-147.
Rozenweig, B.R., Smith, J.A., Baeck, M.L. and Jaffé, P.R. (2011). “Monitoring nitrogen loading and retention in an urban stormwater detention pond.” J. Environ. Qual., 40(2), 598-609.
Stanley, D.W. (1996). “Pollutant removal by a stormwater dry detention pond.” Water Environment Research, 68(6), 1076-1083.
Tillinghast, E.D., Hunt, W.F. and Jennings, G.D. (2011). “Stormwater Control Measure (SCM) Design Standards to Limit Stream Erosion for Piedmont North Carolina.” Journal of Hydrology, 411(3-4), 185-196.
USEPA. (2009). "National Water Quality Inventory: 2004 Report to Congress." EPA-841-R-08-001, Washington, D.C.
van Roon, M. (2007). "Water localisation and reclamation: Steps towards low impact urban design and development." J. Environ. Manage., 83(4), 437-447.
Wardynski, B.J., Winston, R.J. and Hunt, W.F. (2012). “Internal water storage enhances exfiltration and thermal load reduction from permeable pavement in the North Carolina mountains.” Journal of Environmental Engineering, 139(2), 187-195.
Williams, E. and Wise, W. (2006). "Hydrologic impacts of alternative approaches to storm water management and land development." J.Am.Water Resour.Assoc., 42(2), 443-455. Winston, R.J., Hunt, W.F., Kennedy, S.G., Wright, J.D. and Lauffer, M.S. (2012). “Field evaluation of storm-water control measures for highway runoff treatment.” J. Environ. Eng., 138(1), 101-111.
Chapter 2: Hydrologic Comparison of an Urban Commercial Low Impact Development
and a Conventional Commercial Development
2.1 Abstract
Urbanization and its associated increased impervious footprint lead to stream impairment through erosion, flooding, and augmented pollutant loads. Low Impact Development (LID) focuses on disconnecting impervious areas, increasing infiltration and evapotranspiration, and reusing stormwater on site through the use of stormwater control measures (SCMs). In this study, a conventional development (centralized stormwater management) and an
more intense than the 10-year storm, the conventional site averaged a 7.7 times higher peak flow than the LID, when normalized by DCIA. Results from this innovative combined detention, stormwater harvesting, and infiltration LID system demonstrate highly effective and space-saving solutions for areas where aboveground SCMs, such as bioretention and constructed stormwater wetlands, are not feasible due to high land costs.
2.2 Introduction
Urban stormwater runoff is one of the leading sources of impairment in waterways (USEPA, 2009). Increased impervious area due to urbanization, even if limited to 10% of the total watershed, increases flood frequency, increases discharge volume, and disturbs channel geomorphology (Moscrip and Montgomery, 1997). In CT, Dietz and Clausen (2008) found as the impervious area increased from 1% to 32% during construction, an increase in runoff of 4900% resulted. Due to increased flow rates, stream impacts such as incision and stream bank widening occur, causing stream erosion and impairment to aquatic ecosystems
(Hammer, 1972; Wang and Lyons, 2003).
Low Impact Development (LID), a term coined by Prince George’s County, MD (1999), describes an alternative approach to stormwater management, focusing on mitigating
control, or undeveloped, watershed, the LID peak discharge was only 20% of the
undeveloped peak discharge. Hood et al. (2007) demonstrated that with residential LID it is possible to not only mimic predevelopment hydrology, but to reduce runoff volumes and peak discharges to below predevelopment conditions. The same residential study produced a smaller runoff coefficient (ratio of runoff to rainfall) (0.067) for residential LID than for both the conventional residential development (0.239) and the control (undeveloped) (0.193) watersheds (Hood et al., 2007).
Peer-reviewed literature on LID for commercial sites is somewhat limited. Most studies focus on a single SCM, one exception being Line et al. (2012) incorporating bioretention, permeable pavement, and constructed stormwater wetlands at a commercial development in North Carolina. This LID site was more effective at reducing pollutant loadings compared to a conventional wet detention basin in North Carolina; however, this LID site did not reduce outflow volumes more than the conventional wet pond due to an unexpectedly high
number was reduced by a factor of 2.7 – 5.9 due to their infiltration capabilities (Rushton, 2001).
In areas of high land value or low land availability, large-scale commercial options for stormwater control may include incorporating underground SCMs to detain and infiltrate stormwater, but the performance of predominantly underground LID infrastructure has yet to be demonstrated. Moreover, the performance of a system combining large detention and infiltration-based SCMs with smaller LID SCMs has yet to be demonstrated for hydrologic mitigation.
This study compared the hydrology of two side-by-side commercial developments: (1) a conventional development treated with a simple swale and dry pond and (2) an innovative commercial LID consisting of aboveground and underground stormwater treatment. The LID site contained cisterns for water harvesting, aboveground swales and bioretention for water quality mitigation, and a large-scale underground detention and infiltration system.
2.3 Methodology
precipitation for Raleigh is 1179 mm/year (SCO, 2012). The sites were adjacent to one another, so they were exposed to the same climatic conditions.
2.3.1 Site Descriptions
Figure 2.1: Commercial LID diagrams, from left: (a) watershed land use and characteristics, and (b) major underground SCMs and tree irrigation zone
The 2.5-ha commercial LID site, consisting of a mix of commercial businesses and
restaurants, an asphalt parking lot, several vegetated parking islands, and a preserved natural wooded area, drained into a series of underground and aboveground SCMs (Figures 2.1a, 2.1b). The drainage area and land use characteristics of the site are found in Table 2.1. The LID site was intended to (1) mimic predevelopment peak discharges for the Type II, 2-year and 10-year return period storms (142 mm/hour and 181 mm/hr, respectively), and (2) capture and infiltrate runoff from the 25-mm water quality event.
N
FEET METERS
15
0 30 60 120 240 5
0 10 20 40 80
ROOFTOP PAVEMENT WOODED VEGETATED
SIX FORKS ROAD
COLONNADE CENTER DRIVE
Table 2.1: Characteristics of study sites examined in North Carolina
LID Conventional Development
Location Intersection of Six Forks & Strickland Roads, Raleigh, NC
(35.900°N, -78.651°W)
Intersection of Six Forks & Strickland Roads, Raleigh, NC
(35.897°N, -78.649°W)
Year built 2011 2007
Watershed Neuse River Basin Neuse River Basin
Catchment composition Commercial businesses, grocery store, and restaurant
Commercial businesses Underlying soil Appling (Hydr. Soil Group B) Cecil (Hydr. Soil Group B)
Catchment area, ha 2.53 2.76
Grassed 0.13 1.09
Wooded 0.29 -
Rooftop 0.54 0.24
Parking 1.57 1.43
% of catchment as DCIA 84% 61%
Three cisterns, totaling approximately 162,800 L of storage, captured runoff from the rooftop surfaces and recycled the water onsite for indoor and outdoor uses. A 44,300-liter
Figure 2.2: LID SCMs, clockwise from top left: (a) grassed swales, (b) pretreatment bioretention cell, (c) underground detention basin, and (d) underground infiltration trenches
Figure 2.3: Drainage areas of cisterns, a bioretention cell, and a grassed swale
The remainder of the stormwater (1.37 ha drainage area) was conveyed directly into the detention chamber through drop inlets and curb inlets. Immediately prior to entering the detention chamber, all stormwater was routed to concrete StormTrap™ pretreatment units, including an underflow weir and baffles for oil/water separation and sediment and debris removal. The detention basin included a 38-mm diameter drawdown orifice, designed to dewater the detention basin in five days or less. Overflow from the detention chamber drained into an underground infiltration gallery, a 760 m gravel filled trench system (435 m3 of storage) overlying undisturbed soil (Figure 2.2d). The infiltration gallery was designed to have an infiltration rate of 3 mm/hr, infiltrating the 25-mm design storm in 4 days. Overflow
CISTERN PRETREATMENT
BIORETENTION PRETREATMENT
GRASSED SWALE PRETREATMENT
N
FEET METERS
SIX FORKS ROAD
from the infiltration gallery exited the site through a 380-mm diameter concrete pipe into the municipal storm drainage system.
Figure 2.4: Conventional site diagrams, from left: (a) watershed land use and characteristics, and (b) major SCMs
Site characteristics and land use for the conventional site, a 2.8 ha commercial watershed, are found in Table 2.1 and Figure 2.4a. SCMs treating stormwater at this site included three grassed pretreatment swales (33 m and 29 m linear swales, and a 90-m perimeter swale surrounding the dry detention basin) and a 0.14 ha dry detention basin (Figure 2.4b). Stormwater was routed to one of the three swales for pretreatment before entering the dry detention pond through concrete culverts (Figures 2.5a, 2.5b). The dry detention basin detained and slowly released this stormwater runoff through a concrete outlet structure into the existing storm drainage network (Figure 2.5a). The dry detention pond was designed to
ROOFTOP
PAVEMENT
VEGETATED
FEET METERS
15
0 3060 120 240
5
0 10 20 40 80
N
SIX FORKS ROAD COLONNADE CENTER DRIVE
Dry Detention Basin Grassed
(1) control runoff volumes from the 1-year, 24-hour storm (72.4 mm in Raleigh, NC; NOAA, 2006), releasing this runoff volume over a minimum duration of 48 hours and (2) control peak flows from the 2-year and 10-year storm events (142 mm/hour and 181 mm/hr, respectively; NOAA, 2006).
Figure 2.5: Conventional development design features, from left: (a) dry detention basin with grassed perimeter pretreatment swales and concrete outlet structure, and (b) pretreatment swales
2.3.2 Site Cost
Table 2.2: LID site cost breakdown
Pretreatment $59,700.00
Pre-treatment Units $40,700.00
Bioswales $8,400.00
Bioretention Area $10,600.00
Underground System $541,900.00
Underground Detention & Settling Chamber $338,950.00
Infiltration System $132,200.00
Pipe Network $70,750.00
Cisterns & Irrigation $124,500.00
Cisterns $111,250.00
Spray Irrigation & Infiltration System $13,250.00
Total $726,100.00
2.3.3 Monitoring
This study compared two watersheds after the implementation of conventional and LID SCMs. Aspects of two monitoring designs were used in this study: upstream/downstream and paired watershed (Clausen and Spooner, 1993). Measured discharge at the outflow (downstream) station was compared to precipitation-based estimated inflow (upstream) values for peak flow and runoff volumes at each site using the upstream/downstream
Figure 2.6: Monitoring equipment, from left: (a) ISCO 674 tipping bucket rain gage, (b) v-notch weir at outlet of LID site, and (c) compound v-notch weir at outlet of dry detention basin
Monitoring equipment used in this study is found on Table 2.3. An ISCO 674 tipping-bucket rain gage (Figure 2.6a) located at the conventional development site recorded precipitation depth and intensity of storm events. To check the accuracy of the automatic rain gage, a manual rain gage measured precipitation depth and was used to calibrate the tipping-bucket rain gauge. On average, the automatic rain gage data was adjusted by a correction coefficient of 1.15; the adjustment amount did not depend on rainfall intensity. Precipitation values enabled calculation of inflow volumes to estimate inflow pollutant loading.
Table 2.3: Monitoring equipment used in study
LID Conventional Development
Precipitation - ISCO 674 Automatic Rain Gage1
Water level ISCO 730 Bubbler Module ISCO 730 Bubbler Module Stage-Discharge
Relationship
30°, 150-mm V-notch weir 30°, 100-mm V-notch weir, 410-mm rectangular end restrictions
Data Storage ISCO 6712 Sampler ISCO 6712 Sampler
Monitoring equipment was installed at the outlet to the municipal storm drainage network at each site: the 610-mm diameter outlet pipe at the conventional development was fitted with a steel compound weir (Figure 2.5b), and the 380-mm diameter outlet pipe at the LID was fitted with a steel v-notch weir (Figure 2.5c). Water levels at each site outlet were measured at 2-minute intervals throughout each storm event by ISCO 730 Bubbler Modules installed at the invert of the pipe at the LID site and inside the concrete outlet structure at the
conventional site. ISCO 6712 Samplers fitted with the bubbler modules at each site recorded and stored water level data throughout each storm event. Recorded water levels were
converted to storm discharge through stage-discharge weir equations. Equations and calculations are found in Appendix A.
Power failure due to insufficient battery life, holes cut in the bubbler tubing, and air in the bubbler tubing caused occasional data collection malfunction. This was not an issue at the conventional development, with the exception of one incident where the bubbler tubing was accidentally cut due to plant maintenance in the dry pond. A few occurrences of insufficient battery life caused some data to be omitted, but overall data collection malfunction was low at both sites (4 of 24 storm events). Incorrect data were not included in analyses. To ensure that data collected were accurate, a manual level was measured after each storm, and
Table 2.4: Curve number and initial abstraction values for land uses and antecedent moisture conditions (AMC; USDA, 1972)
AMC I AMC II AMC III
CN Ia (mm) CN Ia (mm) CN Ia (mm)
Grassed 63 29.8 80 12.7 91 5.0
Wooded 40 76.2 60 33.9 78 14.3
Rooftop (concrete) 94 3.2 98 1.0 99 0.5
Parking (asphalt) 94 3.2 98 1.0 99 0.5
Theoretical inflow runoff volumes were calculated by assigning curve numbers (CN) to each land type based on land use, hydrologic soil group, and land slope (USDA, 1972). Storage (S, mm) and initial abstraction (Ia, mm) were calculated from the curve numbers (Equations 2.1, 2.2) using the discrete method to separate the DCIA from pervious areas, and are shown in Table 2.3 (USDA, 1972). Subtracting Ia from each precipitation depth produced an estimated runoff depth for each monitored storm (Brown and Hunt, 2011; Pandit and Heck, 2009). Runoff depths were multiplied by respective land areas to estimate composite inflow volumes for each storm.
𝑆= !"""!" −10 (2.1)
𝐼𝑎=0.2𝑆 (2.2)
𝑄𝑃= 𝐶𝑖𝐴360 (2.3)
for grassed areas, and 0.15 for wooded natural conditions (USDA, 2004). Using measured rainfall intensities (i, mm/hr) and known areas (A, hectares) for each land use, estimated peak flows (QP, m3/s) were calculated for each storm. Runoff coefficients were calculated from a ratio of observed runoff depths to rainfall depths. Runoff depths for each storm were
calculated by normalizing the runoff volume at each site by their respective watershed area. To relate runoff coefficients observed to those expected, typical runoff coefficients reported by ASCE (1972) were used for comparison.
2.3.4 Data Analysis
Data analysis was performed with SAS® 9.3 software (SAS Institute, Inc. 2012) to statistically compare hydrologic differences between the two watersheds. Differences of paired data sets were first tested for normality with three goodness–of–fit tests: Kolmogorov-Smirnov, Cramer-von Mises, and Anderson-Darling. Resulting normally distributed data were tested for statistical significance using the student’s t test; non-normal data were log-transformed and reanalyzed for a normal distribution. Resulting log-log-transformed data fitting a normal distribution were analyzed using the student’s t test; non-normal data were analyzed for statistical significance using nonparametric tests (Wilcoxon signed rank or sign test). Due to the assumption of symmetry in the Wilcoxon signed rank test, outliers of
Covariance (ANCOVA) determined the effect of seasonality on results. Data were analyzed for significance at the α=0.05 level. SAS® code is included in Appendix D.
2.4 Results
2.4.1 Precipitation Characteristics
Site hydrology and precipitation were monitored from January 11 – December 18, 2012. During 2012, annual precipitation of 1285 mm was 9% above the climate normal of 1179 mm. Annual rainfall was not compiled at the site; however, these annual precipitation values were observed in Raleigh, NC (Station #317079: Raleigh State Univ, 35.794°N, 78.699°W), approximately 15 km from the study site.
The 47 storms monitored produced approximately 777 mm of rainfall, much less than that of the annual rainfall observed in Raleigh, NC. Reasoning behind a lack of annual recorded rainfall onsite was attributed to two factors: (1) manual rain gage readings were not recorded during non-sampled events for the first six months of the study period, and (2) storm events that did not produce runoff (generally precipitation depths less than 5 mm) were not included in the monitored 777 mm. Therefore, it is important to emphasize that this 777 mm of recorded data was not the annual precipitation depth onsite.
(115.6 mm/hour) was significantly higher than in winter (17.3 mm/hour; p=0.0077), spring (46.5 mm/hour; p=0.0002), and fall (26.7 mm/hour; p=0.0001).
2.4.2 Runoff Volume
Both the conventional development and the LID sites were designed for peak flow mitigation; the LID site was also designed for runoff volume mitigation. Runoff volume reduction was observed at both sites. The median values of runoff volume, reduction, and coefficients were computed for each site, and are shown in Table 2.5.
Table 2.5: Median hydrologic values of the conventional development and the LID. Conventional Development
(n=47) LID (n=47)
Ratio: Conventional / LID
Inflow volume (m3)a 175.12 219.30 0.80
Inflow depth (mm) a b 10.49 10.39 1.01
Outflow volume (m3) 94.56 3.40 27.83
Outflow depth (mm)b 5.66 0.16 35.16
Runoff reduction (%) 51.4% 98.3% 0.52
Runoff coefficient 0.49 0.02 34.85
aEstimated from Curve Number method bNormalized by DCIA
Inflow calculations are found in Appendix B. Median inflow runoff volumes for the conventional development and LID were 175 m3 and 219 m3, respectively, while cumulatively, inflow volumes of 12930 m3 and 14252 m3 were calculated for the
period, the median outflow volume at the conventional site is 35 times higher than at the LID, showing the higher potential of the LID site to mitigate runoff volumes through detention and infiltration.
Figure 2.7: LID estimated inflow and measured outflow
Figure 2.7 illustrates the estimated inflow and observed outflow volumes at the LID site. A median runoff reduction of 98.3% was observed at the LID site, meaning that all but 1.7% of the stormwater was detained onsite and infiltrated into the underlying soils or harvested. This high runoff volume reduction was due to the detention and infiltration capacity of the underground stormwater detention chamber and the infiltration gallery, as well as the high infiltration capacity of the underlying soils. Prior to construction, infiltration rates of 6.4 mm/hour were measured at the invert of the infiltration gallery (Patrick Smith, personal communication, January 4, 2013), falling at the upper end of the infiltration range of 3.8 – 7.6 mm/hour for hydrologic soil group B soils (Musgrave, 1955). The LID was designed to
0 300 600 900 1200
1/1/12 3/2/12 5/2/12 7/2/12 9/1/12 11/1/12 1/1/13
R
u
n
off vol
u
me
(m3)
capture all stormwater from the 25-mm event for infiltration; however, minimal outflow is observed for 46 of the 47 storms (38 of which were less than 25 mm). This unexpected outflow volume may be attributed to a suspected cross-connection in the underground system due to construction errors. Although the average storm depth and intensity were smaller in autumn, LID outflow was 6-7 times higher in autumn than the spring (p=0.0029) and winter (p=0.0048), which was unexplained in the data.
Table 2.6: Statistical analysis for paired differences of LID runoff volume
Paired Difference: LID inflow - outflow
Distribution: Non-normal
Test used: Sign test
Test statistic: M = 23.5
p <0.0001
Figure 2.8: Conventional development estimated inflow and measured outflow
Figure 2.8 illustrates the inflow and outflow runoff volumes calculated and measured, respectively, at the conventional development. The conventional development had a median runoff reduction of 51.4%, approximately one-half of the reduction measured at the LID site. Because dry detention basins are not designed to infiltrate stormwater, but to mitigate peak flow, this runoff reduction value is higher than expected for the conventional site (Roesner et al., 2001). This may be due to error in approximating the inflow runoff volumes for each storm, a higher-than-expected infiltration capacity of the underlying soil, or a leak in the outlet structure. However, a trio of double ring infiltrometer tests in the dry detention basin yielded an average infiltration rate of approximately 0.17 mm/h, which is much lower than the expected value for hydrologic soil group B soils (3.8 – 7.6 mm/hour; Musgrave, 1955). Likely due to smaller storm depths and intensities during the fall season, conventional development outflow in the spring, summer, and winter seasons are 4-5 times higher than that in the fall season (p=0.007, p=0.0256, and p=0.0390, respectively).
0 150 300 450 600 750 900
1/1/12 3/2/12 5/2/12 7/2/12 9/1/12 11/1/12 1/1/13
R
u
n
off vol
u
me
(c
ms
)
Storm Event Date
Table 2.7: Statistical analysis for paired differences of conventional development runoff volume
Paired Difference: Conv. inflow - outflow
Distribution: Non-normal
Test used: Sign test
Test statistic: M = 20.5
p <0.0001
The conventional development had significantly lower outflow than inflow (p <0.0001), ranging from no net reduction for 5-mm, 13-mm, and 9-mm storms to a 100% runoff
Figure 2.9: Outflow from the conventional development and the LID.
The median outflow runoff volumes for the conventional and LID sites were 95 m3 and 3.4 m3, respectively (Figure 2.9). The conventional development was measured to have a higher outflow runoff volume than the LID for 44 of 47 storms. The three remaining storm events exhibited a slightly lower outflow at the conventional development site than the LID site. Of these three storms, one storm (5 mm) produced no outflow at the conventional site, while the other two storms (12 mm and 21 mm) showed over 95% reduction at the conventional site. The high runoff volume reduction at the convention development for the 21-mm storm event was likely due to hydrologic outflow measuring error. However, because of the low
magnitude of the outflow differences (between 0.4 and 1.9 m3 per storm event), none of these storms were considered outliers.
0 100 200 300 400 500 600 700
1/1/12 3/2/12 5/2/12 7/2/12 9/1/12 11/1/12 1/1/13
R
u
n
off vol
u
me
(c
ms
)
Storm Event Date
Table 2.8: Statistical analysis for paired differences of conventional – LID inflow and outflow Paired Difference: Inflow: Conventional - LID Outflow: Conventional - LID
Distribution: Non-normal Non-normal
Test used: Wilcoxon signed rank Sign test
Test statistic: S = -400 M = 20.5
p <0.0001 <0.0001
In this study, the conventional development was not designed for runoff volume reduction, but both sites mitigated runoff volumes significantly (p<0.0001). Figure 2.10 displays the cumulative rainfall depth monitored throughout the monitoring period, as well as the runoff depth discharged at the inflow and outflow of each site. Runoff depth was computed by dividing cumulative runoff volumes by each site’s respective DCIA. Of the 777 mm of rainfall recorded at the site, the conventional development and the LID had cumulative inflow runoff depths of 468 and 516 mm, respectively. After treatment from SCMs at both sites, the conventional development and the LID exported 236 and 15 mm of cumulative runoff depth, respectively, and had cumulative runoff depth reductions of 49.7% and 97.0%, respectively.
Figure 2.10: Cumulative rainfall and runoff depths for the conventional development and the LID for inflow and outflow
0 100 200 300 400 500 600 700 800
0 50 100 150 200 250 300 350
R
ai
n
fal
l/
R
u
n
off D
ep
th
(mm)
Julian Day