ABSTRACT
KAKARADDI, SHISHIR MAHESH. A Comparison of Summarization Techniques for Small Sets of Micro Blogs. (Under the direction of Dr. Robert St. Amant.)
Microblogs are a popular way to keep abreast with important information about
dif-ferent topics. Half a billion people across the world use Twitter, and 340 million tweets
are posted each day. With so much available data, summarization is critical. This thesis
examines the problem of summarizing tweets from a single Twitter user over the course
of a few weeks to a month; for typically active Twitter users, this is between 35 and
60 tweets. The summarization takes the form of a subset of those tweets. We have
de-veloped and compared algorithms that can be used to summarize tweets in this way.
We describe an unsupervised algorithm that clusters tweets by topic, using information
retrieval techniques, and then selects a specific tweet from each cluster, relying on
sen-timent. An experimental evaluation shows that this approach produces results that are
not as good as those of human summarizers, but are better than an existing baseline for
© Copyright 2012 by Shishir Mahesh Kakaraddi
A Comparison of Summarization Techniques for Small Sets of Micro Blogs
by
Shishir Mahesh Kakaraddi
A thesis submitted to the Graduate Faculty of North Carolina State University
in partial fulfillment of the requirements for the Degree of
Master of Science
Computer Science
Raleigh, North Carolina
2012
APPROVED BY:
Dr. Edward F. Gehringer Dr. Christopher G. Healey
DEDICATION
To my family, for their support, love and encouragement
To my advisor, Dr. Robert St. Amant, for his guidance in research
BIOGRAPHY
Shishir Mahesh Kakaraddi was born on 21st July, 1987 in Belgaum, Karnataka, India.
He received a Bachelor of Engineering degree in Information Science from M S Ramaiah
Institute of Technology, Bangalore, India. He worked at IBM India Pvt Ltd as Software
Developer for 11 months and then he joined North Carolina State University to pursue his
Masters degree in the Department of Computer Science. After completion of his Masters
ACKNOWLEDGEMENTS
I would like to thank my advisor Dr. Robert St. Amant who provided the necessary
motivation and great advice on research ideas and dissertation writing. I also want to
thank other committee members, Dr. Edward Gehringer and Dr. Christopher Healey, for
spending their time reading my thesis and contributing valuable comments and
sugges-tions.Thanks to Dr. Tessa Lau, Research Staff Member, IBM Research for encouraging me
to do research and for introducing me to my advisor. I want to thank my friends Sridevi
Venugopal and Thothathri Srinivasan for providing their opinions on several intermediate
results. I would like to thank Arpan Chakraborty, Sina Bahram, Srinath Ravindran and
others in the Knowledge Discovery Lab for their valuable suggestions. I would also like
TABLE OF CONTENTS
List of Tables . . . vi
List of Figures . . . vii
Chapter 1 Introduction . . . 1
1.1 Twitter . . . 1
1.2 Goals . . . 3
1.3 Contribution . . . 4
Chapter 2 Related Work . . . 6
2.1 Twitter Classification . . . 6
2.2 Twitter Summarization . . . 8
Chapter 3 Preliminary Development . . . 13
3.1 Data Preparation . . . 14
3.2 Data Processing . . . 15
3.3 Classification . . . 16
3.4 Clustering . . . 18
Chapter 4 System Development . . . 22
4.1 Computing Features . . . 22
4.2 Clustering Algorithm . . . 23
4.3 Cluster Summary . . . 26
Chapter 5 Evaluation. . . 28
5.1 Experiment Hypotheses . . . 28
5.2 Experiment Setup . . . 32
5.3 Experiment Design . . . 33
5.4 Experiment Findings . . . 34
Chapter 6 Conclusion . . . 41
6.1 Modified K-means Discussion . . . 41
6.2 Future Work . . . 42
References . . . 44
Appendices . . . 47
Appendix A Dataset: Tweets of #BarackObama . . . 48
LIST OF TABLES
Table 3.1 Classification Performance . . . 17
LIST OF FIGURES
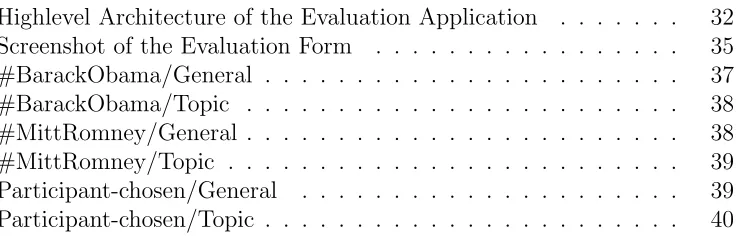
Figure 5.1 Highlevel Architecture of the Evaluation Application . . . 32
Figure 5.2 Screenshot of the Evaluation Form . . . 35
Figure 5.3 #BarackObama/General . . . 37
Figure 5.4 #BarackObama/Topic . . . 38
Figure 5.5 #MittRomney/General . . . 38
Figure 5.6 #MittRomney/Topic . . . 39
Figure 5.7 Participant-chosen/General . . . 39
Chapter 1
Introduction
Traditionally, a few decades ago, news and information about events would be available
from a few sources, such as television news channels and radios. With the upsurge of use
of social networks in the past ten years or so, data is available on a real-time basis in
enormous amounts on platforms represented by Twitter, Facebook, and a variety of
oth-ers. If the statement “information is wealth” is to be accurate, this overwhelming amount
of data must be processed and converted into useful, precise, and relevant information
that people can use to gain insight and understanding of different issues.
The focus of the research described in this thesis is micro blogs; we begin by discussing
the reasons for summarizing micro blogs.
1.1
Twitter is a social network where a user can post details or comments about a topic of
these tweets may also include URLs pointing to different articles and hashtags that act
as meta data about the tweet itself. One can mention a user by using a @ sign before
the username of a Twitter user in the post. Twitter users can reply to tweets. Popular
tweets can be tweeted again by the followers of the original user; these are retweets. A follower is a Twitter user who has subscribed to receive another’s tweets.
Twitter has half a billion user accounts around 140 million active monthly users and
its users send 340 million tweets every day [17]. It is being used massively to post content
on the Web by users ranging from politicians to pop stars; users can voice their opinions,
support different causes, or simply write about their current thoughts.
Twitter has become the strong social medium. Users have reacted to catastrophes
like the Haiti earthquake and the nuclear disaster in Japan, to spread information about
the news and even to assist in rescue attempts. Twitter has been used as a loosely
bound collaboration medium for people who help during these calamities. Twitter has
also helped in organizing mass movements like the Arab spring. In sports like football,
hockey, and basketball, fans tweet live updates about the game: comments, opinions,
and emotions. Twitter is a rich source of information about a variety of different social
domains.
An average Twitter user follows 126 people. Only 40% of Twitter users are frequent
tweeters. Most Twitter users don’t actually tweet; they are still active on Twitter,
how-ever, as they regularly check Twitter for updates about the their favorite politicians,
celebrities, sports teams, corporations, etc. The most famous Twitter users are content
generators, with numerous followers. President Barack Obama has more than 14.5 million
followers on Twitter. Lady Gaga has more than 23.5 million followers. President Barack
Obama’s account sends out around ten to twelve tweets per day. If the average Twitter
This requires a significant amount of time. Further, tweets about the same topic often
get repeated and paraphrased, and a user has to waste time in reading through them.
Time could be saved by recognizing the core topics of a set of tweets and summarizing
them for users. In general, summarizing the tweets of a user can help convey to others
more concisely what the user is tweeting about.
From a different perspective, the large amount of data generated by Twitter provides
a rich source for researchers in information retrieval and social media. Twitter offers
easy-to-use RESTful APIs to obtain the tweets of any public user or to search for tweets.
Researchers are working on this data to generate useful information from them.
Tweets have been used in varied contexts to provide “summarized information”.
Nichols et al. [9] have worked on generating a textual summary of soccer using the
tweets from Twitter. Chakrabarti and Punera [4] have presented highlights or important
subevents as a summary of structured, time-constrained events. Sakaki et al. [13] have
used Twitter data to identify the occurrence and time of earthquakes and the trajectories
of typhoons.
Our approach is slightly different from past work, in summarizing the tweets of a
single user. Our goal with this work is to provide an idea of the a given user’s interests
and some insight into the kind of content the user usually puts on Twitter.
1.2
Goals
Summarizing the tweets of a user has many uses. If the user tweets about the same topic
often, then a summary can avoid repetition when the information is presented to the
user’s followers. It can save time that would be otherwise needed to go through all the
understand the topics the user generally tweets about. This can assist others in making
decisions about whether to follow a user or not. For a given user, summarizing his own
tweets and looking at them in a time line could give him a better idea about what he has
tweeted about over that period and how his interests have changed. A summarization
technique for small sets of tweets should help an average Twitter user better cope with
the information overload.
This thesis attempts to accomplish the following:
1. To study and compare different algorithms used for summarizing micro blogs.
2. To explore supervised and unsupervised techniques to summarize micro blogs.
3. To test and validate our findings by building a system that summarizes micro blogs.
1.3
Contribution
Our work looks at a new problem, summarizing the tweets of a single user. We have
conducted a pilot study to understand human perception about summarizing the tweets
of a Twitter user. We have reviewed existing approaches for summarizing tweets and
micro blog posts in general. We have found that some plausible approaches that apply
to large amounts of data from many users cannot be used to summarize small sets of
micro blogs by a single user. We have explored supervised and unsupervised techniques
to summarize tweets, and have analyzed their performance on our summarization task.
In the remainder of this thesis we describe a modified version of the K-means clustering
algorithm and a technique to choose a representative tweet from a cluster of tweets based
on sentiment. The clustering algorithm is used to cluster tweets, it is flexible and can
have evaluated our algorithm with users and we provide a comparative analysis with a
competing baseline for summarization [4]. We also provide a statistical analysis of the
Chapter 2
Related Work
There has been considerable amount of work in the area of micro blog mining. Two basic
approaches to information processing in this area are classification, to identify relevant
information in tweets or to extract specific types of tweets from a large set, and clustering,
to identify related groups of tweets in a large set. Representative techniques and results
are discussed in this chapter.
2.1
Twitter Classification
Twitter classification is used as the first step in many different Twitter mining techniques.
It is used as an intelligent data cleaning method to remove unnecessary tweets from the
initial Twitter dataset. Sakaki et al. [13] use classification as an intelligent filter in their
technique of detecting the occurrence, time, and location of earthquakes and typhoons
by mining tweets. They describe a multi-step process to obtain this information. Their
first step is to classify the tweets into two classes: tweets pertaining to real earthquakes
classifier with different types of features including
Statistical features (number of words, position of query word).
Keyword features (word vector of the tweet).
Word context features (words before and after the query word).
In information retrieval, it is common to evaluate the performance of algorithms
using measures like precision, recall and F-value. Precision is defined as the fraction of
retrieved documents that are relevant to the search. High precision means most of the
retrieved documents are relevant. Recall is the fraction of relevant documents retrieved.
High recall means most of the relevant documents are retrieved. F-value is a statistics
which estimates a significance of variables participating discriminant efficiency. It can be
used to evaluate the usefulness of different features or sets of features for classification.
Their classifier performs well in detecting earthquake events when they use only
sta-tistical features, with an F-value of 73.69%. Its F-value is lower when the other types of
features are used: 53.85% and 57.14% for keyword features and word context features,
respectively.
This distinction in the predictive value of different types of features is also found in the
work of Sriram et al. [16]. They describe a technique for organizing tweets into different
top-level classes using a Naive Bayes classifier. The goal of their work is to classify sets of
tweets into generic classes, such as News, Opinions, Deals, Events, or Private Messages.
The best-performing classifier relies on eight features, one nominal and the remaining
binary, collectively called 8F:
2. presence of shortening of words and slang terms,
3. time/event phrases,
4. opinion words,
5. emphasis words,
6. currency and percentage signs,
7. @username at the beginning of the tweet, and
8. @username within the tweet.
The overall accuracy of 8F is around 95%. Because the model uses author information,
however, it will tend to be tuned to each user’s tweeting habits. This is the main drawback
of this approach; as such a trained model cannot be easily applied to tweets from new
users. The authors write, “The author feature is found to be very discriminative in our
dataset.” They also test their work against a Bag-of-Words (BOW) feature set, and find
that 8F improves performance by 32.1% over BOW. They concluded that statistically
computed features seem to perform significantly better than Bag of Words. Performance
of the combined 7F+BOW (7F is 8F with the author feature removed) falls between 8F
and BOW.
2.2
Twitter Summarization
A substantial amount of work has been done in exploring different techniques to
summa-rize tweets. The word “summary” has been used as a common term for any information
based on the context. The techniques of extracting summary too differ significantly based
on the context and application.
Chakrabarti and Punera [4] describe different approaches to summarize an American
football game. They aim to recognize all the sub-events in a game, such as touchdowns,
field goals, and so forth, using the tweets pertaining to the game. They evaluate three
different algorithms for this task.
The first algorithm is called SUMMALLTEXT. SUMMALLTEXT is based on
calcu-lating the Euclidean distance between word vectors of every pair of tweets and choosing
the one with (a) the smallest distance from all other tweets and (b) the highest distance
from already chosen tweets. This process is repeated for a specified number of times.
While appealing, this approach has some drawbacks. It gives too much importance to a
single major sub-event, and it cannot recognize two separate events of the same type,
such as two touchdowns at different times. Chakrabarti and Punera [4] take
SUMMALL-TEXT as the baseline for evaluating their other algorithms. To differentiate the events
better temporally they use an important parameter in summarizing a football game.
They divide the tweets into different time slots and apply the SUMMALLTEXT
algo-rithm. This results in temporally segregated set of sub-events. This variation is called
SUMMTIMEINT. It suffers mostly with the same problems as SUMMALLTEXT. Finally
they describe a variant of Hidden Markov Models (HMM) which recognizes the changes in
the language model over time better than the SUMMALLTEXT and SUMMTIMEINT.
This variant is called SUMMHMM.
In evaluation, the model was trained for American football games. The evaluation
shows that the average recall is just 0.5 when the top 30 tweets are extracted after the
SUMMHMM computation. SUMMHMM also has limitations. The models generated are
of event. The model mainly depends on bursts in tweet volume and changes in language
model over time. This makes the model usable only for events that have a structure
similar to sports, where there are defined important moments that correlate to bursts
in tweet volume. Recognizing sub-events is a difficult problem even when models can be
trained on existing data.
Nichols et al. [9] try to address the shortcomings of a trained model to recognize
sub-events and summarize them. To demonstrate their technique for summarizing sporting
events they use a running example of soccer. Apart from recognizing sub-events, they aim
to provide a set of sentences as summary of a soccer game. They use the burst in tweet
volume information to detect events like goals, yellow cards, and penalty shots. Each
burst in tweet volume is considered a sub-event. They detect the exact burst of tweets
and collect all the tweets from start of the burst to the end. These tweets are considered a
cluster. After noise removal, the topnsentences are chosen from each cluster and ranked
follwing a phrase graph approach [15].
One advantage of this approach is that the model is unsupervised, unlike other
ap-proaches used for summarizing tweets of an event. However, this model relies on each
burst of tweets corresponding to one event. This may not hold true if two important
events occur in quick succession. Quick succession of events are not uncommon in some
sports like American football. Chakrabarti and Punera [4] report that in their dataset
of American football games, 45% of the interception plays are followed by field goals or
touchdown plays. They also cite this as a reason for some performance drop in there
SUMMHMM approach.
Nichols et al. [9] evaluate their model on a soccer game, which has relatively low
number of events; generally the events for a soccer game are also well spaced out in time,
ranging from 0.6 to 0.9 and precision around 0.9 for the soccer games they evaluate. This
is a promising result, considering the difficulty of the problem.
Searching Twitter for real-time information is an important application. Query
phrase-based summarization techniques have been explored for providing good search results.
O’Connor et al. [10] describe a system to summarize the search results for a given term
from Twitter. When a user enters a keyword, the output will be a clustered sets of tweets
identifying the different subtopics about the keyword. O’Connor et al. [10] use a series
of steps to identify these subtopics. They can be either unigrams, bigrams or trigrams.
These are terms for 1,2 and 3 contiguous sequence of words respectively . In the first step
they tokenize and filter the words. In the next step they calculate the importance of each
token using the probability of occurrence in the result subset and general tweet corpus.
Then they merge similar topics using the Jaccard coefficient of similarity between the
n-grams. Jaccard’s coefficient is calculated as the size of intersection of the sample sets
divided by size of union of the sample sets. They remove near duplicate tweets by looking
at trigrams.
This approach is interesting works well in extracting subtopics from a given topic.
However, it relies heavily on the tokenizer and probability of occurrence of words. This
can lead to unimportant but frequently used words being chosen as the topics in users’
tweets. It is common for a particular user to use similar words that do not represent a sub
topic. Words like “president” or “POTUS” (an abbreviation for “President of The United
States”) are used extensively in President Barack Obama’s Twitter feed, for example.
With this algorithm, these words would be recognized as the main topics of clusters,
which is inappropriate.
A very well known approach to summarizing tweets based on query words is described
search results for a query phrase on Twitter. The PR algorithm begins by creating a
phrase graph of all the tweets obtained with the query phrase as the root node. Phrase
graphs are a way to represent the common sequences of words that occur adjacent to
the query phrase. The graph represents all the tweets used to create the phrase graph.
Each word is represented by a node and an associated count that indicates how many
times the nodes word occurs within the set of input tweets. If we traverse a tweet in the
phrase graph then we can add up the weight on each word of that tweet to calculate the
total weight of the tweet. The highest weighted tweet is as the partial summary. This
technique could be used to summarize clusters of tweets that belong to a related event.
However, this technique is not suitable for summarizing clusters formed by the tweets
of a single user. It can happen that the same sets of words are not used adjacent to
the topic phrase. For example, a topic like “health care”’, which appears in President
Obama’s tweets, shows that the context is sometimes women’s health but other times it
Chapter 3
Preliminary Development
There are different approaches to summarizing micro blogs. In this chapter we walk
through the process we developed, through exploration of different techniques. Our first
attempts were based on a pilot study with 13 users. The study helped us understand how
users choose summaries from a given set of tweets.
Twitter provides an easy-to-use REST API for accessing user’s tweets. It also provides
REST API client bindings in different programming languages. This makes collecting data
from Twitter easy compared to other micro blog services such as Facebook.
We built a Web site where users entered the Twitter username of a person they
follow. They were shown the last 30 to 50 tweets of that person. The users then looked
through those tweets and chose what they considered a subset of representative tweets.
The website is a Ruby on Rails application which used a Redis key value store as the
data store. The data collection application can make calls to the Twitter API and get
the latest tweets by a particular Twitter user.
In all, 541 tweets were seen by the 13 users. They chose a total of 63 tweets from these
applied machine learning techniques in an attempt to distinguish representative tweets
from non-representative tweets, without specializing to specific Twitter users. This turned
out to be overly optimistic, but we believed it was an idea worth testing—it might have
been the case that those tweets people tend to consider important or representative can
be characterized in a simple way.
In the remainder of this chapter we describe data preparation and processing
neces-sary for this study. We then discuss two approaches to organizing tweets in our attempt
to match users’ choices. Broadly we can divide the approaches into supervised and
un-supervised learning methods. Different approaches are explained in this chapter, as a
description of the exploratory process we went through to identify the most effective
methods.
3.1
Data Preparation
The tweets collected through the Twitter API have to be pre-processed and cleaned
be-fore they can be utilized to compute features for classification or clustering. We exclude
retweets and replies by the user when we collect tweets from Twitter. In the data
prepa-ration phase, the tweets are pre-processed using the two techniques of stemming and
stopword removal.
Stemming is a process where different forms of a word are reduced to the original root
form. In our study, a standard Porter stemmer was used on all the words of the tweets.
Stopword removal is a technique where commonly used but relatively uninformative
English words are removed. In the pilot study, a stop word list in English is used to remove
articles, prepositions, conjunctions, and so forth. This process ensures that all our tweet
in most or all tweets. The stop word list used in our study is provided as Appendix B
of this document. Once the tweet data has been pre-processed and cleaned of noisy and
irrelevant words, it is ready to be processed.
3.2
Data Processing
We used the dataset of 541 tweets as the dataset to conduct our exploration. We have
seen that statistical features have been effective at classifying tweets [16] [13]. Using only
statistical features has the advantage of producing models with some generality, allowing
for use on different datasets.
We calculated a number of statistical features toward the goal of classifying tweets as
representative or non-representative. The set of features we chose for classifying tweets
include the following:
1. Number of Words in the tweet
2. Average length of words in a tweet
3. Maximum Inverse Document Frequency (IDF)
4. Position of the word with the Maximum IDF
5. Average IDF of the tweets
6. Sum of IDF of all the words in the tweet
7. Spelling correctness percentage of a tweet
9. Number of Hashtags in the tweet
The Inverse Document Frequency (IDF) is computed for each word of each tweet. IDF
is a commonly used statistical metric in information retrieval. It is helpful in indicating
whether a word is unique to a small set of documents or it is common across all documents.
It is obtained by dividing the total number of tweets by the number of tweets containing
the term, and then taking the logarithm of that quotient. Thus the IDF of a rare word
is high, while the IDF of a frequent word is likely to be low. We also compute Spelling
correctness for each word of each tweet. The aggregation of these values forms the features
for the dataset.
3.3
Classification
We created a comma separated values (CSV) file with all the tweets and the computed
features. We did not use features such as Username or Bag of Words, because these
would make the model specific to the dataset under consideration. We used Weka [8] to
run different classification algorithms. Weka is a machine learning software suite written
in Java. It has a GUI and a command line interface. With Weka, we explored several
classification and clustering algorithms.
We applied Support Vector Machine and Naive Bayes classification algorithms on our
data. A Support Vector Machine (SVM) [5] is a type of supervised learning technique
used for classification. An SVM is a binary classifier, classifying a given input into one of
two categories. Mathematically, the technique constructs a plane or set of
hyper-planes in a high-dimensional space. This hyper-plane marks the boundary between the
Table 3.1: Classification Performance
Algorithm Precision Recall F-Measure
Support Vector Machine 1 0.036 0.07
Naive Bayes 0.25 0.055 0.09
Naive Bayes [14] is a probabilistic classifier, unlike the SVM, based on Bayes’ theorem;
it makes strong assumptions about the independence of the features, giving it its name.
We applied these algorithms to classify our pilot study data. Table 3.1 shows the
results. We have recoded the F - Measure or F1 score for each algorithm. F - Measure is
the harmonic mean of precision and recall of the classification. It acts a good measure of
overall test accuracy.
Performance, unfortunately, is very poor. In the pilot study data, only about 10% of
the tweets are classified as representative; the rest are not representative. This imbalance
in the dataset produced classifiers that tended to be little different from majority-element
classifiers.
We tried a variety of other algorithms, including J48. J48 is a Java implementation
of the algorithm C4.5[12] for creating decision trees. This algorithm uses the highest
normalized information gain among available attributes at each level to recursively split
a dataset, with the result being a tree. J48 decision trees had an F-Measure of 0 for
representative tweets.
We tried to balance the dataset by limiting the non-representative tweets to a 10%
3.4
Clustering
We could not achieve good performance using supervised learning techniques, and so we
turned to other approaches. Unsupervised techniques are very flexible. For an
unsuper-vised technique we can use the bag of words and derived properties as parameters.
Our first approach was to use bag of words as the feature set for clustering. We applied
Expectation Maximization (EM) [7] and the X-means [11] algorithm on the feature set.
Euclidean distance was used as the distance metric between two tweets. Expectation
Maximization is a clustering algorithm that tries to model the observed data as a mixture
of Gaussian distributions. The algorithm has two main steps, the Expectation Step and
the Maximization Step. These are run iteratively till they converge. In the Expectation
step the algorithm computes the probability of a tweet being in each cluster. This is done
by using log likelihood of each element attribute in comparison with the attributes of the
other elements of the cluster. The next step is the Maximization step. In this step the
parameters of the hidden Gaussian probability distributions are calculated. The algorithm
uses a convergence test based on maximum likelihood estimation. An advantage of EM
clustering is that it generates clusters without requiring the number of clusters to be
provided in advance.
X-means is a splitting version of the K-means algorithm that, like EM clustering,
does not need an initial input giving the number of clusters to be formed. At each step in
X-means a cluster is split into two smaller clusters. After the split, Bayesian Information
Criterion (BIC) scoring is used to determine whether the split into two clusters provides
a higher score than the original single cluster. Splitting continues until all the clusters
obtained produce a lower BIC score if split; at that point X-means has converged.
problematic. Unrelated tweets also were clustered together, as judged by ourselves. In
order to solve these problems we realized that we might get better performance if we did
not use all the words in a tweet as features.
We tagged each word of each tweet with a “part of speech” tag. We used the Stanford
core NLP[6] Ruby bindings for the part of speech tagger. We also assigned a real number
indicating the sentiment value of each word, for reasons discussed below. We applied a
filter on the features such that only nouns and verbs were chosen to be part of the word
vector. This helped in reducing the unrelated tweets being clustered together. However,
only a few clusters were still generated, because the number of clusters generated in
both X-means and EM depends on maximum log likelihood estimation. This resulted in
generating very few clusters as the log likelihood of many clusters did not turn out to be
maximum in our case. Examples of summaries formed using X-means and EM clusters
are provided in the Appendix A.
As an example, consider the application of these algorithms to 52 tweets of President
Barack Obama. These tweets are provided as Appendix A.
Example of user chosen tweets for #BarackObama
1. Former President Bill Clinton on President Obamas decision to authorize the
op-eration that killed Osama bin Laden: http://t.co/RByxji1W
2. Just one of the many ways President Obama is making college more affordable:
http://t.co/faRrZqmL Watch live: President Obama speaks to troops, veterans,
and military families at Fort Stewart in Georgia. http://t.co/mm4eGrZJ
3. Big news: The President and First Lady are holding the first rallies of the campaign
4. Watch live: President Obama speaks in Iowa about preventing interest rates on
student loans from doubling. http://t.co/RCeSQdVf
5. Watch live: President Obama speaks in Colorado about preventing a student loan
interest rate hike. http://t.co/mm4eGrZJ #DontDoubleMyRate
6. George Clooney is hosting President Obama in May. You’re invitedand we’ll cover
airfare: http://t.co/0KI2ByNx
7. Stand with President Obamatell Congress not to double interest rates on student
loans: http://t.co/CKCuNMRj #DontDoubleMyRate”]
Result of X-means clustering and the highest sentiment tweet from each cluster as
the summary tweet for #BarackObama. X-means produces only two clusters. One of
the clusters has just one tweet so it is ignored. X-means, followed by selection based on
sentiment, produces this single tweet:
1. VPOTUS: “We’ve taken more terrorists off the battlefield in the last 3 years than
in the previous 8, putting al-Qaeda on a path to defeat.”
EM clustering produced three clusters for the same 52 tweets of #BarackObama, A
sentiment based selection of tweets from these clusters resulted in the following output:
1. Watch live: President Obama speaks in Colorado about preventing a student loan
interest rate hike. http://t.co/mm4eGrZJ #DontDoubleMyRate
2. Mitt Romney’s at odds with Mitt Romney againthis time students are the ones
who’d suffer: http://t.co/YXbQE5ek h/t @TruthTeam2012
3. Congress needs to act right now to prevent interest rates on federal students loans
In conclusion from our preliminary development we learnt that, Classification
can-not be used to choose representative tweets directly from the input tweets. X-Means
and EM clustering algorithms create few broad clusters. This results in producing small
summaries. Users generally prefer around 10% of the input tweets to be part of the
sum-mary. In our next chapter we discuss an algorithm that overcomes the limitations of the
X-Means and EM, this algorithm creates more granular clusters, Granularity of clusters
can be controlled by the user in this algorithm. We explore methods to choose a
repre-sentative tweet from each cluster to form the summary. We describe a sentiment based
Chapter 4
System Development
We learned enough during our exploration to identify a plausible approach to extracting
summary tweets from a small set of tweets. The process involves three steps.
1. Access the micro blogs and compute different features of the data.
2. Group the tweets into clusters.
3. Choose a summary tweet from each cluster.
In this chapter we discuss the approaches we have taken to complete all the three
steps.
4.1
Computing Features
In this step all tweets are converted to word vectors of a fixed size. First we convert each
tweet to lower case. Then stemming and stop word removal is done. This new form of the
tweet is stored as a processed tweet. The processed tweet is used to compute the Inverse
tagged with a part of speech (POS) tagger. At the end of this step we have the processed
form of a tweet, and we have the IDF values and the POS tags for each word. The next
step is to filter the words from the processed tweet. We filter out all the words which are
not tagged as nouns or verbs. This helps in making sure only important words are used
as candidates for topics. Then we sort them based on IDF. Lower IDF means the word
has been used many times in set of tweets hence is a good candidate for clustering. The
top n words from the sorted array are considered as the feature vector. The numbern is
specified by the algorithm.
4.2
Clustering Algorithm
Each tweet is a feature vector (which we will also call a point, for the purposes of
ex-plaining the algorithm). The set of points is an input to the clustering algorithm. Our
clustering algorithm is a modified version of K-means clustering algorithm. We call it
MK-means. The K-means clustering algorithm is a simple clustering algorithm which
takes takes two inputs, number of clusters to be formed and the input points. It returns
the clusters. In the first iteration of MK-means, the input set of feature vectors is split
into two clusters. If these clusters have a size less than a threshold value then they are
added to the final clusters list. If the size of the cluster is bigger than the threshold value
then they are added back to the pool of points to be clustered. The threshold number for
size of a cluster to be accepted as a final cluster acts as a way to control granularity of the
cluster. If i clusters are output after a certain iteration and all have a size greater than
the threshold value, then in the next iteration we try to split the points intoi+ 1 clusters.
This takes care of the border condition in the algorithm. It also causes the iterations to
vector are the same among a set of tweets. Clustering algorithm might will be stuck in a
infinite loop. We try to break this by adding the ’n+1th’ word to the feature vector.
For our task, Modified K-means (MK-means) has advantages over the algorithms
described in the previous chapter. The most important advantage in the context of
sum-marizing tweets is that it gives the user an easy way to understand and control the
granularity of the summary returned. The threshold size for a cluster can be controlled
by the user as it easy to understand its function. The threshold size of a cluster is inversely
proportional to the number of tweets in the summary. This is because if the threshold
is higher then there will be less clusters output by the algorithm there by reducing the
number of clusters in the summary and vice versa.
Listing 4.1: Distance calculation between tweets
def d i s t a n c e m e a s u r e ( f v 1 , f v 2 , p a r a m s l e n g t h ) f v 1 = f v 1 [ 0 . . p a r a m s l e n g t h−1]
f v 2 = f v 2 [ 0 . . p a r a m s l e n g t h−1]
temp = Hash . new
f o r word in f v 1 temp [ word ] = true end
matches = 0
f o r word in f v 2
i f temp [ word ] == true matches += 1
end end
return p a r a m s l e n g t h − matches end
the K-means algorithm used in our algoithm are discussed here. The K-means algorithm
used in the Listing 4.2 is not randomly initialized but chooses equally spaced points as
its centers for the first iteration. This helps in getting consistent results. The K-means
algorithm uses a custom defined distance measure in our implementation. The distance
between two feature vectors is calculated in a simple way. The distance function as shown
in Listing 4.1 takes three inputs, the two feature vectors and parameter length. The third
argument is used to decide how many words from the feature vector are considered for
calculation of the distance. Our distance function ensures we can find distance between
two feature vectors which have only nominal values easily. The output is the distance
between the two feature vectors.
Listing 4.2: Modified K-means Algorithm in Ruby
def MKmeans( a l l p o i n t s , f i r s t s p l i t , p a r a m s l e n g t h , t h r e s h o l d c l u s t e r s i z e ) i = f i r s t s p l i t #Number o f C l u s t e r s t o s p l i t i n t o
while ! a l l p o i n t s . empty ? #While A l l P o i n t s i s n o t Empty c l u s t e r s = K−means ( a l l p o i n t s , i , p a r a m s l e n g t h )
f l a g = 0
a l l p o i n t s = Array . new
f o r c l u s t e r in c l u s t e r s
i f c l u s t e r . s i z e <= t h r e s h o l d c l u s t e r s i z e f i n a l c l u s t e r s << c l u s t e r
f l a g = 1
e l s e
a l l p o i n t s += c l u s t e r . p o i n t s
end end
e l s e
p a r a m s l e n g t h += 1
end end end
4.3
Cluster Summary
Clustering the tweets based on words which are either nouns or verbs means these words
together describe or represent a topic. All the tweets in a cluster share a few or all of
these words, hence all the tweets in a cluster belong to the same topic. Each cluster
created during the clustering process represents a topic; thus it is meaningful to choose
one tweet from each cluster as the summary tweet. Collectively they will be representing
the different topics from the input. We explored a few ways to choose one sentence from
each cluster.
The first approach was to choose the cluster center as the most representative tweet.
This ensured that the words that describe the topic are included in the tweet. When
we tried this out on data from a few Twitter users, we saw that clusters centers often
tend to be tweets with small number of words. Such tweets do not provide very much
information apart from the topic itself. Our second approach, to address this problem,
was to pick the tweet with the highest number of words. In this case, we returned to our
pilot data but discovered that users often do not choose such tweets in their summaries.
This led us to the final approach, which is based on sentiment. We calculated sentiment
of a tweet as the sum of absolute value of sentiment of each word in the tweet. Then we
user choices for summarization in our pilot data.
This completes the system description. To summarize we calculate feature vector for
each tweet based on the IDF and sentiment values of each word of the tweet. The feature
vectors are clustered using a MK-means algorithm. Each cluster represents a granular
topic. We choose a tweet from each cluster based on sentiment to form the summary
Chapter 5
Evaluation
We have tried many approaches to summarize micro blogs. We have also described a
modified version of K-means which we think can summarize tweets better. We have
eval-uated the performance of our Modified K-means algorithm against a published algorithm
called SUMMALLTEXT, or SAT [4], as discussed earlier. We have built a Web
applica-tion which can interface with the different components needed to do the evaluaapplica-tion.
In this chapter we describe the evaluation application, an experiment testing our
approach, and results.
5.1
Experiment Hypotheses
Our work with the algorithms described in the previous two chapters convinced us that
summarizing tweets of a single Twitter user is much more challenging than we had
first believed. Our initial goal, when starting this project, was to produce summaries
equivalent in quality to those generated by humans. Unfortunately, we did not believe
we have made progress toward this goal.
Chakrabarti and Punera [4] used a clustering algorithm based on SUMMALLTEXT as
the baseline for evaluating their other algorithms, in the context of identifying relevant
tweets about events in football games. The more refined algorithms that Chakrabarti
and Punera [4] developed are inappropriate for our purposes, in that they depend on a
temporal ordering of tweet data, which we ignore.
We can use SUMMALLTEXT as a baseline for comparison with our MK-means
al-gorithm. We pose two simple hypotheses:
For a given set of tweets from a single Twitter user, human judges will rate
summaries produce MK-means as being better in general than summaries
produced by SUMMALLTEXT, and that MK-means summaries will have
better topic coverage than SUMMALLTEXT summaries.
In other words, the first hypothesis concerns whether there is a significant effect of
Algorithm (MK-means or SUMMALLTEXT) on the general quality of summaries; the
second hypothesis concerns the effect of Algorithm on the topic coverage of summaries.
We use slight modifications of SUMMALLTEXT as originally described. We use IDF
instead of TF-IDF for our implementation, because TF (term frequency) doesn’t have
significance for tweets–they are made up of very few words. We also use Euclidean
dis-tance for SUMMALLTEXT instead of the original cosine disdis-tance. For consistency with
MK-means, processed tweets (after stemming and stop word removal) are used in the
implementation. The first step of the SUMMALLTEXT algorithm is to create word
vec-tors for each tweet. The next step is to compute, for each tweet, the sum of distances
with all other tweets in the input. Then the input tweets are sorted in this order. The
most important topic. Then the tweet with the least distance from the chosen summary
tweets is computed. The first tweet in the sorted list that has the smallest distance from
chosen summary tweets is added to the summary tweets. This is iterated until 10% of
the input tweets are chosen as the summary tweets. The reason we choose 10% of the
tweets is that we observed in our pilot study discussed in chapter 3 that on an average
11.6% of the tweets were chosen as summary tweets. We rounded this to 10%.
MK-means as described in chapter 4 is a modified version of K-means. The algorithm
splits the input tweets into two clusters. A cluster is accepted if it has a size less than
a given threshold size. If not then the cluster is split again in the next iteration. The
algorithm converges when all the input tweets are clustered into clusters of a size smaller
than the threshold size. To choose a tweet from the cluster we used the sentiment based
approach described in the chapter 4
We have included the results of MK-means and SUMMALLTEXT for #BarackObama
below, for illustration.
Results of MK-means for #BarackObama
1. Mitt Romney’s at odds with Mitt Romney againthis time students are the ones
whod suffer: http://t.co/YXbQE5ek h/t @TruthTeam2012
2. Stand with the Presidenttell your members of Congress not to price the middle
class out of college: http://t.co/AOx8F2hx #DontDoubleMyRate
3. Fly to California with a +1 to meet the President at George Clooneys houseit’s a
once-in-a-lifetime sort of thing: http://t.co/KDqiXx1d
4. Congress needs to act right now to prevent interest rates on federal students loans
5. Watch live: President Obama speaks in Colorado about preventing a student loan
interest rate hike. http://t.co/mm4eGrZJ #DontDoubleMyRate
6. The Voter Registration Weekend of Action is getting started right now. Find an
event near you: http://t.co/BOIAK7iP #RegtoVote
7. Watch live: President Obama speaks to troops, veterans, and military families at
Fort Stewart in Georgia. http://t.co/mm4eGrZJ
8. Romney claims to support keeping student loan rates lowyet backs a budget that
doubles them: http://t.co/kCJyr7on #DontDoubleMyRate
Results of SUMMALLTEXT for #BarackObama
1. Just one of the many ways President Obama is making college more affordable:
http://t.co/faRrZqmL
2. Chrysler posts its best quarterly profit in 13 years: Not bad for a company that
almost died 3 years ago. http://t.co/tNagcuIy #progress
3. The Presidents American Opportunity Tax Credit worth up to $10000 over 4 years
helps middle class families send kids to college. #progress
4. POTUS: If you do well the economy does well. This is about the economy. You are
the economy. #DontDoubleMyRate
5. VPOTUS: Weve taken more terrorists off the battlefield in the last 3 years than in
the previous 8 putting al-Qaeda on a path to defeat.
5.2
Experiment Setup
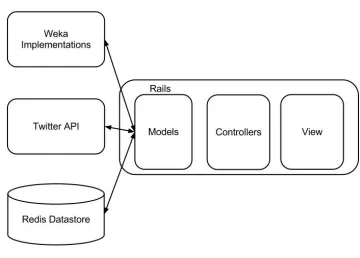
The evaluation application is based on the Ruby on Rails framework. It is connected to
a Redis key value store as shown in Figure 5.1. This store acts as the data source for
this application. Using a key value store like Redis provides flexibility when compared
to regular relational databases. The application is designed to access tweets from three
different sources. The first source is directly through the Twitter API. The second source
is the Redis data store. The third data source is plain text files. Once a set of tweets is
extracted from Twitter they are stored in Redis too for future use. This reduces the time
lag in fetching data. It also helps in serving the same set of tweets to different users for
different opinions about a summary.
We used Ruby libraries which implement stemming and stopword removal to process
the tweets. We used a Porter stemmer for stemming words. The list of stop words used for
evaluation application is attached in Appendix B. After stemming and stopword removal
the processed tweet is formed. Then we used the Ruby TF-IDF library to calculate the
IDF of each word. We used the Ruby bindings to the Stanford core natural language
processing packages for parts of speech tagging.
The different clustering algorithms are the most important components of the
evalu-ation applicevalu-ation. We implemented two of the clustering algorithms as described earlier:
SUMMALLTEXT and MK-means.
5.3
Experiment Design
To compare the summarization algorithms, we identified two datasets, based on our
experience and testing with Barack Obama’s Twitter stream. One was #BarackObama,
the other #MittRomney. These sets of tweets would be treated independently.
We invited twelve participants to take part in the experiment. Each participant would
look at the set of tweets (between 30 and 50) and choose, by hand, a representative
subset of those tweets. The partipant would then look at a computer-generated summary
and give that summary two ratings: one on its general quality, and one on its topic
coverage. Participants were also asked what might be improved in the computer-generated
summary. That is,
1. “Consider your summary as receiving 5 points out of 5. How you rate this new
summary, on a scale of 1 to 5?”
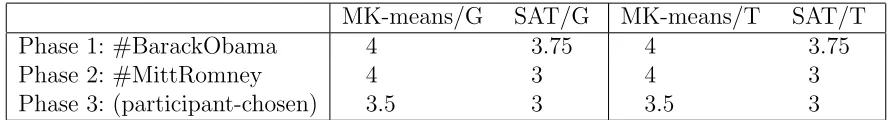
Table 5.1: Medians
MK-means/G SAT/G MK-means/T SAT/T
Phase 1: #BarackObama 4 3.75 4 3.75
Phase 2: #MittRomney 4 3 4 3
Phase 3: (participant-chosen) 3.5 3 3.5 3
you rate the topic coverage of this new summary, on a scale of 1 to 5?”
3. “What should be added or removed to improve the summary?”
Each participant considered summaries produced by both MK-means and
SUM-MALLTEXT, with the order of presentation differing across participants. Each
partic-ipant considered sets of tweets by #BarackObama and by #MittRomney, as well as a
third set from their own choice of Twitter user. A screen shot of the interface is shown
in Figure 5.2.
5.4
Experiment Findings
We treat the three phases of the experiment as being independent. User ratings are
discrete-valued data, which means that some common types of summary and inferential
statistics used for continuous data are inappropriate. We adopt the conventions of HCI
research in handling Likert scale data, using the median rather than the means as a
measure of central tendency, and using non-parametric tests for comparisons.
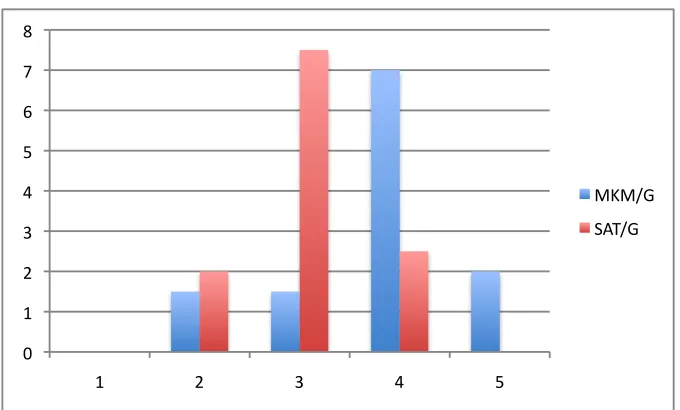
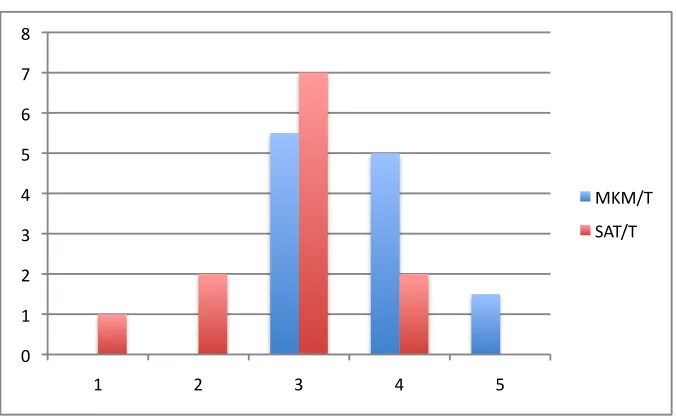
Bar charts of the MK-means and SUMMALLTEXT summaries for each of the three
experiments are shown in Figures 5.3, 5.4, 5.5, 5.6, and 5.7; SUMMALLTEXT is
The summaries in Table 5.1 suggest that MK-means outperforms SUMMALLTEXT
for all of the datasets. We can go further by analyzing the differences between the ratings
of two summaries of a specific Twitter user, per experiment participant.
We use a Wilcoxon signed-rank test for comparing medians: MK-means versus
SUM-MALLTEXT for the general quality condition, and MK-means versus SUMSUM-MALLTEXT
for the topic coverage condition. The non-parametric Wilcoxon test is designed for
con-tinuous data but is applied in practice to discrete ordinal data as well.
For the #BarackObama dataset, a Wilcoxon test shows no significant effect of
Algo-rithm in the general quality condition (W = 12.0, p= 0.12), and similarly no significant
effect in the topic coverage condition (W = 11.0, p = 0.18). This was somewhat
sur-prising to us; much of our exploration dealt with tweets from #BarackObama, and we
had expected that in an experiment our own judgments about the quality of MK-means
summaries would be confirmed. This was not the case. The MK-means median is not
significantly greater than the SUMMALLTEXT median, in either condition.
For the #MittRomney dataset, a Wilcoxon test shows that there is a significant
effect of Algorithm in both the General condition (W = 27.5, p= 0.009) and the Topic
condition (W = 25.5, p= 0.01).
For the dataset including participant-chosen Twitter users, a Wilcoxon test shows that
there is a significant effect of Algorithm in both the General condition (W = 20.0, p =
0.024) and the Topic condition (W = 17.0, p= 0.008). This suggests that the approach
we have taken has some potential for generality. Table 5.2 lists the Twitter users, who
span some range.
Alternative tests, for which the user ratings are encoded in categorical form, show
comparable results. For example, we can reduce the ratings into three categories, in
Table 5.2: Participant-chosen Twitter users, with descriptions
Twitter user Web page description
andersoncooper Personal tweets by Anderson Cooper. Anchor of @AC360, weeknights at 8p/ET & 10p/ET on @CNN and daytime talk show host of @Anderson, airing weekdays.
bhogleharsha (2) once upon a time a chem engr and mgmt grad,now cricket and motivational speaking my calling!
chetan bhagat The CB family! iamsrk (2)
rameshsrivats Armchair thinker, excessive drinker, occasional writer, wants to be lighter.
sachin rt (2) Proud Indian
sardesairajdeep Rajdeep Sardesai is editor in chief IBN network. When not chained to the news, he watches cricket, reads books and enjoys family holidays.
sriistan Grad Student @ NC State|Software, Social Nwk, Shah Rukh!
| Friends,Family, Fun,Food n Fashion |
YUVSTRONG12 Cricketer, Celebrity, Entrepreneur, budding Philanthropist aka Yuvi
0 1 2 3 4 5 6 7 8
1 2 3 4 5
MKM/G SAT/G
0 1 2 3 4 5 6 7 8
1 2 3 4 5
MKM/T SAT/T
Figure 5.4: #BarackObama/Topic
0 1 2 3 4 5 6 7 8
1 2 3 4 5
MKM/G SAT/G
0 1 2 3 4 5 6 7 8
1 2 3 4 5
MKM/T SAT/T
Figure 5.6: #MittRomney/Topic
0 1 2 3 4 5 6 7 8
1 2 3 4 5
MKM/G SAT/G
0 1 2 3 4 5 6 7 8
1 2 3 4 5
MKM/T SAT/T
Figure 5.8: Participant-chosen/Topic
> SUMMALLTEXT. A χ2 test can then be used to test the hypothesis that the
prob-ability of MK-means < SUMMALLTEXT is equal to the probability of MK-means >
Chapter 6
Conclusion
In this chapter we discuss the features of modified K-means algorithm. We discuss the
advantages and disadvantages of the algorithm. We also discuss some of the improvements
that are possible. There are different opportunities to pursue in our work. We discuss
about them in the future work section.
6.1
Modified K-means Discussion
Modified K-means algorithm has a worst case time complexity of O(KN3) where N3
comes from the K-means calls and ’K’ will be the number of clusters formed by the
algorithm. This can be greatly reduced to almost just N2 using memoization. We can
reduce a lot of computations by storing the results of distance between all possible pairs
of tweets.
MK-means is a very flexible algorithm. It can be customized to different scenarios
by changing the different parameters passed to it. We see that granularity of clusters
we havent formally tested this behavior. The number of words to consider in the feature
vector depends on the length of the micro blog posts. Based on inspection in our case
starting with three words from the feature vector gives good results for clustering tweets.
Tweets have a maximum size limit of 140 characters. If the character limit is more than
140, It should still be possible to use the same algorithm by changing the number of
words to be considered to start with in the feature vector.
6.2
Future Work
All three steps of our system can be improved in different ways. The computation of
features can be improved by adding more features like named entity recognition. This
information could be useful when we try to choose words for the word vector and while
finding distance between two vectors. We have used the dictionary approach for
calculat-ing sentiment for tweets. This approach is found to be better than uscalculat-ing complex machine
learning approaches according to Bollen et al. [2] for calculating sentiment. However since
sentiment is so central to our approach it would be interesting to try other approaches
to calculate sentiment. We could calculate the distance between words better than direct
text matching if we used word net distance measures discussed in Budanitsky and Hirst
[3].
MK-means clustering generates many single tweet clusters. These are ignored in our
implementation. Some users felt that these should be included too. This customization
could be added to the MK-means algorithm. It is possible to recognize clear outliers in
the input tweets. These outliers will form single tweet clusters which will be ignored. We
could make the algorithms faster by performing a preliminary check for these outliers
Choosing a summary from a cluster can be done in many ways. We tried to separate
the tasks between the computer and the user in our approach. We found that it would be
good to provide a set of summary tweets and assist the user to create a textual summary.
There are techniques to create textual summary from similar sentences [1]. It would be
interesting to to compare how textual summaries generated by algorithms compare with
textual summaries created by users. We could improve the sentiment based technique for
choosing a tweet from a cluster with ideas from phrase graphs as described by Sharifi
REFERENCES
[1] Regina Barzilay, Kathleen R. McKeown, and Michael Elhadad. Information fusion in the context of multi-document summarization. In Proceedings of the 37th an-nual meeting of the Association for Computational Linguistics on Computational Linguistics, ACL ’99, pages 550–557, Stroudsburg, PA, USA, 1999. Association for Computational Linguistics. ISBN 1-55860-609-3. doi: 10.3115/1034678.1034760.
URL http://dx.doi.org/10.3115/1034678.1034760.
[2] Johan Bollen, Alberto Pepe, and Huina Mao. Modeling public mood and emotion: Twitter sentiment and socio-economic phenomena. CoRR, abs/0911.1583, 2009. [3] Alexander Budanitsky and Graeme Hirst. Evaluating wordnet-based measures of
lexical semantic relatedness. Comput. Linguist., 32(1):13–47, March 2006. ISSN 0891-2017. doi: 10.1162/coli.2006.32.1.13. URL http://dx.doi.org/10.1162/ coli.2006.32.1.13.
[4] Deepayan Chakrabarti and Kunal Punera. Event summarization using tweets. In
ICWSM, 2011.
[5] Rong-En Fan, Pai-Hsuen Chen, and Chih-Jen Lin. Working set selection using second order information for training support vector machines. J. Mach. Learn. Res., 6:1889–1918, December 2005. ISSN 1532-4435. URL http://dl.acm.org/ citation.cfm?id=1046920.1194907.
[6] The Stanford Natural Language Processing Group. A suite of core nlp tools. URL http://nlp.stanford.edu/software/corenlp.shtml.
[7] Ujjwal Das Gupta, Vinay Menon, and Uday Babbar. Detecting the number of clusters during expectation-maximization clustering using information criterion. In Proceedings of the 2010 Second International Conference on Machine Learning and Computing, ICMLC ’10, pages 169–173, Washington, DC, USA, 2010. IEEE Computer Society. ISBN 978-0-7695-3977-5. doi: 10.1109/ICMLC.2010.47. URL http://dx.doi.org.prox.lib.ncsu.edu/10.1109/ICMLC.2010.47.
[8] Mark Hall, Eibe Frank, Geoffrey Holmes, Bernhard Pfahringer, Peter Reutemann, and Ian H. Witten. The weka data mining software: an update. SIGKDD Explo-rations, 11(1):10–18, 2009.
User Interfaces, IUI ’12, pages 189–198, New York, NY, USA, 2012. ACM. ISBN 978-1-4503-1048-2. doi: 10.1145/2166966.2166999. URL http://doi.acm.org.prox. lib.ncsu.edu/10.1145/2166966.2166999.
[10] Brendan O’Connor, Michel Krieger, and David Ahn. Tweetmotif: Exploratory search and topic summarization for twitter. In ICWSM, 2010.
[11] Dan Pelleg and Andrew W. Moore. X-means: Extending k-means with efficient estimation of the number of clusters. InProceedings of the Seventeenth International Conference on Machine Learning, ICML ’00, pages 727–734, San Francisco, CA, USA, 2000. Morgan Kaufmann Publishers Inc. ISBN 1-55860-707-2. URL http: //dl.acm.org.prox.lib.ncsu.edu/citation.cfm?id=645529.657808.
[12] John Ross Quinlan. Improved use of continuous attributes in c4.5. Journal of Artificial Intelligence Research, 4:77–90, 1996.
[13] Takeshi Sakaki, Makoto Okazaki, and Yutaka Matsuo. Earthquake shakes twitter users: real-time event detection by social sensors. In Proceedings of the 19th inter-national conference on World wide web, WWW ’10, pages 851–860, New York, NY, USA, 2010. ACM. ISBN 978-1-60558-799-8. doi: 10.1145/1772690.1772777. URL http://doi.acm.org/10.1145/1772690.1772777.
[14] Karl-Michael Schneider. A comparison of event models for naive bayes anti-spam e-mail filtering. In Proceedings of the tenth conference on European chapter of the Association for Computational Linguistics - Volume 1, EACL ’03, pages 307–314, Stroudsburg, PA, USA, 2003. Association for Computational Linguistics. ISBN 1-333-56789-0. doi: 10.3115/1067807.1067848. URL http://dx.doi.org/10.3115/ 1067807.1067848.
[15] Beaux Sharifi, Mark-Anthony Hutton, and Jugal Kalita. Summarizing microblogs automatically. In Human Language Technologies: The 2010 Annual Conference of the North American Chapter of the Association for Computational Linguistics, HLT ’10, pages 685–688, Stroudsburg, PA, USA, 2010. Association for Computational Linguistics. ISBN 1-932432-65-5. URL http://dl.acm.org/citation.cfm?id= 1857999.1858099.
Appendix A
Dataset: Tweets of #BarackObama
Here is a list of all the tweets we have provided as input to our system to compute the
summary tweets
1. President Obama had some fun at the White House Correspondents’ Dinner last
night: http://t.co/SV9imzeB
2. George Clooney is inviting you into his home to meet the President. Travel’s
cov-erednow you just need to enter: http://t.co/Wvll06t2
3. Watch live: President Obama speaks at the White House Correspondents’
Associ-ation Dinner. http://t.co/HXttOyjM
4. President Obama: Women across America aren’t closing their eyes.
http://t.co/woqKQaWl
5. As a #SumOrg12 fellow, youll shape the outcome of this election by organizing
folks in your community. Apply now: http://t.co/mt8RqJkX
7. There are a lot of ways to support the President. This one is particularly creative:
http://t.co/8TJknCVl #RunwayToWin
8. ”When our men and women in uniform succeed, our country succeeds. They have
our backnow its our turn to have theirs.” http://t.co/EsCQDoHO
9. The Voter Registration Weekend of Action is getting started right now. Find an
event near you: http://t.co/BOIAK7iP #RegtoVote
10. This campaign is about to changebe there when it does. Enter Backstage with
Barack: http://t.co/7tsXXDsQ
11. Former President Bill Clinton on President Obamas decision to authorize the
op-eration that killed Osama bin Laden: http://t.co/RByxji1W
12. Mitt Romney’s at odds with Mitt Romney againthis time students are the ones
whod suffer: http://t.co/YXbQE5ek h/t @TruthTeam2012
13. Just one of the many ways President Obama is making college more affordable:
http://t.co/faRrZqmL
14. While the other side is busy distorting the Presidents record, get the facts: #FF
@TruthTeam2012.
15. President Obama capped student loan payments at 10% of monthly incomehelping
1.6 million students afford their loans this year. #progress
16. He took the harder and the more honorable path. Former President Bill Clinton on
17. This is about making sure you succeed because when you succeed, our country
succeeds. POTUS on ending education scams targeting soldiers
18. Watch live: President Obama speaks to troops, veterans, and military families at
Fort Stewart in Georgia. http://t.co/mm4eGrZJ
19. This weekend, Obama supporters are teaming up for a nationwide voter registration
drive find out how to be part of it: http://t.co/KY8A56Ag
20. Organizing your community this summer could change your life and make all the
difference in November: http://t.co/Xu0mvYuk #SumOrg12
21. Its an invite to meet the President at George Clooneys house dont miss out:
http://t.co/uUB8P9Bm
22. Volunteering is a priority because I don’t see an alternative: It has to be President
Obama.”-Paul, http://t.co/QS775C27
23. President Obamas first campaign rallies are just 9 days away sign up to join him
backstage: http://t.co/QFNCJJzW #Obama2012
24. Chrysler posts its best quarterly profit in 13 years: ”Not bad for a company that
almost died 3 years ago.” http://t.co/tNagcuIy #progress
25. Mitt Romney abandons the facts (again) when it comes to the Presidents foreign
policy record: http://t.co/QsxTrzT0 (via @TruthTeam2012)
26. VPOTUS: Gov. Romney reflexively criticizes the Presidents policies, and almost in
27. VPOTUS: Weve taken more terrorists off the battlefield in the last 3 years than in
the previous 8, putting al-Qaeda on a path to defeat.
28. .@JoeBiden on President Obama: He set in motion a policy that ended the war in
Iraq responsibly.
29. The Presidents American Opportunity Tax Credit worth up to$10,000 over 4 years
helps middle-class families send kids to college. #progress
30. With the House expected to vote on interest rates tomorrow, tell Congress to keep
college affordable: http://t.co/vNB1cIHU #DontDoubleMyRate
31. Fly to California with a +1 to meet the President at George Clooneys house it’s a
once in a lifetime sort of thing: http://t.co/KDqiXx1d
32. You could join President Obama backstage at the first #Obama2012 rally by
sign-ing up here: http://t.co/VBIhqFvI
33. Big news: The President and First Lady are holding the first rallies of the campaign
on May 5 in Columbus, OH, and Richmond, VA.
34. Americans owe more debt on student loans than on credit cards. The impact for
your state if Congress doesn’t act: http://t.co/6yILHihS
35. President Obama doubled investments in Pell Grants to help an additional 3.7
million students afford college. #progress
36. Stand with the Presidenttell your members of Congress not to price the middle