UTLIZATION OF CANNY AND VELOCITY BUNCHING ALGORITHMS FOR MODELLING SHORELINE CHANGE
Maged Marghany and Mazlan Hashim Department of Remote Sensing,
Faculty of Geoinformation Science and Engineering Universiti Teknologi Malaysia
81310 UTM, Skudai, Johore Bahru, Malaysia E-mails: [email protected],:[email protected]
KEYWORDS: RADARSAT-1 SAR,ERS-1, Velocity bunching, Canny algorithm, Shoreline change.
ABSTRACT
This paper introduces new method for simulating shoreline change from multi-SAR data. Edge detection algorithm such as Canny algorithm is implemented to identify shoreline. Automatic detection of sequence of shoreline derived from historical multi-SAR data (ERS-1 and RADARSAT-1 SAR data) used to estimate rate of shoreline change. In addition, velocity bunching model used to model the spectral energy of ocean waves from multi-SAR data. Then, rate of shoreline is simulated by using velocity bunching model. The study shows that: the maximum rate of erosion is -3.0 m/year along the coastal water of Kuala Terengganu, Malaysia. There is significant relationship between shoreline change rate estimated using Canny algorithm and ones modeled using velocity bunching model. The significant relationship is shown by high value of R2 of 0.77.
1. INTRODUCTION
to identify coastline. Maged (2002) and Liu et al., (2004) utilized edge detection algorithm such as Canny for coastline detection. Further studies have been simulated the shoreline change based on volume change of sediment transport by using ERS-1 images. Maged (2003) reported that shoreline change can be easily modeled from wave spectra information have extracted from SAR images. Analytical methods introduced by Vachon et al., (1993,1994 and 1995) of modeling significant wave height from SAR data based on quasi-linear and velocity bunching models have been implemented by Maged (2001, 2002 and 2003) to predict shoreline change from ERS-1 images. The aim of this work is to utilize Canny edge detection algorithm with velocity bunching model to simulate the rate change of shoreline from historical multi-SAR data (ERS-1 and RADARSAT-1 SAR data).
2. METHODS
2.1 Study Area
The study area is located in the coast of Kuala Terengganu, on eastern part of Peninsular Malaysia. This area is approximately 20 km along the north of Kuala Terengganu coastline, located between 5° 21’ N , 103° 10’ E and 5° 30’ N, 103° 20’ E). Sand materials make up the entire of this beach (Maged 2000). The east coast of Peninsular Malaysia is annually subjected to the northeast monsoon wind (November to January) (Stanley, 1985) under study showed that the mean and longer significant wave periods were 8 to 10 seconds. Significant wave heights maximum have reported by were 4 m and 2.4 m, respectively which are experienced in February and March However, during the southwest monsoon wave height was ranged between 0.4m -0.7m (Maged et al., 2002). During the inter- monsoon period (September to mid of November), the wave height was ranged between 0.37m to 1.6 m (Maged 2002).
2.2 Data Acquired
SAR data used in this study are involved ERS-1 and RADARSAT-1 SAR data. ERS-1 data in the Cvv band (12.5 m) is acquired on 12 December 1999. The in situ wave
INTERNATIONAL CONFERENCE ON SPACE TECHNOLOGY AND GEO-INFORMATICS 2006
2.3 SAR Velocity Bunching Model
The velocity bunching MTF is the dominant component of the linear MTF for the ocean waves with an azimuth wave number (kx). According to Vachon et al., (1994 and 1995),
the velocity bunching can contribute to linear MTF based on the following formula
⎥⎦ ⎤ ⎢⎣
⎡ +
= ω sinθ icosθ
k k V
R
M x
v (1)
where R/V is the scene range to platform velocity ratio, θis ERS-1 and RADARSAT-1 SAR
incidence angels (23° and 27.49°) and ω is wave spectra frequency which equal 2Π/K.
To estimate the velocity bunching spectra Svb(k), we modified the algorithm that was
introduced by Krogstad and Schyberg, (1991). The modification is to multiply the velocity bunching MTF by ERS-1 SAR and RADARSAT-1 SAR spectra variance of the azimuth shifts. This can be given by
] ][ ) ( ! ) ( [ )
( * 2 2
1 2 0 v K n n n x
vb S k e M
n k I
k
S x ρζζ
ζζ ψ
ψ −
∞
=
∑
= (2)
where Sζζis the SAR spectra variance of the azimuth shifts due to the surface motion,
which induced by the velocity bunching effect in azimuth direction due to high value of R/V.
The relation between standard deviation of the azimuth shift and significant wave height can be given by
s xg H k
V
R 2 0.5 )0.5 8 ( ) 2 ) ( sin 1 )( ( θ
σ = − (Vachon et al., 1993) (3)
where kx is the azimuth wave number. Note that the mean wave period T0 is equal to
5 . 0 ) (
2π kx g − . Using equation 3 with equation 4, so the significant wave height can be
given as 0 2 5 . 0 ] / 4 / 1 [ ) ( 6 . 0 T V R
Hs = ρζζ +θ (4)
where θis the ERS-1 and RADARSAT-1 SAR incidence angles and equation 4 is used to
used to model the rate of volumetric sediment transport based on the depth of significant wave breaking by using the following formula derived from Maged (2003)
5 / 2 2 0 2 5 /
1 ) )( )] ]
/ 4 / 1 ( 6 . 0 [[( 4 .
0 T T
V R g
HSb = ρζζ +θ (5)
According to Maged 2003, the along-shore sediment transport volume rate Q, is calculated
as b b sb H g
Q=1.1ρ 3/2( )5/2sinα cosα (6)
where ρ=1020 kg/m3 for sea water and αb is the breaking wave angle estimated from linear wave transformation model. The ambiguity of SAR wave spectra are resolved by using the sea direction in situ measurements. According to Maged (2002) the shoreline change rate based on volume change of sediment transport can be estimated by following equation Qdt h ydx t t x
x
∫
∫
− =
0 0
2 (7)
where t is period of change and x is along shore distance and h the depth of closure (m).
2.4 Automatic Detection of Shoreline
According to Maged (2002) the shoreline of east Coast of the Peninsula of Malaysia is defined by the boundary between vegetation and the bar sandy area (beach). Following Maged (2002) Canny algorithm has applied to SAR images after performing linear filters by using Guassian and Lee algorithms. The Canny algorithm has applied as follows: The input of the SAR image intensity I, which is corrupted by noise. Let G be a Gussian with zero mean and standard deviation σ . The value of σ to be relied on the length of interesting
INTERNATIONAL CONFERENCE ON SPACE TECHNOLOGY AND GEO-INFORMATICS 2006 ) , ( ) , ( ) ,
(i j J 2 i j I 2 i j
ex = x + y (9)
The historical edge detection vectors then overlaid and the rate change (R) of shoreline estimated by given simple formula ( Maged 2001)
0 0 t t x x R n n − −
= (10)
where x is the horizontal measured distance between initial vector (x0) of ERS-1 image
and second vector xnof RADARSAT-1 SAR image over period t.
2.5 Field Work
Beach profile survey has been conducted during the RADARSAT-1 SAR pass over coastal water of Malaysia. Profile survey is carried out by using level and staff methods. Theodoliate is fixed on front between vegetation and sand. Then poles are fixed at every slope point. Furthermore, Global Position System (GPS) has used to collect geographical coordinates of selected 10 locations (Figure 1), where the interval distance between every location was 2 km. Additionally, the ground data information has used to acquire more precisely geomateric correction processing for multi-SAR data. Finally, accuracy validation is performed by comparing between multi-SAR and ground data.
3. RESULTS AND DISCUSSION
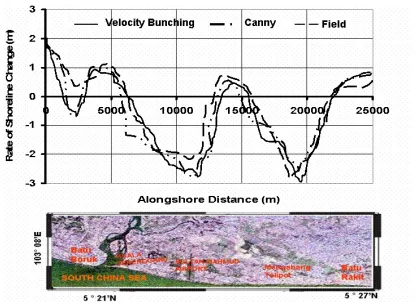
(2004). Figure 3 shows the result of Canny algorithm. It is interesting to notice that Canny algorithm is provided an automatic digitizing for shoreline. Furthermore, it is also clear that small texture details have detected. Indeed, Canny algorithm can perform pseudo-edge appearance. Additionally, the concave coastline is detected which is obvious along the coastline of Sultan Mohamed Airport. Maged (2002) stated that Canny algorithm produces pixel wide skeleton curves and able to extract the sequences of pixels along this curve. He concluded that each curve contains sequences of pixels is able to convert to vector layer by fitting piecewise line segments to it. In addition, Canny is able to produce a polyline is an approximation to the original pixel curve. Which could link pairs of polylines. Figure 4 shows the comparison between shoreline change rate simulated by velocity bunching and one based on historical vector layers extracted by Canny algorithm and ground data measurements. The different sorts of data are agreed that the high rate of erosion is recurred along the Mengabang Telipot coastline with maximum values of -3.0, -2.8, -2.6m/ yr obtained by velocity bunching model, Canny algorithm and ground beach profile surveying. Meanwhile, Sultan Mohamed airport is encountered high rate of erosion within maximum values of -2.4, -2.00, -1.93 m/yr modeled from velocity bunching model, Canny algorithm and ground beach profile data collection. The sedimentation events have been observed along mouth river of Kuala Terengganu and Batu Bourq within average values of 1.89 m/yr which are acquired from velocity bunching ,Canny algorithm and ground data. Table 1 shows significant relationship between Velocity Bunching model and Canny algorithm with R2 of 0.70.
4.0 CONCLOUSION
INTERNATIONAL CONFERENCE ON SPACE TECHNOLOGY AND GEO-INFORMATICS 2006
Figure 1 Location of Study Area
Figure 2 Signficant wave Height Modeled by Velocity Bunching Model (a) ERS-1 and (b) RADARSAT-1 SAR images
Figure 4 Rate Change of Shoreline from Canny, Velocity Bunching and Field data.
Table 1 Statistical Analysis between Velocity Bunching, Canny and Field Data
Methods R2 Velocity Bunching-Canny 0.70
INTERNATIONAL CONFERENCE ON SPACE TECHNOLOGY AND GEO-INFORMATICS 2006
REFERENCES
Krogstad, H.E., and Schyberg, H. (1991). On Hasselman ’s nonlinear ocean –SAR transformation. Proceedings of IGARSS’91, Espo, Finland, June 3-6, 1991. pp:841-849.
Liu, H., and K.C., Jezek (2004) Automated Extraction of Coastaline from Satellite Imagery by Integration Canny Edge Detection and Locally Adaptive Thresholding Methods. Int. J. Remote Sensing. 35:973-958.
Maged M., (2000). Wave spectra and shoreline change by remote sensing data. Ph.D. Thesis, Universiti Putra Malaysia, Serdang, Kuala Lumpur, Malaysia.
Maged M., (2001). TOPSAR wave spectra model and coastal erosion detection. Int. J. Applied Earth Observation and Geoinformation, (3)(4): 357-365.
Maged M., Ibrahim, Z., Genderen, J.V. (2002). Azimuth cut-off for significant wave height investigation along the coastal water of Kuala Terengganu, Malaysia. Int. J. Applied Earth Observation and Geoinformation. (4)(3): 147-160.
Maged M., (2002) Opertional of Canny Algorithm on SAR data for Modelling Shoreline Change. Photogram. Ferner. Geoinformation. 93, 93-102.
Maged, M. (2003) ERS-1 Modulation Transfer Function Impact on Shoreline Change Model. Int. J. Applied Earth Observation and Geoinformation. (4): 279-294.
Maged M. (2004) Velocity Bunching Model for Modelling wave Spectra along East Copast of Malaysia. J. Indian Society of Remot. Sensing, Vol 32. pp:185-198.
Stanely Consultants Inc., (1985). Malaysian national coastal ersoion study, Volume II. UPEN, Kuala Lumpur, Malaysia.
Vachon P. W., Olsen, R., Livingstone, C. and Freeman, N.G. (1988) Airborne SAR observations of ocean surface waves during LEWEX. IEEE Transactions on Geoscienceand Remote Sensing, 26: 549-562.
Vachon P.W., and Raney, R.K. (1989). Estimation of the SAR system transfer function through processor defocus. IEEE Transactions on Geoscienceand Remote Sensing,
Vachon, P.W., and Raney, R.K., (1991). Resolution of the ocean wave propagation direction in SAR imagery.IEEE Transactions on Geoscienceand Remote Sensing, 29 (91):105-112.
Vachon, P.W., Ghogal., A.S., and West,J.C. (1992). Airborne SAR measurements of ocean waves during SWADE. Proceeding of 15th Canadian Symposium on Remote
Sensing, 1-4 June 1992. Toronto: Canada. pp. 352-356.
Vachon, P.W., Raney,R.K., Krogstad, H.E., and Liu, A.K., (1993). Airborne synthetic aperture radar observations and simulations for waves-in-Ice. J. Geophysical Research, 98:16,411-16,425.
Vachon, P.W., Krogstad, H.E., and Paterson,J.S., (1994). Airborne and spaceborne synthetic aperture radar observations of ocean waves. Atmosphere-Ocean. 32(10): 83-112.