Analysis of Edge Detection by Using Phase Stretch
Transform (PST) and Canny Algorithms
Thida Soe*, Soe Soe Mon**, Khin Aye Thu***
*(Faculty of computer systems and Technology, University of Computer Studies,Hinthada, Myanmar Email: [email protected])
** (Faculty of computer systems and Technology, University of Computer Studies,Hinthada, Myanmar Email: [email protected])
*** (Faculty of computer systems and Technology, University of Computer Studies,Hinthada, Myanmar Email: [email protected])
---
************************
---Abstract:
The important objective of image processing is to construct the content of image effectively and finds the fateful and significant information from it. One of the most frequently used operations in image analysisis edge detection. If the edges of images could be recognised accurately, all of the objects can be located efficiently and performance can be measured easily. It reduces the complexity of image processing algorithms by reducing the amount of data to be processed .The quality of image is affected when there is a spring in intensity from one pixel to another. Thus,dominant objective is to detect an edge while maintain the important structural properties of an image. Several types of algorithm are developed to detect the edges. In this paper, the analysis is done on Canny and Phase Stretch Transform (PST) Algorithms. PST Algorithm transforms the image by emulating the propagation of light through a physical medium with specific warped diffraction property. We show that the output phase of the transform disclose transitions in image intensity and can be used for edge detection. To evaluate the effectiveness of the methods illustrated, we have used theMSEand PSNR.
Keywords — Edge detection, Canny, Phase Stretch Transform (PST), MSE, PSNR
---
************************
---I. INTRODUCTION
Digital image processing has become a functional as well as popular research area that goes from specialized photography to several different fields such as astronomy, meteorology, computer vision, medical imaging, among others. The main goal of digital image processing is to improve the pictorial information. So, the shape information of the objectis to find the edges involving in that object must be identified. A method that edge detection is to detect the occurrence of edges and its locality which is created by sharp and abrupt variations in intensity of an image. The discontinuities of an
image can be variation in scene illumination,break off in scene, surface orientation, its depth and variation in material properties. The objectives of edge detection are to detect the shape information of the object and the reflectance in the image. Edge detection is the important step in image analysing and processing, computer vision, human vision, object detection and pattern recognition.Some edge detectors take more time and detect more edges with respect to others.The different edge detectors work differently. In an image,the edge detection is rest on intensity, illumination, objects, noise and blur. Many methods have been proposedfor edge de
tection, but most of them can be grouped
into two main categories: zero-crossing based and search-based. The zero-crossing based methods search for zero crossings in a Laplacian or second-order derivative computed from the image. The search-based methods compute the edge strength, usually with a first-order derivative, and then search for local directional maxima of the gradient amplitude.
PST method emulates diffraction using an all-pass phase filter with specific frequency dispersion dependencies. The output phase profile in spatial domain reveals variations in image intensity and when followed by thresholding and morphological post-processing provides edge detection. Also, the details of the filter kernel are different in the two cases. The concept of diffraction based image processing has its roots in the Photonic Time Stretch, a temporal signal processing technique that employs temporal dispersion to slow down, capture, and digitally process fast waveforms in real time. In this paper, we also demonstrate application of the PST edge detection algorithm to some biomedical and building images.
II.EDGE DETECTION
Edge detection refers to the process of identifying and locating sharp discontinuities in an image. Edge is the area of major change in the image intensity or contrast and edge detection is locating areas with strong intensity contrasts. We use edge detection because it helps in extracting information about the image such as location of objects present in the image, their shape, size, image sharpening and enhancement. Edge detection is used for image segmentation based on abrupt changes in intensity. In a continuous image, a sharp intensity transition between neighbouring pixels is considered as an edge. Three steps in edge detection are:
• Image smoothing: filtering the image for improving the performance of edge detector and for noise reduction.
• Detection: extracting all edge points that are possible candidates to become edge point.
• Edge localization: selecting from the candidate edge points only the points that are true members of set of points comprising an edge.
III. EDGE DETECTION TECHNIQUES
In the process of edge detection, the image is inputted first and converts that image into grey scale image. And then apply the edge detector to detect and extract the edges present within an image as output. The detected edges overlaid with the grey-scale version of the original image.
A. Canny Edge Detection Algorithm
J.F Canny has proposed a Computational Approach to Edge Detection which is known as optimal edge detector. The Canny's intentions were to enhance the many edge detectors already out at the time he started his work. The algorithm runs in 6 separate steps:
1. Smoothing: Blurring of the image to remove noise
2. Finding gradients: The edges should be marked where the gradients of the image has magnitudes 3. Direction calculation: In this step, direction of edge should be calculated.
4. Non maximum suppression: Only local maxima should be marked as edges
5. Double thresholding: Potential edges are determined by thresholding.
6. Edge tracking by hysteresis: Finally edges are determined by suppressing all edges that are not connected to very certain (strong) edge.
B. Phase Stretch Transform (PST)
the image by applying more phases to higher frequency features. Image edges can be extracted by thresholding the PST output phase image. After thresholding, the binary image is further processed by morphological operations to find the image edges.
The image under analysis is represented by B[n, m], where n and m are two-dimensional spatial variables. The PST in frequency domain can be described as follows:
A[n,m]=
∠〈FFT2 [p, q] . [p, q] . FFT2{ B[n, m] } 〉
WhereA[n, m] is the output phase image, ∠〈. 〉 is the angle operator, FFT2 is the two-dimensional Fast Fourier Transform, IFFT2 is the two-dimensional Inverse Fast Fourier Transform, and p and q are two-dimensional frequency variables. The function [p, q] is the frequency response of the localization kernel and the warped phase kernel [p, q] is described by a nonlinear frequency dependent phase:
[p, q] = [ , ]
While arbitrary phase kernels can be considered for PST operation, here we study the phase kernels for which the kernel phase derivative PD [p, q] is a linear or sub linear function with respect to frequency variables. A simple example of such phase derivative profiles (e.g., represented by least number of parameters) is the inverse tangent function which leads to the following PST kernel phase:
[p,q] = polar[r, ] polar [r]
=S
. . !"#$ . %&'#
().*+ $,-$ . %(%
. ./0. !"#$ . ./0%&'#().*+ $,-$ ../0%(% Where, r =123+ 53, = tan-1$ %, tan-1(.) is the
inverse tangent function, ln(.) is the naturallogarithm, and rmax is the maximum frequency r. S and Ware real-valued numbers related to the strength (S) and warp (W) of the phase profile applied to the image. For simplicity, we have assumed that the PST kernel phase profile
has circular symmetry with respect to frequency variables. For small warping factors W ≪ 1, the phase profile [p,q] becomes a quadratic phase and represents the case with linear phase derivative. The two parameters S and W along with the width of the localization kernel and the thresholding values are used to extract the edge information.
The parameters that are required to be designed for the proposed edge detection methods are
(1) S and W: Strength (S) and Warp (W) of the applied phase kernel
(2) ∆f:Bandwidth of the localization kernel (3) Thresh: Threshold value
C. Parameter Used For Comparison
In this paper, PSNR and MSE are used to measure the performance of each edge detection technique. 1)Peak Signal to Noise Ratio (PSNR)
PSNR is measured as the ratio of maximum possible power and occurring noise that can disturb the representation of the image. PSNR is measured in decimal scale. To calculate the quality reconstruction of an image, PSNR is used commonly by the various researchers. It is a case where original data is treated as signal and occurring error is treated as noise. The maximum value of PSNR shows high image quality. The PSNR can be expressed as follows:
PSNR= 10 log10'89:8;<#()
Where MAX = Maximum pixel value of image and image is represented by 8 bit/sample.
2) Mean Square Error (MSE)
IV. EXPERIMENTALRESULTS
The experiment is done on Matlab R2014a and tested with the two MRI images and building image. To extract the clean edges map by using the principle edge feature of image is our objective. Here various experiments are analysed by varying sigma, minimum threshold and maximum threshold for canny edge detection algorithm Also, PST algorithmis analysed by varying phasestrength (S) and phasewarp (W)to detect the edges.
From figure (1),theMRI image under analysis is with 234 × 215 pixels. For Canny method, designed parameters aresigma=1.4, min threshold=0.03, max threshold=0.10. For PST method, designed parameters are phase strength = 0.48, phase warp=12.4, minimum threshold = -1, maximum threshold = 0.002. Morphological operations used for the result include edge thinning and isolated pixel removing. We have also shown the detected edges overlaid with the gray-scale version of the original image.
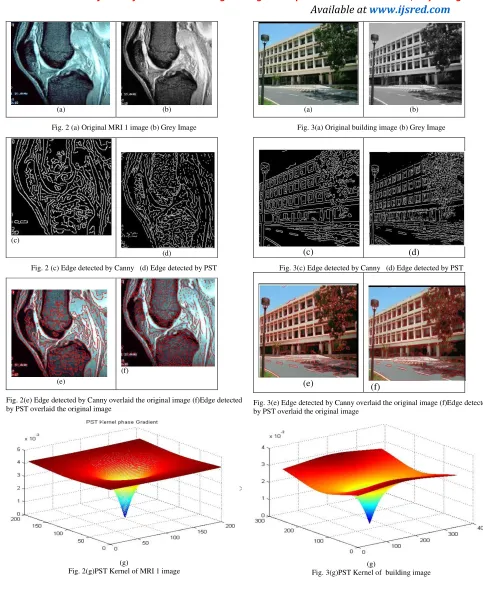
From figure (2),theMRI 1 image under analysis is with 200 × 192 pixels. For Canny method, designed parameters aresigma=1.5, min threshold=0.04, max threshold=0.10. For PST method, designed parameters are phase strength = 0.5, phase warp=10.5, minimum threshold = -1.005, maximum threshold = 0.002.
From figure (3),the building image under analysis is with 342 × 255 pixels. For Canny method, designed parameters aresigma=1.5, min threshold=0.04, max threshold=0.10. For PST method, designed parameters are phase strength =0.48, phase warp= 10.6, minimum threshold = -1.003, maximum threshold = 0.0019.
(a) (b)
Fig. 1 (a) Original MRI image(b) Grey Image
(c)
(d)
Fig. 2(c)Edge detected by Canny (d) Edge detected by PST
(e) (f)
Fig. 3(e) Edge detected by Canny overlaid the original image (f)Edge detected by PST overlaid the original image
(g)
(a) (b)
Fig. 2 (a) Original MRI 1 image (b) Grey Image
(c) (d)
Fig. 2 (c) Edge detected by Canny (d) Edge detected by PST
(e)
(f)
Fig. 2(e) Edge detected by Canny overlaid the original image (f)Edge detected by PST overlaid the original image
(g)
Fig. 2(g)PST Kernel of MRI 1 image
(a) (b)
Fig. 3(a) Original building image (b) Grey Image
(c) (d)
Fig. 3(c) Edge detected by Canny (d) Edge detected by PST
(e) (f)
Fig. 3(e) Edge detected by Canny overlaid the original image (f)Edge detected by PST overlaid the original image
(g)
Table 1 illustrated the MSE and PSNR value for the results of two edge detection techniques.
TABLEI
PSNR AND MSE VALUE FOR EDGE DETECTION TECHNIQUES
(a) (b)
(c)
Fig.4 Comparisonresults of MSE and PSNR for (a) MRI (b) MRI 1(c) Building image.
V. CONCLUSIONS
In this paper, two edge detection techniques are studied and compared. After the experimental analysis, that images by using the second order derivatives (Canny) produces good results for image quality and visual perception. According to MSE and PSNR value, PST is not providing the better results than canny edge detection technique in presence of noise. Hence, it is experimentally proved that the canny edge detector is a better edge
detector technique of forming the edges for inner as well as outer lines of the object. It has more good resistance to noise than PST edge detection technique. Here, PST edge detection technique proves better for discovering better outer lines (continuous boundary) only of an object.
REFERENCES
[1] E. Nadernejad, S. Sharifzadeh and H. Hassanpour, “Edge Detection Techniques Evaluations and Comparisons”, Applied Mathematical Sciences, vol. 2, no. 31, (2008), pp. 1507 – 1520
[2] R. Maini and H. Agrawal, “Study and Comparison of Various Image Edge Detection Techniques”, International Journal of Image Processing (IJIP), vol. 3, issue 1, pp. 1-12.
[3] M. Juneja and P. Singh Sandhu, “Performance Evaluation of Edge Detection Techniques for Images in Spatial Domain”, International Journal of Computer Theory and Engineering, vol. 1, no.5, (2009), pp. 614-621.
[4] V. Saini and R. Garg, “A Comparative Analysis on Edge Detection Techniques Used in Image Processing”, IOSR Journal of Electronics and Communication Engineering (IOSRJECE), ISSN: 2278- 2834, vol. 1, issue 2, (2012), pp. 56-59.
[5] Mohammad H. Asghari1
and Bahram Jalali.”Edge Detection in Digital Images Using Dispersive Phase Stretch Transform”,Volume 2015, Article ID 687819, 6 pages.
[6] M. H. Asghari and B. Jalali, “Discrete anamorphic transform for image compression,” IEEE Signal Processing Letters, vol. 21, no. 7, pp. 829– 833, 2014.
[7] Y. Han and B. Jalali, "Photonic time-stretched analog-to-digital converter: fundamental concepts and practical considerations", Journal of Lightwave Technology 21, 3085 (2003)
[8] Mohd. aaquib Ansari,Diksha Kurchaniya,Manish Dixit, “A Comprehensive Analysis of Image Edge Detection Techniques”, International Journal of Multimedia and Ubiquitous Engineering Vol.12, No.11 (2017), pp.1-12
[9] M. H. Asghari, and B. Jalali, "Physics-inspired image edge detection", IEEE Global Signal and Information Processing Symposium (Global SIP 2014), paper: WdBD-L.1, Atlanta, December 2014.,
[10] AMRUTA L KABADE,Dr.V.G. Sangam, “Canny edge detection algorithm”,International Journal of Advanced Research in Electronics and Communication Engineering (IJARECE) Volume 5, Issue 5, May 2016
[11] R. Muthukrishnan and M. Radha, “Edge Detection Techniques for Image Segmentation”, International Journal of Computer Science & Information Technology (IJCSIT), vol 3, no 6, (2011), pp.-259-267 [12] G.N.D.U, Amritsar, Punjab, India,“Overview and Comparative
Analysis of Edge Detection Techniques in Digital Image Processing”,International Journal of Information & Computation Technology. ISSN 0974-2239 Volume 4, Number 10 (2014), pp. 973-980
Edge Detection Techniques
MRI Image MRI 1 Image Building Image MSE PSNR MSE PSNR MSE PSN
R
Canny 57.40 30.65 68.22 29.85 102.7 28.05