LITERATURE CITED
ALDOUS, A. E. 1934. Effect of burn- ing on Kansas bluestem pastures. Kan. Agr. Exp. Sta. Tech. Bull. 38. 65 p.
ANDERSON, K. L. 1961. Burning blue- stem ranges, Crops and Soils 13-
(5) : 5-6.
DWYER, D. D. 1958. An annotated plant list for Adams Ranch. Unpbl. M. S. Thesis. Fort Hays Kansas State College, Hays. 172 p. DWYER, D. D. 1963. Effect of rate
and date of nitrogen fertilization on native grass. Okla. Agric. Exp. Sta. Mimeo. 2 p.
EHRENREICH, J. H. 1959. Effect of burning and clipping on growth of native prairie in Iowa. J. Range Manage. 12: 133-137.
ELDER, W. C., AND H. F. MURPHY. 1958. The effect of fertilization and overseeding with lespedezas on a native hay meadow. Okla. Agr. Exp. Sta. Bull. 504. 15 p.
GRAY, FENTON, AND H. M. GALLOWAY. 1959. Soils of Oklahoma. Misc. Pub. 56. Oklahoma State Univ., Stillwater.
HARPER, H. J. 1957. Effects of fertili- zation and climatic conditions on prairie hay. Oklahoma Agr. Exp. Sta. Bull. 492. 23 p.
HAZELL, D. B. 1964. Forage produc- tion, vegetative composition, and plant vigor in relation to range condition. Unpbl. PhD. thesis. Oklahoma State Univ. Stillwater. 83 p.
HUFFINE, W. W., AND W. C. ELDER. 1960. Effect of fertilization on na- tive grass pastures in Oklahoma. J. Range Manage. 13:34-36. MADER, E. L. (No date). The influ-
ence of certain fertilizer treat- ments on native vegetation on Kansas prairie. Kansas State Univ. Mimeo. 11 p.
NELSON, M., AND E. N. CASTLE. 1958. Profitable use of fertilizer on na- tive meadows. J. Range Manage. 11: 80-83.
STEEL, R. G. D., AND J. H. TORRIE. 1960. Principles and Procedures of Statistics. McGraw-Hill, New
York. 481 p.
WILLIAMS, J. S. 1953. Seasonal trends of minerals and proteins in prairie grasses. J. Range Manage. 6: 100- 108.
Sideoats Grama as an Indicator of
Grazing Intensity and A Method
of Determining Its Utilization
WILLIAM J. WALDRIP
Associate Range Scientist,
Texas Agricultural Experiment Station, Seymour, Texas
Highlight
Sideoafs grama is a key species for indicating forage use on the Roll-
ing Plains of Texas. A regression
equation for field determination of
percent utilization of sideoats grama
was developed and tested. The
method developed, based on mea- surements of total height and stubble heighi, is more rapid and accurate than other methods commonly used by technicians.
Judicious stocking to obtain proper use is an essential eco- nomic factor in livestock pro- duction on rangeland. However, the inherent low productivity of most rangelands necessitates utilization surveys on vast, usu- ally heterogeneous areas. Under these conditions, most methods have been undesirable because of the low degree of accuracy or the time and expense necessary.
Forage use is- determined by the impact of grazing on the most abundant palatable plants (Hedrick, 1958). When the ecol- ogy of the area is understood,
utilization surveys may be simplified by selecting a key spe- cies upon which to base proper use. This species must be one that is relatively or potentially abundant, palatable, one that en- dures moderately close grazing, and one that is an indicator of the entire forage complex.
Sideoats grama (Bouteloua curtipenduZa (Michx.) Torr.) was chosen for the present study because it most closely met the requirements outlined. After de- termining the reliability of this grass as the key species on the shallow uplands of the Rolling Plains of Texas, a rapid, accurate method for estimating its use by grazing animals was developed.
Experimental Areas
and Procedures
Study Locations. - Utilization
studies were conducted on the Perryman Ranch in Baylor County (Site A) and the Texas
Experimental Ranch in Throck- morton County (Site B) to de- termine the feasibility of using sideoats grama utilization as an indicator of grazing use. Both sites represent major ecological types in the Rolling Plains. Site A was a level area of shallow, slowly permeable, gravelly clay supporting principally short and midgrasses. Site B was repre- sentative of the most common range site on the Texas Experi- mental Ranch. The topography was gently rolling, and the soil was dark brown, shallow and slowly permeable. This soil type also supported principally short and mid-grasses.
Extreme variation in ecologi- cal adaptation, morphological characteristics and chromosome numbers of B. curtipendula has been noted by Gould (1959). However, in the Rolling Plains of Texas, the broad-bladed rhizo- matous form, B. curtipendula
var. curtipendulu, (Gould and
embraced
variations
in growth
form of the species in the Rolling
Plains:
1, R. A. Brown Ranch, Throck-
morton
County
2, Seymour
Country
Club,
Baylor County
3. McGinty
Ranch,
Dickens
County
4, Texas Agricultural
Experi-
ment
Station,
Edwards
County
Location
4 was
not
on the
Rolling Plains,
but supported
a
population
of the broad-bladed,
rhizomatous
sideoats grama.
Experimental Procedure. - Two
adjacent
areas
were selected for studies on the Perryman Ranch (Site A) to determine grazing use. These two areas, each one acre in size, were similar except that grazing was excluded for one growing sea- son on one while the other was grazed. One hundred plots, each 1.9 square feet in area, were randomly established in each area. All her- baceous material was clipped at ground level from each plot and separated by species. Each sample was then air dried and weighed to the nearest 0.1 gram for determin- ing utilization. The clippings on this site were made in September, 1959; but since the entire area was sub- jected to grazing shortly thereafter, additional clippings could not be made.In September, 1960 and 1961, similar studies were conducted on the Texas Experimental Ranch (Site B).
These studies were for the pur- pose of determining species com- position by weight for the grazed and ungrazed plots in order to evalu- ate the role of the more abundant species, particularly sideoats grama, as forage providers and as indicators of forage utilization.
The number of randomly selected samples collected from each of the four locations for the height-weight study was determined from the
formula n= y- (Snedecor, 1956)
where n is the number of samples, s is the standard deviation and L is the allowable error of the sample mean. Preliminary studies indi- cated that the number of plants ne- cessary for an allowable error of no more than 10% of the sample mean
varied from 13 plants at Throck- morton to 20 at Seymour. These numbers gave a probability of 0.95 that the true mean was within 10% of the sample mean,
In two successive years, two hun- dred plants, in groups of 25 samples each, were selected from the four locations after the first killing frost. Each sample consisted of a 4-inch square segment of sideoats grama sod. The number of culms and the total height to the nearest inch were recorded for each sample.
The samples were removed to the laboratory where soil, roots and for- eign matter were carefully removed. Each was then wrapped spirally with string from the base upward and the base was measured to the nearest 0.1 inch with a diameter tape. Each plant then was divided into l-inch segments which were oven dried at 105°C. for 24 hours and weighed to the nearest mg.
Since stubble height is a direct re- sult of utilization, the measurements of total height, wrapped diameters and numbers of stems were made in order to determine their influence upon stubble height at a given level of use. Coefficients of determination and standard partial regression co- efficients indicated that total height was the most reliable single variable for estimating stubble height at a given level of use. The increased accuracy gained from combinations of 3 variables was not sufficient to justify their use.
Regression equations were de- veloped to show the relationship be- tween stubble height and total height at different levels of utilization.
Regression equations were de- veloped for field use for estimating utilization with stubble height
and
total height as independent vari- ables. These were tested and com- pared with ocular estimates by ex- perienced technicians to determine the relative efficiency of the re- gression equations for estimating percent utilization.
Five experienced range technicians estimated utilization on 20 numbered plants clipped at various stubble heights. The numbers were then changed and the estimates repeated in order to determine the ability of experienced personnel to repeat their evaluations. Utilization deter- minations were also made on the same 20 plants using the regression
equations. Actual utilization was then determined from weights of the clipped and unclipped portions of each plant. Accuracy of the utili- zation methods was determined by comparison of the various estimates with actual use. Analyses of vari- ance were used to determine sig- nificance of mean difference within men and between men using the ocular estimate method.
Results and Discussion UtiZization Studies. - Sideoats grama comprised a major portion of the forage consumed in all of the utilization studies. Names of all herbaceous species clipped on both sites are listed in Table 1.
Total forage utilization of Site A was 24.4% of the total production or 287 lb/acre (Table 2). Sideoats grama utilization was 38.5% or 106 lb/acre.
Clipping studies were conducted for two successive years on Site B. Forage use the first year was 674 lb/acre or 26.7% of the total forage produced. Utilization of sideoats grama was 634 lb/acre or 62.6%.
Total production on Site B was greater in 1961 than in 1960 (Table 2). However, because of increased livestock numbers, forage use was heavier. Total use was 1356 lb/acre or 35% of the total forage produc- tion, Sideoats grama utilization was 626 pounds or 51.6%. Ideal grazing conditions brought about by well dis- tributed precipitation evidently in- creased the palatability of Texas wintergrass and buffalo grass. Curly mesquite grass, which received 60,8% use in 1960, was apparently unused in 1961.
Sideoats grama was consistently selected
by
livestock ingreater
quantity than any other major for- age species on both sites A and B. Field observations indicated that sideoats grama was utilized by cattle during all months of the year. Con- sumption of other abundant forage grasses on these sites was greatly influenced by stage of growth or soil moisture relationships.
On the basis of the information obtained from these studies it was concluded that sideoats grama is a key species on the shallow upland sites on the Rolling Plains.
Height- Weight Studies-Individual and Group Relationships:
Table 1. Specific and common names of plants encounfeced in clipping studies on Sites A and B.
Species Common Name
- Grasses:
Aristida Zongiseta Steud. Red threeawn
Aristida wrightii Nash Wright threeawn
Bouteloua curtipendula (Michx.) Torr. Sideoats grama
Bouteloua hirsuta Lag. Hairy grama
Bouteloua rigidiseta (Steud.) Hitchc. Texas grama Buchloe dact~loides (Nutt.) Engelm, Buffalograss Eriochloa sericea (Scheele) Munro Texas cupgrass Hilaria belangeri (Steud.) Nash Curlymesquite
Panicum hallii Vasey Halls panicum
Schedonnardus panniculatus (Nutt.) Trel. Tumblegrass Sporobolus asper var. hookeri (Trin.) Vasey Meadow dropseed Sporobolus cryptandrus (Torr.) A. Gray Sand dropseed Stipa Zeucotricha Trin. and Rupr. Texas wintergrass Tridens albescens (Vasey) Woot. and Standl. White tridens Tridens muticus (Torr.) Nash Slim tridens Tridens pilosus (Buckl.) Hitchc. Hairy tridens Forbs:
Descurainiu pinnata (Walter) Britton Tansy mustard
Evax multicaulis DC. Rabbit’s tobacco
Gutierrexia dracunculoides (DC.) Blake Annual broomweed Luppula redowskii (Hornemann) Greene Flatspine stickseed Lepidium austrinum Small Peppergrass Liatris punctata Hook. Dotted gayfeather Plantago rhodosperma Decaisne Tallowweed
Solanum elaeagnifolium Cavanilles Silverleaf nightshade Solanum rostratum Dunal Buffalobur nightshade
-
Table 2. Producfion and uiilizafion from Sites A and B.
Average
Pounds per percent
acre utiliza-
Species Treatment 1959A 1960-B 1961-B Total tion -~ Sideoats grama Ungrazed 275 1013 1214 2502 54.6
Grazed 169 379 588 1136
Buff alograss Ungrazed 125 710 1680 2515 Grazed 82 899 1200 2181 13.3
Three-awn Ungrazed 260 187 102 549
Grazed 302 107 70 479 12.8
Texas wintergrass Ungrazed - 272 490 762
Grazed - 286 302 588 22.8
Curly mesquite Ungrazed - 131 228 359
Grazed - 51 238 289 19.5
Other grasses1 Ungrazed 289 68 28 385
Grazed 151 35 24 210 45.5
Forbss Ungrazed 228 142 130 500
Grazed 189 92 94 372 25.6
Total Ungrazed 1177 2523 3872 7572
Grazed 890 1849 2516 5255 30.6
1 Includes hairy grama, Texas grama, Hall’s panicum, hairy tridens, slim tridens, white tridens, meadow dropseed, sand dropseed, Texas cupgrass and tumblegrass.
2 Includes annual broomweed, buffalobur, dotted gayfeather, flatspine stickseed, pepper-grass, rabbit’s tobacco, silverleaf nightshade, tallow- weed and tansy mustard.
dividual sideoats grama plants from the respective sites in each year ex- hibited considerable variation in the characteristics measured.
The variation in total height ranged from a low of 9 inches at Throck- morton to an extreme of 37 inches at Spur in 1959. The numbers of culms were extremely variable, rang- ing from none at Throckmorton to 85 at Spur in 1959,
In wrapped basal diameter the range was from 0.36 inches at Spur in 1958 to 1.43 inches at Spur in
1959,
In total weight both the lightest and heaviest samples were found at Spur. The lightest, 1.974 grams, was collected in 1958 and the heaviest, 45.515 grams, in 1959.
The extremes for stubble heights at the 50% level of utilization varied from 1.6 inches at Seymour in 1958 and 1959 and at Throckmorton in 1959 to 5.9 inches at Spur in 1959.
Coefficients of variation indicated that the least variable measurement was stubble height at the 50% utili- zation level while number of stems was the most variable. In each group the coefficients of variation associ- ated with total height were less than i/s the magnitude of the coefficients for number of stems.
Although the plants varied widely in height, weight, wrapped diameter, number of stems and stubble height at 50% utilization, the general growth form or weight distribution was similar for all plants. Each segment weight became lighter as distance from ground level increased. Thus, there is a similarity in height-weight distribution of sideoats grama, a sod forming grass, and a bunch grass, such as little bluestem, as noted by McArthur (1951) .i The similarity of growth form among individual plants of the species was also noted by others (National Research Council, 1962).
Variation Among Groups of Plants: Significant differences among groups from each location for all measured variables were indicated by analyses of variance. Greater vari- ability occurred between groups than within groups for total heights,
wrapped diameters, numbers of stems and stubble heights at 50% utilization. Both sites and years affected these variables.
Group means and standard errors for total heights, numbers of stems, wrapped diameters and stubble heights at 50% utilization were cal- culated. Average heights ranged from 16.72 inches to 31.64 inches around the mean of 24.75 inches. Group means for stem numbers varied from 1.84 to 22.28 about the average of 11.84. Wrapped basal di- ameters varied by groups from 0.63 inches to 1.08 inches. The average basal diameter for all groups was 0.78 inch. Group means for stubble heights at 50 percent utilization ranged from 2.44 inches to 4.22 inches around the mean of 3.33 inches.
Correlation coefficients between the measured characteristics were determined on the basis of location and years. Coefficients for total height and number of stems were highly variable; however, in seven of the eight groups, they were posi- tive. A slight positive relationship existed between total height and wrapped diameter, although in only one group was it significant. A strong positive relationship was in- dicated between numbers of stems and wrapped diameters.
Correlation coefficients of total heights, wrapped diameters and numbers of stems with stubble heights at 50% utilization were de- termined. Total heights and stubble heights at 50% use exhibited a strong positive relationship. No con- sistent relationship existed between wrapped diameters and stubble heights at 50% use. Four groups ex-
hibited negative correlation coeffi- cients, none significant. All relation- ships were positive between num- bers of stems and stubble heights at
50% use.
In general all correlation coeffi- cients, including multiple correlation coefficients, tended to decrease slightly as utilization was increased. However, all multiple correlation co- efficients were positive and signifi- cant at the .Ol level.
Standard partial regression coeffi- cients were calculated for stubble heights on the three other variables. The coefficent for stubble height on total height was, at every level of use, at least 2.4 times greater than the standard partial regression coef- ficients of stubble height on wrapped diameter or on number of stems. Therefore, total height is at least 2.4 times more reliable than either wrapped diameter or number of stems for estimating stubble heighl at any level of utilization.
Estimating Utilization of Sideoats Grama from Regression Equations:
Because of the large areas in- volved, range forage use must be easily and rapidly measured if it is to have practical application. Since total height was at least 2.4 times better than any of the other vari- ables studied for estimating stubble height at any level of utilization, total height was the only variable used with stubble height in develop- ing regression equations to estimate sideoats grama utilization in the field.
Regression equations were deter- mined to measure relationships existing among all the variables. Ac- cording to the coefficients of deter-
mination in Table 3, the use of all variables permits the most accurate estimate of stubble height. However, the slight increase obtained in the coefficients of determination by the combinations of independent vari- ables over total height alone were not sufficient to justify the increased labor and time involved in applying the equations to range utilization. In Table 3 the independent variables are ranked according to their coeffi- cients of determination.
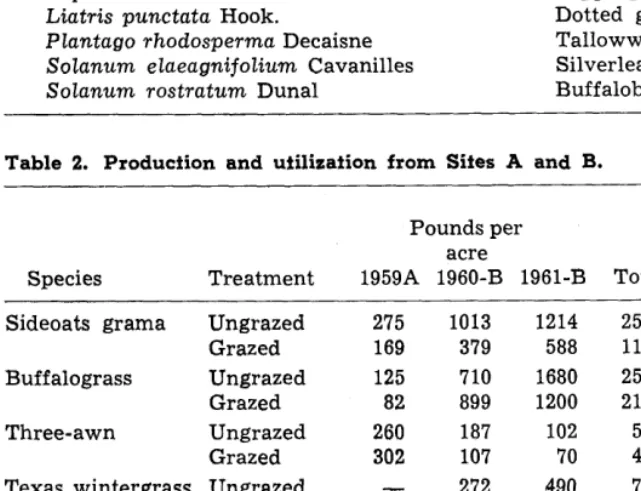
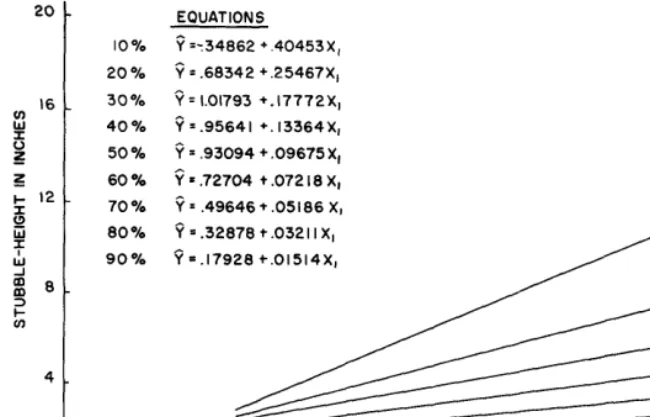
Equations were plotted represent- ing the relationship between stubble height at 10% increments of utiliza- tion and total height (Figure 1). These 9 equations were then com- bined into the following multiple regression e q u at i o n with which utilization in percent may be determined from measurements of total height and stubble height: U = 80.10 - 14.86Y + 0.02X2 + 0.61Y2, where U = utilization in percent; X = total height; and Y = stubble height.
Standard errors for the regression coefficients used above are:
14.86OOY + 0.15; 0.0187X2 + 0.0006; 0.6096Ys -c 0.0119.
Test of Method:
Twenty 4-inch by 4-inch samples of ungrazed sideoats grama sod were randomly chosen. Each was then given a number, clipped to simulate grazing and the stubble height mea- sured. Five experienced technicians estimated utilization on the 20 sam- ples. After the initial twenty esti- mates were made by each man, the sample numbers were changed. The five technicians then re-estimated utilization on the twenty samples in order to test repeatability by indi-
Table 3. Coefficienis of deierminafion (r2 or IF) between stubble height and fhe variables indicated af different
levels of ufilizafion.
Independent Variables Levels of Utilization in Percent
10 20 30 40 50 60 70 80 90
Total height .562(4)1 .607(4) .526(4) .487 (4) ,413 .376(4) .359 (4) .299(4) .327 (3) Wrapped diameter .018 .013 .009 .002 .004 .OOl .0002 .OOl .002
Number of stems .165 .173 .149 .123 .107 .092 .087 .071 .070
Total height and
wrapped diameter .567(3) .616(2) .540(2) .510(2) .438(Z) .421(2) .393(2) .334(2) .379(2) Total height and
number of stems .570(2) .613(3) .531(3) .490(3) .416(3) .377(3) .360 (3) .300(3) .327(3) Wrapped diameter &
number of stems .187 .206 .188 .169 .160 .173 .146 .135 .140 Total ht., wrapped
diameter & number
of stems .593(l) .643(l) .569(l) .533(l) .464(l) .454(l) .415(l) .360(l) .381(l) -_
I 0 % 20%
30 %
40%
50%
60%
70 %
80%
90%
EQUATIONS
? =:34862 +.40453X,
9 = .68342 +.25467X,
^v = 1.01793 +.17772X,
^v = .95641 +. 13364X,
^v = .93094 +.09675X,
? = .72704 + .072 I8 X,
9 = .49646 + .05186 X,
9 5.32878 + .0321 I X,
9 =.I7928 +.01514X,
10%
FIGURE 1. Regression equations for determining utilization from stubble height (Y) and total height measurements (XI.
vidual estimators. The remaining stubble of the 20 samples was then clipped. All clippings were air dried, weighed and utilization percentages computed.
Repeatability of estimate was quite varied both between men and be- tween plants. Only one man ex- hibited a high level of consistency on each sample. Two of the men overestimated utilization slightly both times, and one underestimated actual use both times. Average esti- mates exhibited a range of from 34 to 62% around the actual 45% utili- zation.
A highly significant interaction, men x times, indicated that the esti- mates of the men were not consistent at. different times. Also, a highly significant man x plants interaction indicated that the men were not con- sistent in their estimates on different plants. These interactions indicated that one man was not able to dupli- cate another man’s estimate to any appreciable extent, nor was the same man able to repeat his estimate on the same or different plants at dif- ferent times.
In almost every instance the esti- mate of percent utilization using the regression equation was closer to actual use than the estimate by any of the technicians. The average esti- mate of all plants, using the regres- sion equation, was 47%. This was nearer the actual 45 % utilization than 9 of the other 10 estimates and was as accurate as the nearest estimate of any of the 5 technicians using the
ocular-estimate-by-plant method. Thus, it may be concluded that the method of determining utilization of sideoats grama by the use of re- gression equations based on stubble height and total height is far more accurate than ocular estimates, even by trained technicians. In addition, the regression method is simple, rapid and easily applied; and exten- sive training and practice by the technicians is not a prerequisite to its use.
Method of Field Application: Estimations in the field, using the equation, requires only an ungrazed area on the same range site as that on which the degree of grazing use is desired. Care- ful measurement of the total height of 25 random ungrazed samples will give the average total height (X) . Average grazed height or stubble height (Y) may be obtained in the same manner. However, care should be exercised by the estimator to insure representative sampling on the grazed area. Distance from water, salt, shade and other fac- tors influencing grazing patterns should be considered. After the X and Y values (total height and stubble height) have been ob- tained, the percent utilization can be quickly determined from the equation stated above.
Summary
Proper utilization of range for- age is of paramount importance in securing maximum sustained yields. In measuring or estimat- ing forage use on any given area, some of the more important spe- cies are usually selected from the forage complex. Measurements or observations of these plants, known as key species, are used as indicators of total use on the particular range type.
The palatable, rhizomatous form of sideoats grama is the predominant type on the Rolling Plains of Texas, and was used to develop a rapid, accurate method of measuring utilization. From data collected on two shallow upland sites on the Roll- ing Plains of Texas, it was con- cluded that sideoats grama is a key species for indicating forage use.
Samples, 4 inches by 4 inches in area, of ungrazed sideoats grama sod were collected from four locations in each of 2 years. These samples were prepared for study by removing soil and for- eign matter, wrapping with string in cylindrical bundles and re- cording the total heights, num- bers of culms and wrapped basal diameters. The samples were then cut into l-inch segments and the segments oven dried and weighed to the nearest milli- gram. The data were then sub- jected to several statistical tests in order to obtain relationships and variations in growth form.
Individual samples of ungrazed sideoats grama sod exhibited considerable variation in total heights, wrapped diameters, numbers of culms and stubble heights at the 50% level of use. However, the general growth form was similar for all samples. The greatest portion of the weight was concentrated near the base of the plant and weight distribution was similar to that in bunch grasses.
wrapped diameter, number of height and stubble height were more rapid, accurate and reliable
stems and stubble height at 50% used as independent variables in than the ocular-estimate method
use) occurred between groups the regression equation devel-
commonly employed by skilled
from all locations for both years oped for field use. These vari- technicians.
of data collection,
ables, both easily measured, per-
LITERATURE CITEDCorrelation coefficients
and
standard partial regression co-
efficients indicated that total
height is at least 2.4 times more
reliable than any other of the
measured variables for estimat-
ing stubble height at any level
of utilization.
Regression equations permit-
ing the determination of stubble
height at different levels of use
from measurements of all mea-
sured variables were developed.
However, the increase in ac-
curacy was not sufficient to
justify an equation for field de-
termination. Therefore,
total
mit rapid, accurate estimates of
the percent utilization of sideoats
grama when used in the follow-
ing equation:
U = 80.10 - 14.86Y + .02X2 +
.61Y2, where U = utilization in
percent; X = total height; and
Y = stubble height.
The reliability -of the equation
was tested under field conditions
by comparing estimates of use on
samples clipped to various stub-
ble heights to simulate grazing.
These comparisons indicated that
the method of estimating forage
use based on measurements of
total height and stubble height is
GOULD, F. W. 1959. Notes on apomixis in sideoats grama. J. Range Man- age. 12: 25-28.
GOULD, F. W. AND Z. J. KAPODIA. 1964. Biosystematic studies in the Bouteloua curtipendula complex. II Taxonomy. Brittonia 16: 182-207. HEDRICK, D. W. 1958. Proper utiliza-
tion-a problem in evaluating the physical response of plants to grazing use: a review. J. Range Manage. 11: 34-43.
NATIONAL RESEARCH COUNCIL. 1962. Basic problems and techniques in range research. National Academy of Sciences, Publication No. 890. p. 114-119.
SNEDECOR, G. W. 1956. Statistical methods. The Iowa State College Press, Ames, Iowa, Fifth Edition. 534 p.
TECHNICAL
NOTES
Establishment of Firebreaks on Forest and Rangeland
with Herbicides1
R. W.
BOVEY~ AND M. K. MCCARTYResearch Agronomists; Crops Re- search Division, Agricultural Re- search Service, U.S.D.A., Department of Range and Forestry, Texas A&M University, College Station; and De- partment of Agronomy, University of Nebraska, Lincoln.
Highlight
Thirfy-one soil sferilant herbicides were investigated for fire-break es- iablishmenf in the Nebraska sand- hills. Diuron gave most effective vegeiafive control of all compounds tested.
A conventional method to limit fire spread on forest or rangeland is to cultivate a soil barrier around a designated area. In the Bessey Na- tional Forest in the Nebraska Sand- hills, one method of destroying un- wanted vegetation is by disking strips. This expensive operation ex- poses the sandy soil to severe wind and water erosion. Therefore, her- bicides were studied to eliminate or reduce tillage, and to reduce wind erosion by killing unwanted vegeta- tion with minimum soil disturbance.
Procedure
The herbicides and rates of treat- ment are shown in Table 1. All her- bicides were applied on May 31, 1961 except erbon and paraquat plus at- razine which were applied on June 12, 1961. The herbicides were sprayed with a hand boom sprayer on square- rod plots in triplicate using a ran- domized block design.
Atrazine at 7.5 and 15 lb/acre, dalapon plus atrazine at 3.75 and 7.5 lb/acre, simazine at 3.75, 7.5 and 15 lb/acre, and diuron at 3.75, 7.5 and 15 lb/acre were applied in water at 20 gal/acre. All remaining herbicides were applied in water at 160 gal/acre with the exception of the borate- monuron-TBA mixture (BMM) which was applied in pellet form.
IPublished with approval of the Di- rector as paper No. 1657, Journal Series, Nebraska Agricultural Ex- periment Station. Cooperative in- vestigations of the Crops Research Division, Agricultural Research Ser- vice, U.S.D.A. and the Nebraska Agricultural Experiment Station. 2Formerly Instructor, Department of