Selected inversion as key to a stable Langevin evolution across
the QCD phase boundary
JacquesBloch1,and OlafSchenk2
1University of Regensburg
2Università della Svizzera italiana, Lugano
Abstract.We present new results of full QCD at nonzero chemical potential. In PRD 92, 094516 (2015) the complex Langevin method was shown to break down when the inverse coupling decreases and enters the transition region from the deconfined to the confined phase. We found that the stochastic technique used to estimate the drift term can be very unstable for indefinite matrices. This may be avoided by using the full inverse of the Dirac operator, which is, however, too costly for four-dimensional lattices. The major breakthrough in this work was achieved by realizing that the inverse elements necessary for the drift term can be computed efficiently using the selected inversion technique
pro-vided by the parallel sparse direct solver package PARDISO. In our new study we show that no breakdown of the complex Langevin method is encountered and that simulations can be performed across the phase boundary.
1 Introduction
The lattice simulations of QCD at nonzero quark chemical potential are strongly hampered by the sign problem, caused by the complex fermion determinant. The complex Langevin (CL) method has drawn a lot of attention in recent years as a potential solution to this problem [1]. Nevertheless, careful studies have shown that the method can break down or, even worse, can converge to the wrong
solution, if the trajectories make excursions too far into the SL(3,C) plane or come too close to a
singularity of the drift [2,3]. Although conditions were derived that have to be satisfied for the CL solutions to be valid, the matching of these conditions can only be verified a posteriori. Therefore, it cannot be excluded that the violation of the validity condition is due to numerical inaccuracies rather than to a theoretical deficiency of the method for the model being considered.
The first successful application of the CL method to QCD was made in the heavy dense
approx-imation [4]. For full QCD, the method was shown to work correctly in the deconfined phase, when
the inverse couplingβis large enough; however, it breaks down whenβgets smaller and the system
crosses the phase boundary, such that no solutions are found in the confined phase [5]. Other studies
at largerβand larger volumes also seem to converge to incorrect solutions [6]. Recently there were
suggestions to modify the CL evolutions through dynamical stabilization [7] or deformation [8], but
the extrapolations needed to recover the original theory are not yet well controlled.
CL?
Figure 1. Sketch of the QCD phase diagram as a function of baryon chemical potential and temperature. The simulations of [5] are performed atµ/T =1 with decreasingβ, which follows the gray arrow across the roof of the phase transition.
Figure1 gives a sketch of the QCD phase diagram as a function of temperature and chemical
potential. The simulations reported by Fodor et al. [5] follow the gray arrow through the roof of the
phase transition; however, the CL simulations break down when crossing the phase boundary, and no results were found inside the confined phase. In these simulations, the temperature was lowered by decreasingβon an 83×4 lattice withµ/T =1 andm=0.05. For these parameter values the critical
temperature corresponds toβc≈5.04 atµ=0. The results for the Polyakov loop and its inverse, the
temporal and spatial plaquettes, the chiral condensate, and the quark number density published in [5]
are reproduced in Fig.2. In these plots the CL results are compared with data reweighted from the
µ =0 ensemble, however, CL results are only available forβ ≥5.1 as the CL simulations became
unstable below this value.
In this presentation we will show that the breakdown observed in [5] can be cured and stable CL
solutions can be found for smallerβwhen the drift is computed exactly, rather than being estimated
with stochastic techniques.
2 Complex Langevin for QCD
The lattice QCD partition function is given byZ=
V
x=1 d
ν=1
dUxν
exp[−Sg] detD(m;µ) (1)
with Wilson gauge actionSg, staggered Dirac operatorD, and links
Uxν=exp
i
8
a=1
zaxνλa
(2)
with Gell-Mann matricesλa and link parameterszaxν. After discretization of the Langevin time, the
CL evolution of the links in SL(3,C) is described by
Uxν(t+1)=Rxν(t)Uxν(t), (3)
where, in the stochastic Euler discretization,
Rxν=exp
i
a
λa(Kaxν+√ ηaxν)
CL?
Figure 1. Sketch of the QCD phase diagram as a function of baryon chemical potential and temperature. The simulations of [5] are performed atµ/T =1 with decreasingβ, which follows the gray arrow across the roof of the phase transition.
Figure1 gives a sketch of the QCD phase diagram as a function of temperature and chemical
potential. The simulations reported by Fodor et al. [5] follow the gray arrow through the roof of the
phase transition; however, the CL simulations break down when crossing the phase boundary, and no results were found inside the confined phase. In these simulations, the temperature was lowered by
decreasingβon an 83×4 lattice withµ/T =1 andm=0.05. For these parameter values the critical
temperature corresponds toβc≈5.04 atµ=0. The results for the Polyakov loop and its inverse, the
temporal and spatial plaquettes, the chiral condensate, and the quark number density published in [5]
are reproduced in Fig.2. In these plots the CL results are compared with data reweighted from the
µ =0 ensemble, however, CL results are only available forβ ≥ 5.1 as the CL simulations became
unstable below this value.
In this presentation we will show that the breakdown observed in [5] can be cured and stable CL
solutions can be found for smallerβwhen the drift is computed exactly, rather than being estimated
with stochastic techniques.
2 Complex Langevin for QCD
The lattice QCD partition function is given byZ =
V
x=1 d
ν=1
dUxν
exp[−Sg] detD(m;µ) (1)
with Wilson gauge actionSg, staggered Dirac operatorD, and links
Uxν=exp
i
8
a=1
zaxνλa
(2)
with Gell-Mann matricesλaand link parameterszaxν. After discretization of the Langevin time, the
CL evolution of the links in SL(3,C) is described by
Uxν(t+1)=Rxν(t)Uxν(t), (3)
where, in the stochastic Euler discretization,
Rxν=exp
i
a
λa(Kaxν+ √ ηaxν)
∈SL(3,C), (4)
0 0.05 0.1 0.15 0.2 0.25 0.3
4.8 4.9 5 5.1 5.2 5.3 5.4
β
83*4 lattice µ/T=1.0 mass=0.05 NF=4
reweighted from µ=0
CLE simulation instable
inverse Polyakov loop CLE inv. Polyakov reweighting Polyakov loop CLE Polyakov reweighting
0.38 0.4 0.42 0.44 0.46 0.48 0.5 0.52 0.54 0.56 0.58
4.8 4.9 5 5.1 5.2 5.3 5.4
β
83*4 lattice
µ/T=1.0 mass=0.05 NF=4
reweighted from µ=0
CLE simulation instable
temporal plaquettes CLE temp plaq. reweighting spatial plaquettes CLE spatial plaq. reweighting
-0.05 0 0.05 0.1 0.15 0.2 0.25 0.3 0.35
4.8 4.9 5 5.1 5.2 5.3 5.4
β
83*4 lattice µ/T=1.0 mass=0.05 NF=4
reweighted from µ=0
CLE simulation instable
chiral cond CLE c.c. reweighting n/nsat CLE
n/nsat reweighting
Figure 2.Reproduction of Figs. 6 and 7 of [5] showing results for the Polyakov loop and its inverse, the temporal and spatial plaquettes, and the chiral condensate and quark number density versusβon an 83×4 lattice atµ/T =1
andm=0.05. The CL results are compared with those obtained with reweighting from theµ=0 ensemble. For β <5.1, no CL results are shown as the CL method became unstable.
with Langevin stepand Gaussian noiseηaxν. The evolution is driven by the drift
Kaxν=−∂axνS =Kaxgν+Kaxf ν (5)
with complex actionS =Sg−log detD. In the following we will focus on the fermionic drift,
Kf axν=Tr
D−1∂ax
νD
, (6)
where∂axνDis the partial derivative ofDwrt the variableszaxν.
3 Fermionic drift term and selection inversion
When looking at the breakdown of the CL method in [5] it is not immediately clear if the violation of
the CL validity conditions is genuine or rather due to numerical approximations.
The traces in the fermionic drift (6) involve the inverse Dirac operator. Computing the full inverse, for example, with Lapack, is too expensive for four-dimensional QCD, both in terms of CPU time and
storage space. Until now, the explicit computation ofD−1was avoided by usingstochastic estimators
for the traces,
Tr[D−1∂ax
νD]≈η†D−1∂axνDη. (7)
Although the merit of this technique is undisputed for positive-definite matrices, it can be problematic
when applied toindefinitematrices, as the number of noise vectors needed to get a good and stable
estimate may be extremely large. As current CL algorithms typically estimate traces using a single
noise vector, they rely on choosing tiny, such that consecutive CL steps are highly correlated and
effectively provide an improved estimator to the trace after many Langevin steps. A potential danger
is that this strategy maydestabilizethe discrete time evolution beyond repair.
To clarify this situation we decided to investigate how using exact traces affects the stability of
the CL evolution. As already mentioned, the exact traces require the inverse of the Dirac matrix, which is too costly to compute in full. Below we will analyze the drift term further and show that a
relatively new numerical method, calledselected inversion, can be used to compute the drift exactly,
while saving CPU time and storage space. This method also allows us to use a larger, as the very
smallvalues used before were only needed to stabilize the drift when using the stochastic technique.
Consider the fermionic driftKf
axνof Eq. (6). The derivative matrix∂axνDis zero except for two
dense
D−1
×
F
B
∂axνD
x x+νˆ
x
x+νˆ
Kf axν=Tr
In the matrix product the sparse derivative matrix effectively selects out the two corresponding
columns ofD−1such that this can be rewritten as
D−1
Cx Cx+ˆν
×
F
B
∂axνD
x x+νˆ
x
x+νˆ
Kf axν=Tr
whereCx+νˆ×BandCx×F, respectively, give the columnsxandx+νˆofD−1∂axνD. Only two 3×3
blocks ofD−1contribute to the trace of this matrix product, so this simplifies further to
P
Q
D−1
x x+νˆ
×
F
B
∂axνD
x x+νˆ
x
x+νˆ
Kf axν=Tr
Each drift term can thus be written as
Kf
axν=Tr(P·B)+Tr(Q·F) (8)
and, hence, the computation of the driftonly requires elements of D−1where D itself is nonzero. Note
dense D−1 × F B
∂axνD
x x+νˆ
x
x+νˆ
Kf axν=Tr
In the matrix product the sparse derivative matrix effectively selects out the two corresponding
columns ofD−1such that this can be rewritten as
D−1
Cx Cx+ˆν
× F B
∂axνD
x x+νˆ
x
x+νˆ
Kf axν=Tr
whereCx+νˆ×BandCx×F, respectively, give the columnsxandx+νˆofD−1∂axνD. Only two 3×3
blocks ofD−1contribute to the trace of this matrix product, so this simplifies further to
P Q D−1
x x+νˆ
× F B
∂axνD
x x+νˆ
x
x+νˆ
Kf axν=Tr
Each drift term can thus be written as
Kf
axν=Tr(P·B)+Tr(Q·F) (8)
and, hence, the computation of the driftonly requires elements of D−1where D itself is nonzero. Note
that, the same statement holds for the computation of the fermionic observables.
0.001 0.01 0.1 1 10 100 1000 10000
10 100 1000 10000
wall-clock time (s)
lattice volume sel.inv. (Pardiso)
full (Lapack) 100xstoch(Pardiso)
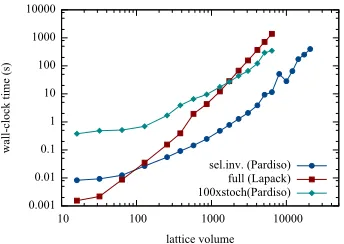
Figure 3. Comparison of the wall-clock time versus lattice volume for one selected inversion of Pardiso, one full Lapack inversion, and 100 single-source inversions (also performed with the sparse Pardiso solver) for the stochastic trace estimator.
This observation is what brought us to consider the selected inversion technique to compute the drift term. The method consists of a sparse LU-factorization followed by a selected inversion, which exactlycomputesselectedelements of the inverseD−1of a general matrixD. The subset of selected
elements is defined by the set ofnonzero entriesin D. The method is based on the fact that this
specific subset of D−1 can be evaluated without computing any inverse entry from outside of the
subset. This is what substantially speeds up the computation compared to routines computing the full inverse. Moreover, as only the inverse elements of this subset are computed, they can be stored in
sparse format. The parallel implementation of the selected inversion technique, as described in [9],
can be found in the latest version of the parallel sparse direct solver PARDISO [10].
It is worthwhile to note that the selected inversion method is optimally used in the CL evolution,
as the selected inversion method precisely yields all the elements ofD−1needed for the drift terms
and for the fermionic observables.
In contrast to the stochastic technique, the selected inversion allows us to compute the drift exactly,
and this in a way that is much more efficient than Lapack, both in terms of CPU times and storage
space. In Fig.3we compare the scaling of the wall-clock time between the selected inversion from
PARDISO, the full Lapack inversion, and the stochastic technique (where we used 100 intermediate steps due to the smaller choice ofas explained after (7)) as a function of the lattice volume. There is
a clear performance gain when using the selected inversion, which is a factor of 100 compared to the
Lapack dense inverse for a lattice size of 84. The comparison with the stochastic technique is more
delicate as the stability of the CL evolution can be affected by the latter and merely comparing timings
does not tell the whole story.
The volume scaling of the selected inversion seems to be somewhat better thanN3. From other
applications, the selected inverse is known to scale likeN2for three-dimensional problems, however,
as this is the first application to a four-dimensional problem the scaling has to be investigated further.
4 Results
4.1 CL evolution for varyingβ
In this section we present the first results of the CL method using the selected inversion. The simu-lations were performed on the Xeon cluster at the ICS, Lugano. We performed the same study as in
[5] and investigate QCD across the phase boundary as sketched in Fig.1, decreasing the temperature
0 0.05 0.1 0.15 0.2 0.25 0.3
4.6 4.7 4.8 4.9 5 5.1 5.2 5.3 5.4
β
ploop inv-ploop
0.4 0.42 0.44 0.46 0.48 0.5 0.52 0.54 0.56 0.58
4.6 4.7 4.8 4.9 5 5.1 5.2 5.3 5.4
β
t-plaq s-plaq
0 0.05 0.1 0.15 0.2 0.25 0.3 0.35
4.6 4.7 4.8 4.9 5 5.1 5.2 5.3 5.4
β
cc n/nsat
Figure 4.Results of CL evolution with selected inversion for the Polyakov loop and inverse Polyakov loop (left), temporal and spatial plaquettes (middle), and chiral condensate and quark number density (right) as a function of
βform=0.05 andµ=0.25 on an 83×4 lattice.
withm = 0.05 (βc ≈ 5.04 atµ = 0). Whereas the CL method broke down belowβ = 5.1 in the
original study, we are now able to generate stable CL trajectories for all investigatedβvalues without
any further tuning. Moreover, this was done using =0.001, which is much larger than before. The
length of the trajectories is 30 Langevin time (Lt) of which 5 Lt are discarded as thermalization. From
the results, shown in Fig.4, we see that the simulations perform well across the phase boundary, and
the complete range fromβ=5.45 toβ=4.6 can be simulated without any problem. The numerical
implementation includes gauge cooling, to avoid excessive excursions in SL(3,C), and an adaptive
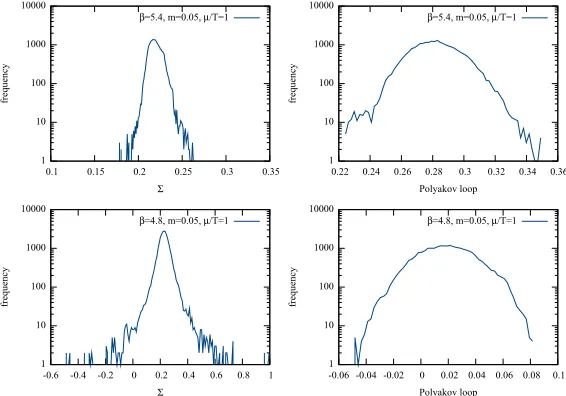
step size such that the continuum trajectory is properly followed, even when the drift is large. The fact that a stable solution is found does not necessarily mean that it is correct, as the CL method can converge to the wrong solution in some instances. In order to validate the CL results we
show the histograms for the chiral condensate and the Polyakov loop forβ = 5.4 andβ = 4.8, in
Fig.5. The CL results are only to be trusted if the tails of the histograms decay exponentially. For
the chiral condensate it seems that the validity might be problematic forβ =4.8, as the tails of the
histogram are somewhat broad, but even forβ=5.4 the exponential decay in the tails is not so clear,
even though the results agree with the reweighting results. The histograms for the Polyakov loop look
1 10 100 1000 10000
0.1 0.15 0.2 0.25 0.3 0.35
frequency
Σ β=5.4, m=0.05, µ/T=1
1 10 100 1000 10000
0.22 0.24 0.26 0.28 0.3 0.32 0.34 0.36
frequency
Polyakov loop
β=5.4, m=0.05, µ/T=1
1 10 100 1000 10000
-0.6 -0.4 -0.2 0 0.2 0.4 0.6 0.8 1
frequency
Σ β=4.8, m=0.05, µ/T=1
1 10 100 1000 10000
-0.06 -0.04 -0.02 0 0.02 0.04 0.06 0.08 0.1
frequency
Polyakov loop
β=4.8, m=0.05, µ/T=1
0 0.05 0.1 0.15 0.2 0.25 0.3
4.6 4.7 4.8 4.9 5 5.1 5.2 5.3 5.4
β ploop inv-ploop 0.4 0.42 0.44 0.46 0.48 0.5 0.52 0.54 0.56 0.58
4.6 4.7 4.8 4.9 5 5.1 5.2 5.3 5.4
β t-plaq s-plaq 0 0.05 0.1 0.15 0.2 0.25 0.3 0.35
4.6 4.7 4.8 4.9 5 5.1 5.2 5.3 5.4
β
cc n/nsat
Figure 4.Results of CL evolution with selected inversion for the Polyakov loop and inverse Polyakov loop (left), temporal and spatial plaquettes (middle), and chiral condensate and quark number density (right) as a function of
βform=0.05 andµ=0.25 on an 83×4 lattice.
withm = 0.05 (βc ≈ 5.04 atµ = 0). Whereas the CL method broke down belowβ = 5.1 in the
original study, we are now able to generate stable CL trajectories for all investigatedβvalues without
any further tuning. Moreover, this was done using =0.001, which is much larger than before. The
length of the trajectories is 30 Langevin time (Lt) of which 5 Lt are discarded as thermalization. From
the results, shown in Fig.4, we see that the simulations perform well across the phase boundary, and
the complete range fromβ=5.45 toβ=4.6 can be simulated without any problem. The numerical
implementation includes gauge cooling, to avoid excessive excursions in SL(3,C), and an adaptive
step size such that the continuum trajectory is properly followed, even when the drift is large. The fact that a stable solution is found does not necessarily mean that it is correct, as the CL method can converge to the wrong solution in some instances. In order to validate the CL results we
show the histograms for the chiral condensate and the Polyakov loop forβ = 5.4 andβ = 4.8, in
Fig.5. The CL results are only to be trusted if the tails of the histograms decay exponentially. For
the chiral condensate it seems that the validity might be problematic forβ=4.8, as the tails of the
histogram are somewhat broad, but even forβ=5.4 the exponential decay in the tails is not so clear,
even though the results agree with the reweighting results. The histograms for the Polyakov loop look
1 10 100 1000 10000
0.1 0.15 0.2 0.25 0.3 0.35
frequency
Σ β=5.4, m=0.05, µ/T=1
1 10 100 1000 10000
0.22 0.24 0.26 0.28 0.3 0.32 0.34 0.36
frequency
Polyakov loop
β=5.4, m=0.05, µ/T=1
1 10 100 1000 10000
-0.6 -0.4 -0.2 0 0.2 0.4 0.6 0.8 1
frequency
Σ β=4.8, m=0.05, µ/T=1
1 10 100 1000 10000
-0.06 -0.04 -0.02 0 0.02 0.04 0.06 0.08 0.1
frequency
Polyakov loop
β=4.8, m=0.05, µ/T=1
Figure 5.Histogram of the chiral condensate (left) and Polyakov loop (right) forβ=5.4 (top row) andβ=4.8 (bottom row) form=0.05 andµ=0.25 on an 83×4 lattice.
0 0.01 0.02 0.03 0.04 0.05 0.06 0.07 0.08 0.09 0.1 0.11
0 0.2 0.4 0.6 0.8 1 1.2 1.4 1.6 Nt=4, T=162 MeV
aµ ploop inv-ploop µ=0 0.44 0.445 0.45 0.455 0.46 0.465
0 0.2 0.4 0.6 0.8 1 1.2 1.4 1.6 Nt=4, T=162 MeV
aµ t-plaq s-plaq µ=0 0 0.1 0.2 0.3 0.4 0.5 0.6 0.7 0.8 0.9 1
0 0.2 0.4 0.6 0.8 1 1.2 1.4 1.6 Nt=4, T=162 MeV
aµ
cc n/nsat cc at µ=0
-0.01 -0.005 0 0.005 0.01 0.015 0.02
0 0.2 0.4 0.6 0.8 1 1.2 1.4 1.6 Nt=8, T=81 MeV
aµ ploop inv-ploop 0.44 0.445 0.45 0.455 0.46 0.465
0 0.2 0.4 0.6 0.8 1 1.2 1.4 1.6 Nt=8, T=81 MeV
aµ t-plaq s-plaq 0 0.1 0.2 0.3 0.4 0.5 0.6 0.7 0.8 0.9 1
0 0.2 0.4 0.6 0.8 1 1.2 1.4 1.6 Nt=8, T=81 MeV
aµ
cc n/nsat
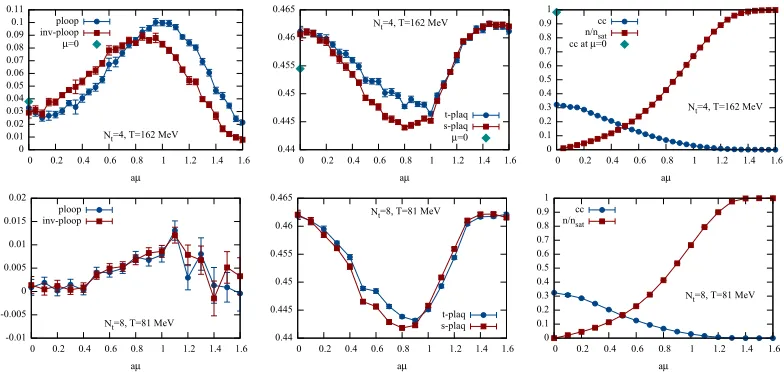
Figure 6. Observables forNt =4 (top) andNt =8 (bottom): Polyakov loop and inverse Polyakov loop (left),
temporal and spatial plaquettes (middle), chiral condensate and quark number density (right) as a function ofµ
forβ=5.0 andm=0.05. The exactµ=0 results forNt=4 were provided by Denes Sexty.
fine so far. From these data we conclude that the results may be incorrect below the phase transition, even though the histograms do not give a clear cut way to validate or invalidate CL measurements.
4.2 CL evolution for varyingµ
As we found stable CL evolutions when decreasingβthrough the phase boundary, we also performed
a partial study of the phase diagram and investigated QCD for varyingµat two values of the
tem-perature. We choseβ= 5.0 andm = 0.05 for which the pion mass isamπ =0.5588±0.0002 and
a=(0.3045±0.0001) fm, such thatmπ ≈362 MeV. We work on an 83×Ntlattice and consider
tem-poral extentsNt=4 andNt=8, corresponding toT =161.74 MeV andT =80.87 MeV, respectively.
In Fig.6we show the results for the various observables as a function ofµfor both temperatures.
Although the results do not show any conspicuous behavior, there are no other results to compare
with when the sign problem becomes large at nonzeroµ. One value that can easily be checked is the
value atµ =0 as it can be computed using standard importance sampling method. From the figure
it is clear that the chiral condensate and even the plaquette measured from the CL simulations is
incorrect forµ=0, even though they result from a convergent CL evolution. Forµ=0 the Langevin
evolution should be real, and the wrong result is merely due to numerical inaccuracies. This is in fact easily remedied by reunitarizing the links after each Langevin step; however, we decided against
this to be consistent with theµ 0 simulations. It is interesting to note that the measurements at
nonzero chemical potential smoothly connect to the wrongµ=0 value, and so we expect all of them
to be incorrect. This argument is further supported through the lack of Silver Blaze phenomenon, as
one would have expected a very slowµ-evolution of the observables up to the phase transition. The
validity of the CL results can again be verified using the histograms of the measured observables. The
histograms are very similar to those of the bottom row of Fig.5: that of the chiral condensate does
not seem to have the required exponential falloff, while that of the Polyakov loop does not show a
5 Summary and outlook
In this presentation we have argued that the breakdown of the CL method at the QCD phase boundary observed in [5] is in fact a numerical artifact due to the stochastic estimation of the drift. To compute the drift exactly, one needs the exact inverse of the Dirac operator, which cannot be computed in full with standard direct methods because it is too expensive in terms of both computer time and storage. However, we showed that the drift and the fermionic observables only require those elements of the inverse Dirac operator at the positions where the Dirac operator itself is filled, and, therefore, the selected inversion method, implemented in the sparse direct solver library PARDISO, can be applied. This allows for the exact computation of the drift term in a much faster way, using little storage space. We observed that the Langevin evolution became stable and convergent when the exact drift term was used. This allowed us to study the QCD phase transition across the roof of the phase diagram, i.e.,
when decreasing temperature from the deconfined to the confined phase at constantµ/T =1.
More-over, we were able to measure QCD observables as a function ofµat two values of the temperature
below the deconfinement temperature.
Although these are preliminary results, there are clear indications that the CL results obtained at small mass in the confined region are incorrect, even though they are stable. There is therefore a need for further investigation of these CL results to understand if the validity problems are of a fundamental or numerical nature. The fact that we now get stable CL trajectories should allow us to dig deeper into this problem and to search for improved methods.
Acknowledgments
This work was supported by the DFG collaborative research center SFB/TRR-55. We would like to thank Falk
Bruckmann and Piotr Korcyl for useful discussions, Denes Sexty for providing the zeroµdata, Radim Janalík
for helping with the computer resources, and the ICS, Lugano for providing computing time for the simulations.
References
[1] G. Aarts, PoSLATTICE2012, 017 (2012),1302.3028
[2] G. Aarts, F.A. James, E. Seiler, I.O. Stamatescu, Eur. Phys. J.C71, 1756 (2011),1101.3270
[3] K. Nagata, J. Nishimura, S. Shimasaki, Phys. Rev.D94, 114515 (2016),1606.07627
[4] D. Sexty, Phys. Lett.B729, 108 (2014),1307.7748
[5] Z. Fodor, S.D. Katz, D. Sexty, C. Török, Phys. Rev.D92, 094516 (2015),1508.05260
[6] D.K. Sinclair, J.B. Kogut, PoSLATTICE2016, 026 (2016),1611.02312
[7] B. Jäger,Improved convergence of Complex Langevin simulations, inProceedings, 35rd
Inter-national Symposium on Lattice Field Theory (Lattice 2017), Granada, Spain(2017)
[8] S. Shimasaki, K. Nagata, J. Nishimura, Complex Langevin simulation of QCD at finite
den-sity and low temperature using the deformation technique, inProceedings, 35rd International
Symposium on Lattice Field Theory (Lattice 2017), Granada, Spain(2017)
[9] A. Kuzmin, M. Luisier, O. Schenk, Fast Methods for Computing Selected Elements of the
Green’s Function in Massively Parallel Nanoelectronic Device Simulations, inEuro-Par 2013
Parallel Processing: 19th International Conference, Aachen, Germany, August 26-30, 2013.
Proceedings, edited by F. Wolf, B. Mohr, D. an Mey (Springer Berlin Heidelberg, Berlin,
Heidelberg, 2013), pp. 533–544, ISBN 978-3-642-40047-6,http://dx.doi.org/10.1007/
978-3-642-40047-6_54