Drug Design, Development and Therapy 2017:11 1163–1174
Drug Design, Development and Therapy
Dove
press
submit your manuscript | www.dovepress.com 1163
O r i g i n a l r e s e a r c h
open access to scientific and medical research
Open access Full Text article
Justification of disintegration testing beyond
current FDa criteria using in vitro
and in silico
models
Lukas Uebbing1,2,*
lukas Klumpp1,3,*
Gregory K Webster4
Raimar Löbenberg1
1Faculty of Pharmacy and
Pharmaceutical Sciences, Katz Group-Rexall Centre for Pharmacy and Health Research, University of Alberta, Edmonton, Canada; 2institute
of Pharmacy and Biochemistry, Johannes Gutenberg University, Mainz, 3Institute of Pharmaceutical
Technology, goethe University Frankfurt, Frankfurt, Germany; 4Global
Research and Development, AbbVie inc., north chicago, il, Usa
*These authors contributed equally to this work
Abstract: Drug product performance testing is an important part of quality-by-design approaches, but this process often lacks the underlying mechanistic understanding of the complex interactions between the disintegration and dissolution processes involved. Whereas a recent draft guideline by the US Food and Drug Administration (FDA) has allowed the replacement of dissolution testing with disintegration testing, the mentioned criteria are not globally accepted. This study provides scientific justification for using disintegration testing rather than dissolution testing as a quality control method for certain immediate release (IR) formulations. A mechanistic approach, which is beyond the current FDA criteria, is presented. Dissolution testing via United States Pharmacopeial Convention Apparatus II at various paddle speeds was performed for immediate and extended release formulations of metronidazole. Dissolution profile fitting via DDSolver and dissolution profile predictions via DDDPlus™ were performed. The results showed that Fickian diffusion and drug particle properties (DPP) were responsible for the dissolution of the IR tablets, and that formulation factors (eg, coning) impacted dissolution only at lower rotation speeds. Dissolution was completely formulation controlled if extended release tablets were tested and DPP were not important. To demonstrate that disintegration is the most important dosage form attribute when dissolution is DPP controlled, disintegration, intrinsic dissolution and dissolution testing were performed in conventional and disintegration impacting media (DIM). Tablet disintegration was affected by DIM and model fitting to the Korsmeyer–Peppas equation showed a growing effect of the formulation in DIM. DDDPlus was able to predict tablet dissolution and the intrinsic dissolu-tion profiles in convendissolu-tional media and DIM. The study showed that disintegradissolu-tion has to occur before DPP-dependent dissolution can happen. The study suggests that disintegration can be used as performance test of rapidly disintegrating tablets beyond the FDA criteria. The scientific criteria and justification is that dissolution has to be DPP dependent, originated from active pharmaceutical ingredient characteristics and formulations factors have to be negligible.
Keywords: API, dissolution, disintegration, DDDPlus, quality-by-design, product specifica-tion, model fitting
Introduction
Quality-by-design (QbD) approaches aim to utilize the most appropriate performance or quality control tests for a drug product.1,2 Still, the critical quality attributes (CQAs) are
often more based on empirical values and guidelines, instead of understanding mecha-nistic processes and excipient-active pharmaceutical ingredient (API) interactions.
The ICH Guideline Q6A “Specifications: Test Procedures and Acceptance Criteria for New Drug Substances and New Drug Products: Chemical Substances” outlines acceptance criteria for different dosage forms and routes of administration. The guidance
Correspondence: Raimar Löbenberg Faculty of Pharmacy and Pharmaceutical Sciences, Katz Group-Rexall Centre for Pharmacy and Health Research, University of Alberta, 11361–87 Avenue, Room 3-142-K, Edmonton AB T6g 2e1, canada
Tel +1 780 492 1255
email [email protected]
Journal name: Drug Design, Development and Therapy Article Designation: Original Research
Year: 2017 Volume: 11
Running head verso: Uebbing et al Running head recto: Disintegration testing DOI: http://dx.doi.org/10.2147/DDDT.S131213
Drug Design, Development and Therapy downloaded from https://www.dovepress.com/ by 118.70.13.36 on 21-Aug-2020
For personal use only.
Number of times this article has been viewed
This article was published in the following Dove Press journal: Drug Design, Development and Therapy
Dovepress
Uebbing et al
document contains decision tree #7.1, which allows disin-tegration instead of dissolution testing to be used as a performance/quality control test for rapidly dissolving dos-age forms (Q80% in 15 minutes) containing highly soluble drugs (BCS class I/III), if a relationship between dissolution and disintegration has been established.3
The new United States Pharmacopeial Convention (USP) Chapter ,2 “Oral drug products – Product quality test”4
follows the ICH guidance criteria and states under specific tests for tablets (excerpt of the original text):
The disintegration test, if included, is used only as a quality control test and not as a product performance test and should conform with the specifications in the monograph.4
The US Food and Drug Administration (FDA) draft guid-ance on “Specification Criteria for Immediate-Release Solid Oral Dosage Forms Containing Biopharmaceutics Classifica-tion System (BCS) Class 1 and 3 Drugs” allows the use of disintegration testing as a surrogate for routine release and stability dissolution testing for rapidly dissolving BCS class I/III drug products (Q=80% in 15 minutes). The acceptance criterion is disintegration within 5 minutes in 0.01M HCl.5
The current FDA guidance on “Dissolution Testing of Immediate Release Dosage Forms”, which the new draft will supersede, suggests a single-point dissolution tests specifica-tion of “Q=80% in 60 minutes” as a replacement for dissolu-tion testing for rapidly dissolving BCS class I/III drugs.6
In industry, there is little consensus on how to apply these guidelines. Many companies simply default to dissolution testing rather than justify disintegration as the easiest path forward for a global product. However, with a better mecha-nistic understanding and knowledge of critical parameters in the dissolution process, this aversion can be avoided. A modeling-based approach is needed to justify important product specifications and support CQA beyond guideline assumptions. This will enable globally operating companies to justify their product specifications beyond sometimes contradicting national guidances.
In this study, metronidazole, a BCS class I drug, was chosen as the model API.7 Four different formulations were
tested, with two being fast disintegrating, immediate release (IR#1 and IR#2) tablets, and the other two formulated for a slow erosion and drug release (slow eroding tablet [SET] and granulated tablet [GT]). API and excipient interactions were investigated using model fitting and computer simula-tions of the obtained dissolution profiles. The influence of disintegration on API-controlled dissolution was studied using new disintegration impacting media (DIM).
This study mechanistically investigated disintegration and dissolution behavior of different formulations. Model fitting was utilized in order to differentiate between API and formulation controlled drug release. This approach enables formulation scientists to identify CQAs for IR tablets. Disintegration testing might be used if drug particle properties (DPP) control dissolution. This was confirmed by simulations using DDDPlus software. Dissolution test-ing is required if the formulation significantly controls the dissolution process. This approach goes beyond the current FDA criteria for IR tablets and provides scientific justifica-tion for using disintegrajustifica-tion instead of dissolujustifica-tion testing in a QbD environment.
Materials and methods
Materials
Metronidazole (for tablets and quantification standard) was purchased from Medisca® (Richmond, BC, Canada; LOT
601124/C). Microcrystalline cellulose (Avicel® PH-102 NF;
for IR#2 formulation) was obtained from FMC Biopolymer (Philadelphia, PA, USA). Microcrystalline cellulose NF, dicalcium phosphate dihydrate NF (for IR#1 formulation) and croscarmellose sodium were purchased from PCCA Canada (London, ON, Canada). Galen IQ™ 801 was obtained from BENEO-Palatinit GmbH (Mannheim, Germany) and mag-nesium stearate from H.L. Blachford Ltd (Mississauga, ON, Canada; IR#1) and Street Chemicals & Co (Montreal, QC, Canada; IR#2). Mannitol was purchased from EM Science (Gibbstown, NJ, USA), Starch 1500 from Colorcon (India-napolis, IN, USA), Povidone K30 “Kollidon® 30” from BASF
(Mt Olive, NJ, USA) and sodium carbonate (anhydrous) was obtained from BDH Inc. (Toronto, ON, Canada). Ethanol was obtained from GreenField Specialty Alcohols Inc. (Brampton, ON, Canada).
Buffer media for dissolution testing were prepared according to USP specifications for acetate buffer pH 4.5 and SGFsp (simulated gastric fluid sine pepsin).4 Sodium
acetate trihydrate was purchased from Caledon Laborato-ries Ltd (Georgetown, ON, Canada) and glacial acetic acid USP, hydrochloric acid NF and sodium chloride USP were purchased from Fisher Scientific (Fair Lawn, NJ, USA). For the sugar solutions, Rogers Granulated Sugar from Lantic Inc. (Montreal, QC, Canada) was used. High-performance liquid chromatography (HPLC) grade water and water for the dissolution and disintegration test media were generated in an Elgastat Maxima UF and an Elgastat Option 3B water purifier by ELGA Laboratories Ltd. (Mississauga, ON, Canada) and filtered through a 0.45 µm membrane MCE
Drug Design, Development and Therapy downloaded from https://www.dovepress.com/ by 118.70.13.36 on 21-Aug-2020
Dovepress Disintegration testing
filter by Fisher Scientific (Pittsburgh, PA, USA; for immer-sion media) and a Durapore® 0.22 µm GV filter by Millipore
Canada Ltd. (Etobicoke, ON, Canada; for HPLC mobile phase), respectively. Acetonitrile for the HPLC mobile phase was purchased from VWR International LLC. (Radnor, PA, USA) and filtered through a Durapore 0.45 µm HV filter by Millipore Canada Ltd. (Etobicoke, ON, Canada).
Methods
TabletsTablets were pressed with a Carver Laboratory Press by Fred S Carver Inc. Hydraulic Equipment (Manomonee Falls, WI, USA). Direct compression IR tablets (IR#1 and IR#2) were pressed at 1 metric ton pressure for 30 seconds, after blend-ing the formulation blend-ingredients (Tables 1 and 2) in a rotatblend-ing blender by Erweka GmbH (Heusenstamm, Germany) for 30 minutes. These parameters had previously been established as a starting point that usually provided tablets of adequate quality in this group.8 Direct compression SETs (Table 3) were pressed
for 1 minute at 1 metric ton pressure. The granulate for the GTs (Table 4) was prepared by adding ~5 mL of 70% ethanol to about 11 g of intragranular formulation mix, granulating through a No 20 sieve, drying in vacuum at 45°C and siev-ing the granulate through a No 20 sieve, onto a No 40 sieve. Magnesium stearate was then added as lubricant and the tablets were pressed for at 1 metric ton pressure for 30 seconds.
Dissolution and disintegration testing
The pH of the dissolution and disintegration media was measured using an accumet® XL 20 pH-meter by Fisher
Scientific (Fair Lawn, NJ, USA). Dissolution testing was performed using a VK 7020 system from Varian Inc. (Cary, NC, USA) equipped with 70 µm Full Flow™ Filters (Varian Inc.), since smaller pore sizes proved to be problematic with the more viscous DIM, and a VK 8000 auto sampler (Varian Inc.). All tests were performed with USP Apparatus 2 and 900 mL dissolution medium (SGFsp, acetate buffer USP pH 4.5, 10%/20%/30% sucrose solution). SGFsp and acetate buffer were deaerated by filtration, ultrasound and vacuum. Samples
(1.0 mL) were withdrawn without replacement at each time point (5, 10, 15, 20, 30, 45 and 60 minutes) and were trans-ferred into 2.5 mL vials for HPLC analysis. The drug concen-tration in the vessel was adjusted by calculation.
Disintegration testing was performed in an ED-2L disin-tegration tester by Electrolab India Pvt. Ltd. (Navi-Mumbai, India) in the same media as the dissolution tests according to USP standards.4
Intrinsic dissolution testing was performed in the same media as the dissolution tests using a modified version of the rotating disk apparatus described in USP Chapter ,1087.4
Approximately 160–170 mg were pressed into the die to be used as a rotating disk apparatus using the Carver Labora-tory Press at 2 metric tons pressure for 90 seconds. The apparatus was mounted in a type RZR50 stirrer by Caframo Ltd. (Wiarton, ON, Canada) and immersed in a beaker con-taining 100 mL dissolution medium, with the temperature being kept constant at 37°C±0.5°C by a hot water bath. The test was performed at 100 rpm and 1.0 mL samples were drawn using a BD 1 mL syringe (Franklin Lakes, NJ, USA) and transferred into HPLC vials for analysis by filtering them through a 13 mm syringe filter with a 0.2 µm PTFE membrane by VWR International LLC (Radnor, PA, USA). SGFsp and acetate buffer were deaerated by filtration, ultra-sound and vacuum.
HPLC
The standard solution for HPLC quantification of met-ronidazole was prepared by dissolving metmet-ronidazole in
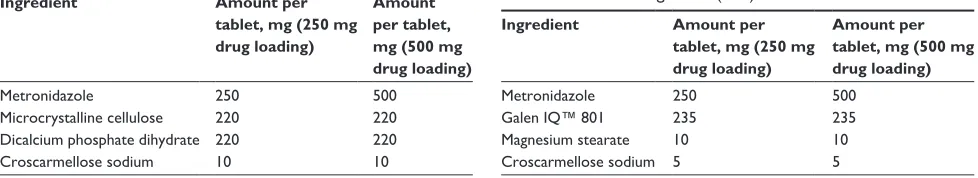
Table 1 Immediate release formulation #1 (IR#1)
Ingredient Amount per tablet, mg (250 mg drug loading)
Amount per tablet, mg (500 mg drug loading)
Metronidazole 250 500
Microcrystalline cellulose 220 220
Dicalcium phosphate dihydrate 220 220
croscarmellose sodium 10 10
Table 2 Immediate release formulation #2 (IR#2)
Ingredient Amount per tablet, mg (25 mg drug loading)
Amount per tablet, mg (50 mg drug loading)
Metronidazole 25 50
Microcrystalline cellulose Avicel PH-102 NF
743 743
croscarmellose sodium 24 24
Magnesium stearate 8 8
Table 3 Slow eroding tablet (SET) formulation
Ingredient Amount per tablet, mg (250 mg drug loading)
Amount per tablet, mg (500 mg drug loading)
Metronidazole 250 500
Galen IQ™ 801 235 235
Magnesium stearate 10 10
croscarmellose sodium 5 5
Drug Design, Development and Therapy downloaded from https://www.dovepress.com/ by 118.70.13.36 on 21-Aug-2020
Dovepress
Uebbing et al
the respective medium, using a Branson 3800 ultrasonic bath from Emerson Industrial Automation (Ferguson, MO, USA), and the calibration curve was prepared for a range from 3.75% to 120% of the expected maximum drug con-centrations. Quantification of metronidazole was performed via a slightly modified version of a previously published HPLC method.7 A VP-class Shimadzu Scientific
Instru-ments (Kyoto, Japan) liquid chromatograph, equipped with a Lichrospher® 60 RP Select B column (5 µm, 12.5×4 mm,
by Merck Darmstadt, Germany) with a matching guard column and connected to a CBM-20A system controller, two LC-10AS pumps, an SIL-10ADVP auto sampler and a SPD-M10AVP diode array detector, was used. The system was controlled using the data acquisition software “EZ Start 7.4” (Shimadzu). The mobile phase was deaerated before use, using a combination of vacuum filtration, and ultrasound and the flow rate was set to 1 mL/minute, using a 70:30 mix of water and acetonitrile. A sample volume of 10 µL was directly injected without dilution and the retention time for metronidazole was ~2 minutes with a total run time of 3 minutes. For all dissolution tests, the correlation coefficient (r2) for the calibration curve was 0.998.
DDDPlus™ simulation software
DDDPlus (Dose Disintegration and Dissolution Software) ver-sion 5.0.0011 by Simulations Plus, Inc. (Lancaster, CA, USA) was used to simulate dissolution behavior of different formula-tions by defining excipients and test condiformula-tions.9 The software
is divided into three main tabs – formulation, dissolution method and simulation. The formulation tab lets the user chose from eight different dosage forms – such as IR tablet, coated tablet, powder or capsule – and provide manufacturing properties, such as compression force or tablet diameter, as well as the formulation composition. The latter can be made up from excipients in the included database or user-defined ingredients. The role of the ingredient (API, disintegrant,
polymer, etc.) can be set by the user; the physicochemical properties, such as solubility, pKa, diffusion coefficient or logD and the particle size distribution can be defined and a dissolution model (eg, mass transfer, Nernst-Brunner, intrinsic dissolution) is chosen. An excipient-specific coefficient which represents the influence of the excipient on the formulation, as well as a calibration coefficient, can be defined. The param-eters which were used for the simulations in this study can be found in Tables 5 and 6 and were either measured, collected from literature, or part of the default excipient database in DDDPlus. A solubility vs pH profile was established using the “pKa Table” dialog and literature values, which were also used in the biowaiver monograph for metronidazole, and an “.spd” (solubility-pH data) file was created.10,11
Simulation test conditions were chosen to be identical to the actual dissolution and intrinsic dissolution test conditions of the in vitro tests performed, using 900 mL medium and 100 mL medium, respectively, as well as paddle speeds of 25, 50 and 75 rpm (basket speed: 100 rpm) and a 60 minutes (25 minutes) simulation length. New media were defined using DDDPlus integrated medium composition tool, with the pH being the measured pH and dynamic viscosity at 37°C being estimated values based on inter- and extrapolation of
Table 5 DDDPlus™ parameters for intrinsic dissolution simulation
Parameters Metronidazole
ingredient type active
Molecular weight (g/mol) 171.1534
Reference solubility (mg/mL) 13.6 at pH 4.5 (measured via HPLC)
Density (g/mL) 1.4535
Precipitation time (s) 900 (DDDPlus standard value) Diffusion coefficient (cm²/s⋅105) 1.037 (calculated via DDDPlus)
Reference logD −0.02 at ph 7.436
Mean radius (µm)/SD/no of bins 333.06/2.5/8 (not used in intrinsic dissolution)
Dissolution model intrinsic dissolution pKa table/solubility-pH data file (.spd)
Solubility pH 1.0 (mg/mL) 30.610
Solubility pH 3.0 (mg/mL) 14.110
Solubility pH 5.0 (mg/mL) 12.810
Solubility pH 7.0 (mg/mL) 11.610
general properties
Compression force (kN) 19.9 (from manufacturing) Tablet diameter (mm) 8.5 (from manufacturing) Optimized metronidazole calibration constant
sgFsp 0.3564
Acetate buffer pH 4.5 0.2330
10% sucrose 0.2270
20% sucrose 0.1910
30% sucrose 0.1471
Abbreviations: DDDPlus, Dose Disintegration and Dissolution Software; HPLC, high-performance liquid chromatography; SD, standard deviation; SGFsp, simulated gastric fluid sine pepsin.
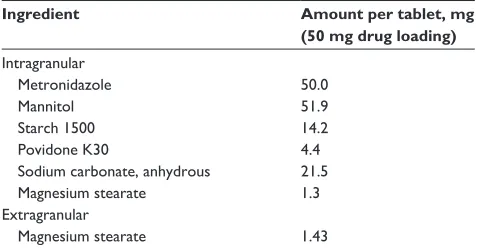
Table 4 Granulated tablet (GT) formulation
Ingredient Amount per tablet, mg (50 mg drug loading)
intragranular
Metronidazole 50.0
Mannitol 51.9
Starch 1500 14.2
Povidone K30 4.4
Sodium carbonate, anhydrous 21.5
Magnesium stearate 1.3
extragranular
Magnesium stearate 1.43
Drug Design, Development and Therapy downloaded from https://www.dovepress.com/ by 118.70.13.36 on 21-Aug-2020
Dovepress Disintegration testing
literature data.12 The chosen parameters for the simulations
can be found in Table 7.
The third tab in the software is used to simulate either a single simulation, a parameter sensitivity analysis, a virtual trial, parameter optimization using provided in vitro data, or compare the simulation results to the provided in vitro data using f1/f2-testing. The results can be displayed graphically for each ingredient and can be exported for further use.
Data analysis
All data analysis was performed via either DDDPlus or using Microsoft Excel™ with DDSolver. Dissolution and intrin-sic dissolution tests were graphically plotted in Microsoft Excel and statistically evaluated using DDSolver, a free excel plugin designed for dissolution profile data analysis, like profile comparison or modeling.13,14 Profiles showing
a higher dissolution rate than 100%, due to calibration
inaccuracy, were normalized to a maximum of 100% for better compatibility with DDDPlus. This was achieved by defining the highest fraction dissolved value as 100% and multiplying all the other profiles in the plot figure by the same factor in order to maintain comparability. Pairwise dissolution data comparison was performed via f2 statistics for both in vitro and in vitro data, as well as for evaluating in silico predictions. The coefficient of determination (R²) for evaluating in silico data correlation to in vitro data was obtained from DDDPlus. Model fitting in DDSolver was used to determine drug release mechanisms of the different tablet formulation, by using zero order, first order, Gomp-ertz, Weibull and Hopfenberg functions, as well as the Korsmeyer–Peppas equation.15–17 Korsmeyer-Peppas
model-ing requires Q-values of ,65%. If this was not possible, the lowest amount of points (three points) that DDSolver accepts was used. For zero-order curve fitting, only the portion of
Table 6 DDDPlus™ parameters for IR#2 formulation
Parameter Metronidazole MCC Croscarmellose Mg stearate
ingredient type active Other Disintegrant Other
Amount (mg) 50/25 743 24 8
Molecular weight (g/mol) 171.1534 36,000 395,000 591.27
Reference solubility (mg/mL) 13.6 at pH 4.5 0.0001 at ph 7 0.0001 at ph 6 0.03 at ph 7
Density (g/mL) 1.4535 1.6 1.54 1.2
Precipitation time (s) 900 900 900 900
Diffusion coefficient (cm²/s⋅105) 1.037 0.00005 0.00005 0.66
Reference logD −0.02 at ph 7.436 – – –
Mean radius (µm)/SD/no of bins 39.4020/2.5/8 10039/2.5/8 25/2.5/8 25/2.5/8
Dissolution model Nernst–Brunner – – –
Calibration constant a 1 1 1
Disintegration constant – – 537.83 –
general properties
Tablet diameter (mm) 12.66
Porosity model Ryshkewitch equation
Tablet tensile strength (MPa) 1.1960 Calculated from
Tablet hardness (N) 168.6744
Short axis (mm) 12.66
Thickness (mm) 6.99
Wall height (mm) 2.55
Bonding constant 6.7166
Tens Str at Por =0 (MPa) 23.7379
Disintegration time (min) (0)
Other properties
.spd file metronidazole a
apparatus type USP paddle
Solubility calculation Load .spd file
simulation length 60 min
Dissolution model Use microclimate ph
Notes: Parameters without a source were part of the DDDPlus excipient database, standard values or calculated using the integrated conversion tool (diffusion coefficient). Croscarmellose disintegration constant and metronidazole mean radius were optimized to fit buffer pH 4.5 and SGFsp in vitro data via DDDPlus. Metronidazole solubility at pH 4.5 was measured via HPLC and general properties were gathered during the tablet manufacturing process. Tablet Tensile Strength was calculated using the modified Fell and Newton equation by Pitt et al.37,38aOptimized calibration constants for each medium: SGFsp: 0.3564, acetate buffer pH 4.5: 0.2330, 10% sucrose: 0.2270, 20% sucrose:
0.1910, 30% sucrose: 0.1471. ‘–’ indicates no value.
Abbreviations: DDDPlus, Dose Disintegration and Dissolution Software; HPLC, high-performance liquid chromatography; IR, immediate release; MCC, microcrystalline cellulose; SD, standard deviation; USP, United States Pharmacopeial Convention.
Drug Design, Development and Therapy downloaded from https://www.dovepress.com/ by 118.70.13.36 on 21-Aug-2020
Dovepress
Uebbing et al
the dissolution profile with Q-values ,100% was modeled because only these values represent the actual dissolution process. The adjusted coefficient of determination (R²adj), the Akaike information criterion and the model selection criterion were used to determine the most appropriate release model and are all included in DDSolver.13,18
Results and discussion
The results from the dissolution tests for the IR#1 and IR#2, the SET formulation and the GT formulation in USP pH 4.5 acetate buffer are shown in Figures 1–7.
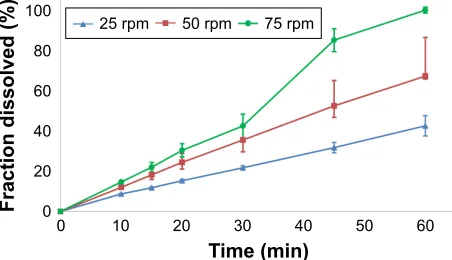
Both IR#1 and IR#2 showed rapid disintegration and all reached the FDA requirement for 80% dissolution within 15 minutes, as long as the tests were performed at
a paddle speed of 75 rpm.5 At lower paddle speeds
con-ing was observed and the dissolution rates declined. This resulted in IR#1 failing the FDA criteria at paddle speeds of 50 rpm and IR#2 failing at 25 rpm. Coning is an in vitro phenomenon, where a loose powder bed is formed by undissolved drug and excipients under the paddle after the tablet has partially or completely disintegrated. It is not relevant to the in vivo performance of tablets.19,20 In general,
the effect was less noticeable in the dissolution profiles for IR#2, which could be due to the lower drug loading of this formulation. At 25 rpm, the IR#2 profiles still failed the FDA criteria and were not considered similar to the 75 rpm profiles (f2-test, 25 mg: 30; 50 mg: 32). Although the FDA criteria were met at 50 rpm, the profiles were close to being
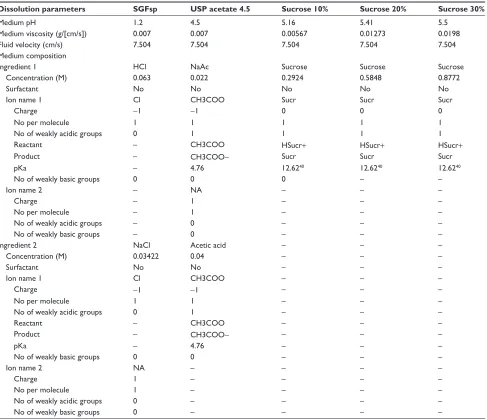
Table 7 Medium parameters used for simulations in DDDPlus™
Dissolution parameters SGFsp USP acetate 4.5 Sucrose 10% Sucrose 20% Sucrose 30%
Medium ph 1.2 4.5 5.16 5.41 5.5
Medium viscosity (g/[cm/s]) 0.007 0.007 0.00567 0.01273 0.0198
Fluid velocity (cm/s) 7.504 7.504 7.504 7.504 7.504
Medium composition
ingredient 1 hcl naac sucrose sucrose sucrose
Concentration (M) 0.063 0.022 0.2924 0.5848 0.8772
Surfactant no no no no no
ion name 1 cl ch3cOO sucr sucr sucr
charge −1 −1 0 0 0
no per molecule 1 1 1 1 1
No of weakly acidic groups 0 1 1 1 1
reactant – ch3cOO hsucr+ hsucr+ hsucr+
Product – ch3cOO− sucr sucr sucr
pKa – 4.76 12.6240 12.6240 12.6240
No of weakly basic groups 0 0 0 – –
ion name 2 – na – – –
charge – 1 – – –
no per molecule – 1 – – –
No of weakly acidic groups – 0 – – –
No of weakly basic groups – 0 – – –
ingredient 2 nacl acetic acid – – –
Concentration (M) 0.03422 0.04 – – –
Surfactant no no – – –
ion name 1 cl ch3cOO – – –
charge −1 −1 – – –
no per molecule 1 1 – – –
No of weakly acidic groups 0 1 – – –
reactant – ch3cOO – – –
Product – ch3cOO− – – –
pKa – 4.76 – – –
No of weakly basic groups 0 0 – – –
ion name 2 na – – – –
charge 1 – – – –
no per molecule 1 – – – –
No of weakly acidic groups 0 – – – –
No of weakly basic groups 0 – – – –
Notes: Medium pH was measured. Medium viscosity was either taken from DDDPlus (SGFsp, USP acetate 4.5) or estimated (sucrose solutions; see “Methods” section). USP acetate was used directly from the database. SGFsp was created as a custom medium, using the “USP Hydrochloric Acid 1.2” medium as a template and adjusting the ingredient concentrations. Sucrose media were created from scratch. ‘–’ indicates no value.
Abbreviations: DDDPlus, Dose Disintegration and Dissolution Software; NA, not applicable; Sucr, sucrose; SGFsp, simulated gastric fluid sine pepsin; USP, United States Pharmacopeial Convention.
Drug Design, Development and Therapy downloaded from https://www.dovepress.com/ by 118.70.13.36 on 21-Aug-2020
Dovepress Disintegration testing
7LPHPLQ
)UDFWLRQGLVVROYHG
USP USP USP
Figure 1 Dissolution of IR#1 formulation (250 mg drug loading) in acetate buffer pH 4.5 at various paddle speeds.
Abbreviation: ir, immediate release.
7LPHPLQ
)UDFWLRQGLVVROYHG
USP USP USP
Figure 2 Dissolution of IR#1 formulation (500 mg drug loading) in acetate buffer pH 4.5 at various paddle speeds.
Abbreviation: ir, immediate release.
considered not similar to the 75 rpm values (f2-test, 25 mg: 56; 50 mg: 50).
Model fitting via DDSolver produced very good fits (R²adj0.992) for the Gompertz and Weibull models, as well as good fits (R²adj=0.848–0.993 for 250 mg and 0.798–0.985 for 500 mg) to a first-order release for IR#1. The models showed weaker correlations at lower paddle speeds. The usefulness of the Weibull model was shown by Langenbucher to model a variety of dissolution curves which could not be modeled using only exponential or log-normal models. The Gompertz model was successfully used to model the dissolu-tion behavior of methyldopa tablets. Both the Weibull and Gompertz models are frequently used to describe the release from IR tablets.13,15,21–23 In the Korsmeyer–Peppas
equa-tion, n-values 0.43 suggest an only diffusion-controlled dissolution (only DPP controlled), whereas values 1.00 represent zero-order release kinetics, with anomalous (non-Fickian) diffusion for the values in between.24
Applying the Korsmeyer–Peppas equation to the in vitro data resulted in n-values of 0.183/0.336/0.434 (250 mg) and 0.209/0.286/0.460 (500 mg) for 75, 50 and 25 rpm, respectively. This shows a shift away from DPP controlled
7LPHPLQ
)UDFWLRQGLVVROYHG
USP USP 6LPXODWHGUSP 6LPXODWHGUSP
USP
6LPXODWHGUSP
Figure 3 Dissolution of IR#2 formulation (25 mg drug loading) in acetate buffer pH 4.5 at various paddle speeds and simulated profiles.
Abbreviation: ir, immediate release.
dissolution to an increasing formulation effect for the IR#1 samples. For the IR#2 tablets, model fitting provided good correlations for both the Gompertz (R²adj=0.827–0.996) and Weibull (R²adj=0.795–0.998) functions. Korsmeyer–Peppas modeling produced n-values of 0.128/0.283/0.558 (25 mg) and 0.027/0.196/0.301 (50 mg) for 75, 50 and 25 rpm, respectively. Thus, diffusion was the main mechanism for dissolution. As with IR#1, an increasing formulation effect on dissolution could be observed at lower paddle speeds, due to coning.
To better demonstrate the effect of the formulation, with-out having to rely on uncommon paddle speeds and the in vitro phenomenon of coning, two formulations with a more controlled release (SET and GT) were produced.
The SET formulation did not show immediate disinte-gration and completely disintegrated only at 75 rpm. There was no coning occurring at lower paddle speeds, since only
7LPHPLQ
)UDFWLRQGLVVROYHG
USP USP 6LPXODWHGUSP 6LPXODWHGUSP
USP
6LPXODWHGUSP
Figure 4 Dissolution of IR#2 formulation (50 mg drug loading) in acetate buffer pH 4.5 at various paddle speeds and simulated profiles.
Abbreviation: ir, immediate release.
Drug Design, Development and Therapy downloaded from https://www.dovepress.com/ by 118.70.13.36 on 21-Aug-2020
Dovepress
Uebbing et al
7LPHPLQ
)UDFWLRQGLVVROYHG
USP USP USP
Figure 5 Dissolution of GT formulation (50 mg drug loading) in acetate buffer pH 4.5 at various paddle speeds.
Abbreviation: GT, granulated tablet.
7LPHPLQ
)UDFWLRQGLVVROYHG
USP USP USP
Figure 6 Dissolution of SET formulation (250 mg drug loading) in acetate buffer pH 4.5 at various paddle speeds.
Abbreviation: SET, slow eroding tablet.
7LPHPLQ
)UDFWLRQGLVVROYHG
USP USP USP
Figure 7 Dissolution of SET formulation (500 mg drug loading) in acetate buffer pH 4.5 at various paddle speeds.
Abbreviation: SET, slow eroding tablet.
magnesium stearate and the disintegrant (croscarmellose sodium) were insoluble and the formulation only contained small amounts of these excipients. The tablets containing a drug loading of 250 mg broke in half after ~40 minutes, resulting in a higher surface area and therefore a higher dissolution rate. Overall, these tablets showed a controlled release rate, which was supported by a good correlation to a zero-order model (R²adj =0.936–0.998), as well as n-values of 0.887/0.976/0.979 (250 mg; 25/50/75 rpm) and 0.947/1.045/1.338 (500 mg) for the Korsmeyer–Peppas equation. Weibull and Hopfenberg modeling produced good correlations (R²adj=0.915–1.000). The Hopfenberg equation was developed for erodible tablets in various shapes.25
The results for the GT formulation were similar to the modeling outcomes for the SET formulation. Here, a slow erosion of the tablet instead of a fast disintegration could be observed as well. Again, a correlation to zero order (R²adj =0.980–0.997), Weibull (R²adj =0.990–1.000) and Hopfenberg (R²adj =0.978–0.996) models could be established, with higher correlations at lower paddle speeds. A look at the n-values of 1.137/1.145/1.253 (25–75 rpm) for
Korsmeyer–Peppas suggests a zero order (case II) transport for the drug dissolution process for this formulation too.
These results show that dissolution in rapidly disintegrat-ing, IR formulations is DPP-controlled after the tablet has disintegrated. Thus, the dissolution of the API can be described by basic mechanistic mass-transport equations such as Nernst– Brunner.15 The advantage of these mechanistic models is that
they can predict drug dissolution, and depend only on very basic parameters such as particle size and particle size dis-tribution, solubility, density, diffusion coefficient, diffusion layer thickness, bulk/micro-climate pH, and experimental conditions.26,27 Such parameters are characterized for an API
in a QbD approach and dissolution can be predicted for differ-ent media. For IR tablet formulations, where API dissolution is known and controlled by DPP, disintegration is the most critical and clinically relevant dosage form parameter. If disintegration changes, the corresponding drug product per-formance will change. However, if disintegration occurs fast and complete, then dissolution depends only on DPP, and the excipient and formulation factors are not important for clinical performance. In this case the disintegration test is the most appropriate performance and quality control test for the final formulation because the API dissolution behavior is not significantly impacted by the formulation.
To demonstrate the importance of the disintegration step in more detail, DIM were introduced to evaluate changes in dissolution behavior due to different disintegration times. Our group had shown previously, how different media can impact disintegration of different dosage forms.28 SGFsp
and acetate buffer pH 4.5 USP were used as conventional disintegration media, while also preparing 10%, 20% and 30% sucrose solutions as DIM. Sucrose solutions have been shown to impact tablet disintegration.29 The results from
the disintegration test for the IR#2 (50 mg) formulation
Drug Design, Development and Therapy downloaded from https://www.dovepress.com/ by 118.70.13.36 on 21-Aug-2020
Dovepress Disintegration testing
6*)VS
%XIIHU S+
'LVLQWHJUDWLRQWLPHV
6XFURVH
6XFURVH 6XFURVH
Figure 8 Impact of immersion media on disintegration time of IR#2 (50 mg). Abbreviations: IR, immediate release; SGFsp, simulated gastric fluid sine pepsin.
can be seen in Figure 8 and show a clear increase in disin-tegration time for the DIM compared to the conventional media, with longer disintegration times for higher sugar concentrations.
This can be explained as follows: disintegration mechanisms can be divided into surface erosion, tablet fraction, dissolution of API and excipients and particle de-agglomeration by swelling of polymers, with the first two being hydrodynamics-dependent, dissolution being both hydrodynamics-dependent and hydrodynamics-independent and particle deagglomeration being hydrodynamically independent. These mechanisms can also be divided into dynamic and static tablet disintegration.30,31 Sucrose solutions
in particular have been shown to affect tablet disintegration both by influencing water uptake (static and dynamic dis-integration) and hydrodynamics (dynamic disdis-integration) because of their higher viscosity, and by causing a profound depression of water diffusivity – and therefore lower water uptake – by molecular interactions (eg, hydrogen bonding) between water and sucrose.29,31
After showing that DIM did indeed affect disintegration, intrinsic dissolution testing was performed in the same media to study their impact on the API alone. The results from these intrinsic dissolution tests are shown in Figure 9. Metronidazole dissolved fastest in SGFsp, where it has its highest solubility due to its pKa of 3.09. The other profiles showed slower disso-lution rates as a result of the increasing sucrose concentrations. All dissolution profiles showed good (R²adj=0.940–1.000) cor-relation to a zero-order release model, as expected.
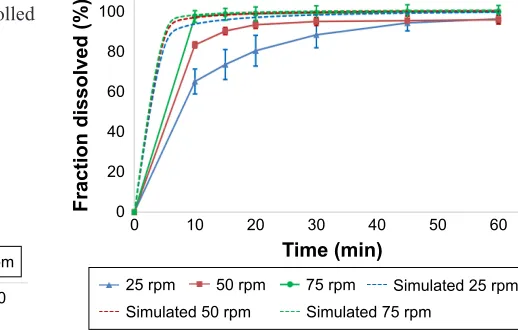
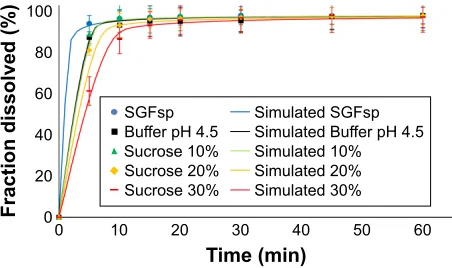
Finally, dissolution testing for the IR#2 (50 mg) formulation was performed in conventional media and DIM – the results can be seen in Figure 10. Model fitting to the Korsmeyer–Peppas equation showed a growing impact
of the formulation on dissolution, with rising n-values (0.037/0.095/0.126/0.201/0.502) suggesting a move away from DPP-controlled dissolution into anomalous dissolution mechanisms caused by the interaction of the API with the formulation and DIM. This identifies disintegration as the CQA of these tablets besides API properties.
While the recent FDA draft guidance uses an empirical criterion to allow dissolution testing to be interchanged with disintegration testing, that criterion is not based on any mechanistic knowledge about the drug dissolution process or API-formulation-interactions. This can result in drug prod-ucts meeting the FDA criteria for being tested via disintegra-tion testing, even though their mechanism is not dependent on disintegration alone (as can be seen here in 30% sucrose solution) and dissolution testing would be appropriate. On the other hand, drug products might not be allowed to be tested via disintegration testing, because they do not meet the 80% dissolution in 15 minutes criterion – although their
7LPHPLQ
$PRXQWGLVVROYHGPJ
6*)VS %XIIHUS+
6XFURVH 6XFURVH
6XFURVH
6LPXODWHG6*)VS 6LPXODWHG%XIIHUS+ 6LPXODWHG 6LPXODWHG 6LPXODWHG
Figure 9 Intrinsic dissolution of metronidazole in disintegration impacting media (DIM) and simulated profiles.
Abbreviation: SGFsp, simulated gastric fluid sine pepsin.
7LPHPLQ
)UDFWLRQGLVVROYHG
6*)VS %XIIHUS+
6XFURVH 6XFURVH
6XFURVH
6LPXODWHG6*)VS 6LPXODWHG%XIIHUS+ 6LPXODWHG 6LPXODWHG 6LPXODWHG
Figure 10 Dissolution of IR#2 (50 mg) at 75 rpm in disintegration impacting media and simulated profiles.
Abbreviations: IR, immediate release; SGFsp, simulated gastric fluid sine pepsin.
Drug Design, Development and Therapy downloaded from https://www.dovepress.com/ by 118.70.13.36 on 21-Aug-2020
Dovepress
Uebbing et al
dissolution is only DPP dependent and the only influence the formulation has is disintegration.
Current guidelines ask for a correlation as a condition for replacing dissolution with disintegration testing. However, in a study published by Gupta et al, no such correlation between disintegration and dissolution could be shown.32 Instead, the
extensive study showed the complexity of excipient effects and manufacturing parameters on disintegration times and dissolu-tion rates of 24 different IR tablets. Since this very thorough study showed that no correlation exists, one may ask: which scientific data could justify disintegration testing as a surrogate for dissolution testing beyond the FDA criteria?
This study mechanistically supports that if dissolution occurs due to DPP, and disintegration has no significant impact on API dissolution, disintegration is the most relevant performance test for this dosage form.
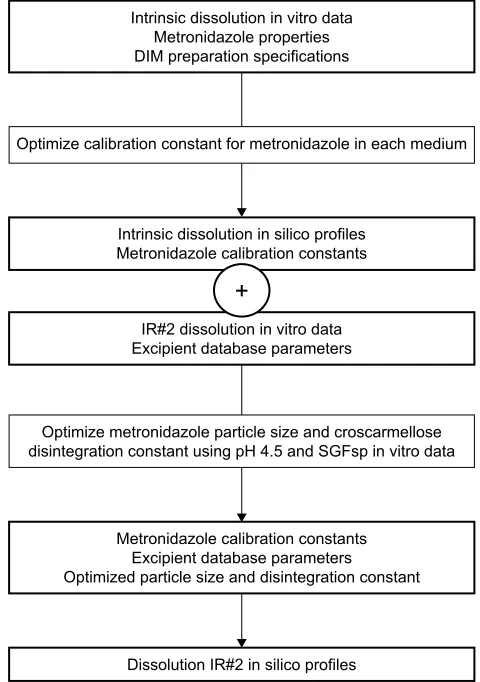
A second goal of this study was to evaluate the possibility of predicting the impact of disintegration and the resulting changes in dissolution by using in silico methods. DDDPlus was used to simulate the previously observed in vitro data. First, simulations of the intrinsic dissolution process were performed in order to optimize a calibration parameter for the API in each medium, (Figure 10). This was used to account for influences of viscosity and osmolality on the dissolution of the API in the different media. The intrinsic dissolution parameters were used for the simulation of the predictions of tablet formulation (IR#2). The disintegration constant for croscarmellose sodium, as well as the particle size of met-ronidazole were optimized from the dissolution data using pH 4.5 acetate buffer and SGFsp. The resulting parameters were then used to simulate dissolution in DIM and at various paddle speeds. The workflow process is shown in Figure 11. Comparison via f2-test (built-in tool in DDDPlus) and R² (for intrinsic dissolution; built-in tool in DDDPlus) were used to evaluate the accuracy of these simulations. The simulations can be found in the same figures as their corresponding in vitro data, and the results of the f2-tests are listed in Table 8.
Simulation of the intrinsic dissolution process in DDDPlus worked very well. The in silico dissolution profiles of IR#2 in different media, that were obtained using the previously described optimization process, were all considered similar to their in vitro data according to f2-testing at 75 rpm. For lower rotation speeds, a vast overestimation of the fraction dissolved was observed, due to the previously described issue of coning (Figures 3 and 4). The software does not account for this artificial in vitro phenomenon and assumes normal hydrodynamic conditions throughout the dissolution vessel, resulting in the observed overestimation.
,QWULQVLFGLVVROXWLRQLQYLWURGDWD 0HWURQLGD]ROHSURSHUWLHV ',0SUHSDUDWLRQVSHFLILFDWLRQV
,QWULQVLFGLVVROXWLRQLQVLOLFRSURILOHV 0HWURQLGD]ROHFDOLEUDWLRQFRQVWDQWV
'LVVROXWLRQ,5LQVLOLFRSURILOHV ,5GLVVROXWLRQLQYLWURGDWD ([FLSLHQWGDWDEDVHSDUDPHWHUV
0HWURQLGD]ROHFDOLEUDWLRQFRQVWDQWV ([FLSLHQWGDWDEDVHSDUDPHWHUV
2SWLPL]HGSDUWLFOHVL]HDQGGLVLQWHJUDWLRQFRQVWDQW 2SWLPL]HPHWURQLGD]ROHSDUWLFOHVL]HDQGFURVFDUPHOORVH GLVLQWHJUDWLRQFRQVWDQWXVLQJS+DQG6*)VSLQYLWURGDWD 2SWLPL]HFDOLEUDWLRQFRQVWDQWIRUPHWURQLGD]ROHLQHDFKPHGLXP
Figure 11 Workflow for data processing and simulation of dissolution profiles in DDDPlus™.
Abbreviations: DDDPlus, Dose Disintegration and Dissolution Software; IR, immediate release; SGFsp, simulated gastric fluid sine pepsin.
Table 8 R² values and f2-test results comparing in silico with in vitrodata (in order of simulation)
Compared profile R² f2 (accepted) RMSE
intrinsic Diss sgFsp 0.99 na 1.91
intrinsic Diss acetate 1.00 na 0.15
intrinsic Diss 10% sucrose 0.99 na 1.11
intrinsic Diss 20% sucrose 1.00 na 2.19
intrinsic Diss 30% sucrose 1.00 na 3.71
IR#2 50 mg SGFsp 0.57 92 (yes) 0.80
IR#2 50 mg acetate 0.73 89 (yes) 1.38
IR#2 50 mg 10% sucrose 0.58 66 (yes) 1.93
IR#2 50 mg 20% sucrose 0.55 60 (yes) 3.49
IR#2 50 mg 30% sucrose 0.93 73 (yes) 2.05
IR#2 50 mg 75 rpm 0.07 95 (yes) 0.72
IR#2 50 mg 50 rpm −2.26 43 (no) 7.51
IR#2 50 mg 25 rpm −2.19 27 (no) 16.81
IR#2 25 mg 75 rpm −0.55 59 (yes) 3.14
IR#2 25 mg 50 rpm −0.31 40 (no) 7.34
IR#2 25 mg 25 rpm −2.30 22 (no) 20.69
Note: RMSE values for intrinsic dissolution calculated from absolute amount dissolved (mg), for other dissolution data calculated from fraction dissolved (%). Abbreviations: Diss, dissolution; IR, immediate release; NA, not applicable; RMSE, root mean square error; SGFsp, simulated gastric fluid sine pepsin.
Drug Design, Development and Therapy downloaded from https://www.dovepress.com/ by 118.70.13.36 on 21-Aug-2020
Dovepress Disintegration testing
This study shows that in silico methods can be utilized in order to predict the impact of disintegration on the dissolution of certain IR formulations. It also shows that the current soft-ware capabilities are not yet suitable to predict all aspects of dosage form and dissolution behavior. The software was good at predicting dissolution behavior when DPP governed the dis-solution process and no artificial coning appeared. However, for formulations where API excipient interactions occur, dis-solution data was needed to optimize disdis-solution predictions and to determine the appropriate interaction coefficients. Fur-ther work is needed to build a library of excipient parameters. Then the software might be used for formulation design, even before any in vitro testing is performed.
Conclusion
The goal in QbD approaches during pharmaceutical develop-ment is to have all critical processes and quality attributes sufficiently described and controlled. Today, statistical approaches and simulations can be used to enable rational product design and to assess possible process or product risks, based on a thorough understanding of product and process performance.33
This study shows the current capabilities and limitations of DDDPlus to predict API and tablet dissolution behavior in different media and rotation speeds. The dissolution model fitting results via DDSolver were able to differentiate between DPP and formulation influenced tablet dissolution behavior.
This study mechanistically investigated disintegration and dissolution behavior of IR tablets. It was found that dis-integration and dissolution can be sequential or parallel pro-cesses, or both. If disintegration occurs first, DPP dependent dissolution can happen and disintegration can be used as performance test of rapidly disintegrating tablets beyond the current FDA criteria – the scientific data needed for this justification being, that dissolution has to be DPP dependent, originated from API characteristics, and formulation factors have to be negligible for the dissolution process. However, dissolution should be used as the quality control method if the formulation significantly influences dissolution behavior.
This approach will enable globally operating pharma-ceutical companies to scientifically justify their product specifications for disintegration independent from national – sometimes contradicting – regulatory guidance documents.
Acknowledgments
The authors thank Simulations Plus, the Drug Development and Innovation Centre of the University of Alberta and
AbbVie for their support. AbbVie jointly participated in the interpretation of data, writing, reviewing and approv-ing this publication. The study contains no proprietary AbbVie data.
Parts of the data were presented at the 2016 AAPS annual meeting as poster presentation.
Disclosure
Gregory K Webster is an employee of AbbVie. The other authors report no conflicts of interest in this work.
References
1. Yu LX. Pharmaceutical quality by design: product and process development, understanding, and control. Pharm Res. 2008;25(4): 781–791.
2. Almukainzi M, Salehi M, Chacra NAB, Löbenberg R. Comparison of the rupture and disintegration tests for soft-shell capsules. Dissolution
Technol. 2011;18(1):21–25.
3. European Medicines Agency. ICH Topic Q6A: Specifications: Test Procedures and Acceptance Criteria for New Drug Substances and New Drug Products: Chemical Substances. EMEA; 2000. Available from: http://www.ema.europa.eu/docs/en_GB/document_library/ Scientific_guideline/2009/09/WC500002823.pdf. Accessed May 6, 2016.
4. The United States Pharmacopeia 2016: USP 39; The national formulary:
NF 34. Rockville, MD: United States Pharmacopeial Convention;
2016.
5. Center for Drug Evaluation and Research (CDER). Guidance for industry: specification criteria for immediate-release solid oral dosage forms containing biopharmaceutics classification system class 1 and 3 Drugs. Food and Drug Administration; 2015. Avail-able from: http://www.fda.gov/downloads/Drugs/GuidanceCompli-anceRegulatoryInformation/Guidances/UCM456594.pdf. Accessed May 9, 2016.
6. Center for Drug Evaluation and Research (CDER). Guidance for industry: dissolution testing of immediate release solid oral dosage forms. Food and Drug Administration; 1997. Available from: http:// www.fda.gov/downloads/drugs/guidancecomplianceregulatoryinforma-tion/guidances/ucm070237.pdf. Accessed October 3, 2016.
7. Löbenberg R, Chacra NB, Stippler ES, et al. Toward global standards for comparator pharmaceutical products: case studies of amoxicillin, metronidazole, and zidovudine in the Americas. AAPS J. 2012;14(3): 462–472.
8. Schmid K, Löbenberg R. Influence of the changed USP specifica-tions on disintegration test performance. Dissolution Technol. 2010;17(1):6–10.
9. Almukainzi M, Okumu A, Wei H, Lobenberg R. Simulation of in vitro dissolution behavior using DDDPlus. AAPS PharmSciTech. 2015; 16(1):217–221.
10. Ogata H, Aoyagi N, Kaniwa N, Ejima A. Effect of food on bioavail-ability of metronidazole from sugar-coated tablets having different dis-solution rates in subjects with low gastric acidity. Int J Clin Pharmacol
Ther Toxicol. 1986;24(6):279–282.
11. Rediguieri CF, Porta V, G Nunes DS, et al. Biowaiver monographs for immediate release solid oral dosage forms: metronidazole. J Pharm Sci. 2011;100(5):1618–1627.
12. Asadi M. Beet-Sugar Handbook: Hoboken NJ: John Wiley & Sons, Inc. Available from: http://onlinelibrary.wiley.com/ doi/10.1002/9780471790990.oth1/pdf. Accessed March 14, 2017. 13. Zhang Y, Huo M, Zhou J, et al. DDSolver: an add-in program for
modeling and comparison of drug dissolution profiles. AAPS J. 2010; 12(3):263–271.
Drug Design, Development and Therapy downloaded from https://www.dovepress.com/ by 118.70.13.36 on 21-Aug-2020
Drug Design, Development and Therapy
Publish your work in this journal
Submit your manuscript here: http://www.dovepress.com/drug-design-development-and-therapy-journal
Drug Design, Development and Therapy is an international, peer-reviewed open-access journal that spans the spectrum of drug design and development through to clinical applications. Clinical outcomes, patient safety, and programs for the development and effective, safe, and sustained use of medicines are the features of the journal, which
has also been accepted for indexing on PubMed Central. The manu-script management system is completely online and includes a very quick and fair peer-review system, which is all easy to use. Visit http://www.dovepress.com/testimonials.php to read real quotes from published authors.
Dovepress
Dove
press
Uebbing et al
14. Zuo J, Gao Y, Bou-Chacra N, Löbenberg R. Evaluation of the DDSolver software applications. Biomed Res Int. 2014;2014:204925.
15. Costa P, Sousa Lobo JM. Modeling and comparison of dissolution profiles. Eur J Pharm Sci. 2001;13(2):123–133.
16. Korsmeyer RW, von Meerwall E, Peppas NA. Solute and penetrant diffusion in swellable polymers II. Verification of theoretical models.
J Polym Sci B Polym Phys. 1986;24(2):409–434.
17. Siepmann J, Peppas NA. Modeling of drug release from delivery systems based on hydroxypropyl methylcellulose (HPMC). Adv Drug
Deliv Rev. 2001;48(2–3):139–157.
18. Akaike H. A new look at the statistical model identification. IEEE Trans
Automat Contr. 1974;19(6):716–723.
19. Armenante P. Inherent method variability in dissolution testing: the effect of hydrodynamics in the USP II apparatus. A Technical Report Submitted to the Food and Drug Administration; 2005. Available from: http://www. fda.gov/ohrms/dockets/ac/05/briefing/2005-4187B1_01_04-Effect-Hydrodynamics.pdf. Accessed October 8, 2016.
20. Bai G, Armenante PM. Velocity distribution and shear rate variability resulting from changes in the impeller location in the USP dissolution testing apparatus II. Pharm Res. 2008;25(2):320–336.
21. Langenbucher F. Linearization of dissolution rate curves by the Weibull distribution. J Pharm Pharmacol. 1972;24(12):979–981.
22. Labastie M, Nacco R, Cumps J. Tablet dissolution parameters: a statisti-cal evaluation. J Pharm Biomed Anal. 1992;10(10–12):1105–1108. 23. Adams E, Coomans D, Smeyers-Verbeke J, Massart D. Non-linear
mixed effects models for the evaluation of dissolution profiles.
Int J Pharm. 2002;240(1–2):37–53.
24. Ritger PL, Peppas NA. A simple equation for description of solute release I. Fickian and non-fickian release from non-swellable devices in the form of slabs, spheres, cylinders or discs. J Control Release. 1987; 5(1):23–36.
25. Hopfenberg HB. Controlled release from erodible slabs, cylinders, and spheres. In: Paul DR, Harris FW, editors. Controlled Release Polymeric
Formulations. Washington: American Chemical Society. 1976;33:
26–32.
26. Agata Y, Iwao Y, Miyagishima A, Itai S. Novel mathematical model for predicting the dissolution profile of spherical particles under non-sink Conditions. Chem Pharm Bull. 2010;58(4):511–515.
27. Simulations Plus Inc. DDDPlus User Manual. 2016.
28. Zuo J, Gao Y, Almukainzi M, Löbenberg R. Investigation of the disintegration behavior of dietary supplements in different beverages.
Dissolution Technol. 2013;20(4):6–9.
29. Radwan A, Ebert S, Amar A, et al. Mechanistic understanding of food effects: water diffusivity in gastrointestinal tract is an important parameter for the prediction of disintegration of solid oral dosage forms.
Mol Pharm. 2013;10(6):2283–2290.
30. Kindgen S, Wachtel H, Abrahamsson B, Langguth P. Computational fluid dynamics simulation of hydrodynamics and stresses in the PhEur/ USP disintegration tester under fed and fasted fluid characteristics.
J Pharm Sci. 2015;104(9):2956–2968.
31. Radwan A, Wagner M, Amidon GL, Langguth P. Bio-predictive tablet disintegration: effect of water diffusivity, fluid flow, food composition and test conditions. Eur J Pharm Sci. 2014;57:273–279.
32. Gupta A, Hunt RL, Shah RB, Sayeed VA, Khan MA. Disintegration of highly soluble immediate release tablets: a surrogate for dissolution.
AAPS PharmSciTech. 2009;10(2):495–499.
33. Kesisoglou F, Mitra A. Application of absorption modeling in rational design of drug product under quality-by-design paradigm. AAPS J. 2015;17(5):1224–1236.
34. DrugBank [homepage on the internet]. Metronidazole; http://www. drugbank.ca/drugs/DB00916. Accessed June 17, 2016.
35. Guidechem.com: 443-48-1|C6H9N3O3 Metronidazole Density, Molecular Structure, Formula, Synonyms, Boiling Point, Flash Point, Risk Codes, Storage Temperature. [homepage on the internet]. http://www.guidechem.com/dictionary/en/443-48-1.html. Accessed June 17, 2016.
36. Bao JJ, Liu X, Zhang Y, Li Y. The development of a high-throughput measurement method of octanol/water distribution coefficient based on hollow fiber membrane solvent microextraction tech-nique. J Chromatogr B Analyt Technol Biomed Life Sci. 2014;967: 183–189.
37. Pitt KG, Newton JM, Stanley P. Effects of compaction variables on porosity and material tensile strength of convex-faced aspirin tablets.
J Pharm Pharmacol. 1991;43(4):219–225.
38. Gamlen Tableting Ltd. The importance of normalisation when compar-ing tablet properties. Available from: http://www.gamlentabletcompar-ing.com/ images/The%20importance%20of%20normalization%20when%20 analysing%20tablet%20hardness.pdf. Accessed September 30, 2016.
39. FMC Health and Nutrition. [homepage on the internet]. Avicel for solid dose forms. Available from: http://www.fmcbiopoly-mer.com/Pharmaceutical/Products/Avicelforsoliddoseforms.aspx Accessed June 17, 2016.
40. Bhattacharyya L, Rohrer JS. Applications of ion chromatography for
pharmaceutical and biological products. Hoboken NJ: John Wiley &
Sons; 2012.
Drug Design, Development and Therapy downloaded from https://www.dovepress.com/ by 118.70.13.36 on 21-Aug-2020