Development of Fine-Grained Structure Caused by Friction Stir
Welding Process of a ZK60A Magnesium Alloy
Sergey Mironov
1;*, Yoshinobu Motohashi
1, Rustam Kaibyshev
2,
Hidetoshi Somekawa
3, Toshiji Mukai
3and Kaneaki Tsuzaki
31Research Center for Superplasticity, Faculty of Engineering, Ibaraki University, Hitachi 316-8511, Japan
2Centre of Nanostructured Materials and Nanotechnologies, Belgorod State University, 85 Pobeda Str., Belgorod, 308015, Russia 3National Institute for Materials Science, Tsukuba 305-0047, Japan
A fine-grained microstructure average grain size of which is around 2mmwas developed in ZK60A magnesium alloy subjected to a FSW process. Material flow arose mainly from basal slips and was governed by simple shear deformations caused by the tool rotation.
The development of the fine-grained structure was a complex process driven by severe plastic deformations, formation of deformation bands, grain splitting, twinning and dynamic and/or static recrystallizations. It appears also that the microstructural evolution depended on morphology of fine dispersoids. [doi:10.2320/matertrans.MRA2008192]
(Received June 20, 2008; Accepted December 1, 2008; Published January 28, 2009)
Keywords: friction stir welding, magnesium alloy, electron back-scatter diffraction, microstructural evolution
1. Introduction
Magnesium alloys, being one of the lightest metallic materials in practical use and having a very attractive balance of properties, offer a great potential for weight saving in many industrial products including vehicles. However, poor weldability of these materials restricts their practical appli-cation. In this regard, friction stir welding (FSW), an innovative ‘‘solid-state’’ joining technology,1)appears to be a very promising one for the alloys.
Early studies in this field have confirmed that FSW has a very good potential for joining of the magnesium alloys.2) This necessitates development of a more fundamental under-standing of the FSW process with the aim to control weld properties through microstructures vs. properties relation-ships. In this regard, microstructural evolution is becoming now one of the key issues in FSW of the alloys.
Microstructural studies have shown that the material within stirred zone (SZ) exhibits an equiaxed grain structure which is commonly referred to as ‘‘recrystallized’’ one.3,4) Nevertheless, transmission electron microscopy (TEM) ob-servations have typically revealed high dislocation density in grain interiors.5–7) Limited experimental data have shown that the microstructure may contain significant fraction of low-angle boundaries (30 to 35%)8,9) and misorientation-angle distribution is featured by an increased proportion of 30-deg. boundaries.9) The characteristic feature of the material in the central part of the SZ is a very specific, h0001i==welding direction, texture.6,10–12) Detailed studies involving textural measurements in different locations within SZ have shown that grains are oriented in such a way that {0002} is roughly parallel to pin column sur-face.10,12) Park et al.10)have attributed the development of this texture to shear deformations induced by the rotation of a tool pin.
The above mentioned research efforts have provided a number of significant information on the microstructures developed in the SZ. However, relatively little attention has been paid to how the grain development occurs and to the actual mechanisms governing this process. In this paper, we focus on the process of the microstructural evolution during a FSW of a ZK60A magnesium alloy. For this purpose, an elec-tron back-scatter diffraction (EBSD) technique in conjunc-tion with a field emission gun scanning electron microscopy (FEG-SEM) has been employed in an attempt to provide in-depth insight into the process of grain structure development.
2. Experimental
Base material (BM) used in the present study was a commercial ZK60 magnesium alloy with a nominal chemical composition (in mass%): Zn 4.8–6.2, Zr 0.5–0.8, Cu0:03, Ni0:005and balance Mg. The BM was supplied as a hot-extruded bar. The received bar had a partially recrystallized grain structure and a prominent fibre texture with h10110i direction aligned parallel to the extrusion axis. Second-phase particles in the BM consisted of a mixture of coarse (>1mm) Mg-Zn and Zn-Zr intermetallics precipitated along grain boundaries and of fine (<0:1mm) Zr-rich dispersoids inho-mogeneously distributed in grain interiors.9)
Welding blanks, 50 mm wide and 3 mm thick, were cut from the supplied bar perpendicularly to the extrusion direction. The blanks were milled to provide a rectangular shape and parallel surfaces and then butt-welded at a tool rotation speed of 600 rpm and a travel speed of 100 mm/min. Welding tool was made from a SKH9 carbon tool steel and consisted of a shoulder having diameter of 14 mm and of a M6 threaded cylindrical pin with 2.8 mm in length. During FSW, the tool was tilted by 3from the blank normal. Under
this FSW condition, a very fine-grained structure has been obtained.9) In this paper, the reference directions in FSW geometry are denoted as follows: welding direction (WD), extrusion direction (ED) and transversal direction (TD).
*Present address: Department of Materials Processing, Graduate School of
Following FSW, the obtained welds were sectioned perpendicular to the WD and studied by optical microscopy (OM), scanning electron microscopy (SEM), and by EBSD technique. For OM and SEM observations, the samples were mechanically ground with water abrasive paper, bath-polished with a final polishing step comprising of 0.1mm
alumina suspension, and chemically etched in the solution of 4.2 g picric acid + 65.8 ml ethanol + 10 ml acetic acid + 10 ml distilled water. A suitable surface finish for EBSD was obtained by applying a mechanical polishing in a similar fashion followed by electro-polishing in the solution (methanol:glycerine:nitric acid 6 : 3 : 1) at around 8C
with an applied potential of 18 V.
The OM studies were carried out using an Olympus BX60 optical microscope and SEM investigations were performed with a JSM-5310 scanning electron microscope. High resolution EBSD analysis was conducted in a JEOL JSM-7000F FEG-SEM equipped with TSL OIMEBSD system. EBSD maps of 70,000 to 230,000 pixels with step (pixel) sizes of 0.5mm, containing 2,000 to 5,500 grains were obtained. Pattern solving efficiency was in the range of 95 to 100%. In order to obtain a higher reliability picture of the microstructure, all small grains including less than 3 pixels were ‘‘cleaned’’ from the maps. In order to eliminate spurious boundaries caused by orientation noise, a lower limit boundary misorientation cut-off of 2 was used. All
misor-ientations angles quoted are relative to the rotation axis with the minimum misorientation and 15 criterion was used to
define low-angle boundaries (LABs) versus high-angle boundaries (HABs). The HAB and LAB spacings were measured in the EBSD maps by the linear intercept method. All optical and EBSD micrographs were taken in the ED-TD plane and are presented such that the ED-TD is horizontal, and the ED is vertical.
3. Results and Discussion
3.1 Low magnification overview
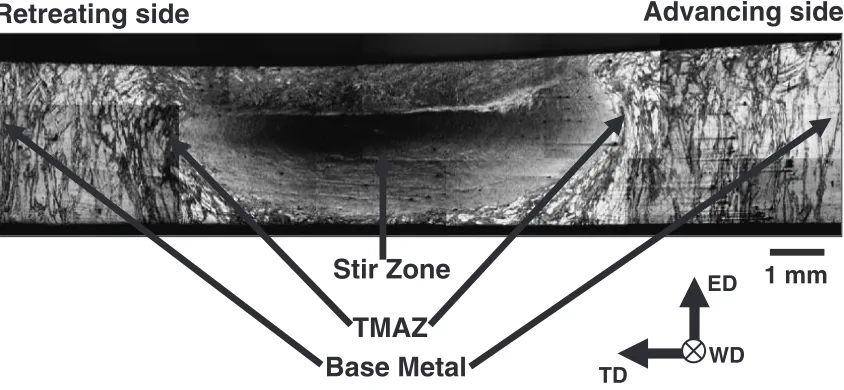
A low magnification overview of a typical transversal cross section of a friction stirred weld is shown in Fig. 1.
Three distinct zones can be easily identified: the SZ, BM and a narrow transition region—so-called thermo-mechanically affected zone (TMAZ). The SZ is approximately symmetric about the centerline and it contains a region having nearly elliptical cross section with the maximal size of about six millimetres (i.e. very close to pin diameter). It may be a nugget zone. A complex flow pattern in a top part of the SZ indicate additional influence of the tool shoulder on defor-mation in this region.
3.2 Thermo-mechanically affected zone
Transition nature of the TMAZ microstructure is a key issue to understand how parent grains have evolved into the SZ microstructure during FSW process. In this regard, it is worth giving detailed consideration to this zone.
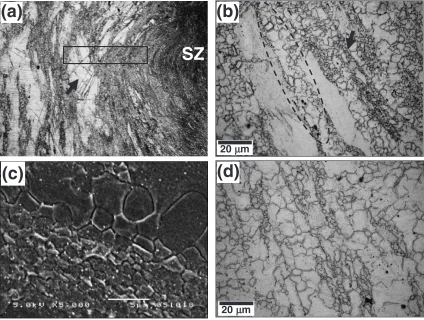
Microstructural evolution in the TMAZ is given in Fig. 2. Parent coarse grains are deformed severely as shown in Fig. 2(a). Some of the parent grains are additionally split by lens-shaped features whose morphology resembles closely to deformation twins in the magnesium13,14) (an example is arrowed in Fig. 2(a)). Simultaneously, bands of fine equiaxed grains start to form mostly along original grain boundaries (see Fig. 2(b)). Of particular interest is the observation that the newly developed grains are distinctly inhomogeneous in grain size and are distributed as alternating bands of ultra-fine (around 1mm) grains (an example is arrowed in Fig. 2(b)) and bands of relatively coarse (5 to 10mm) grains (an example is shown as selected area in Fig. 2(b)). A close inspection has shown that the ultra-fine grains have a tendency to nucleate typically in the regions with high local density of fine dispersoids (see Fig. 2(c)). Therefore, micro-structural refinement in the TMAZ appears to be significantly influenced by the constituent particles.
There is another possibility that the development of such layered bands consisting of the ultra-fine and relatively coarse grains might be caused by the formation of deforma-tion bands in which the amounts of accumulated plastic strains were different with each other. That is to say, the bands subjected to high plastic deformation and those subjected to relatively low plastic deformations were formed
1 mm
Retreating side
Advancing side
TMAZ
Base Metal
Stir Zone
ED
TD
WD
[image:2.595.88.510.76.271.2]alternately, making the layered structure, and after the occurrence of recrystallization, the finer grains were pro-duced in the bands of higher plastic deformations, while relatively coarser ones were produced in those of the lower ones.
In the regions close to the SZ, the parent grains are significantly reduced in width due to the severe plastic deformations and are eventually broken-up into strings of fine grains. Ultimately, a mixed structure comprised of alternating bands of ultra-fine grains and of fine grains has developed in the vicinity of the SZ (Fig. 2(d)).
In order to provide a more detailed picture of the microstructural evolution, an EBSD map was taken from the region indicated by the white rectangle in Fig. 2(a). The EBSD map showing arrangement of low- and high-angle boundaries (thin and thick lines, respectively) is given in Fig. 3(a); some selected areas are shown at higher magnifi-cations in Figs. 3(b) and 3(c). Figure 3(a) demonstrates that the coarse parent grains contain almost no developed substructures and LABs are distributed fairly inhomogene-ously; small grains tend to cluster near the original grain boundaries. This means that the microstructural refinement process preferentially occurs at original grain boundary regions. The coarse parent grains are frequently split by coarse bands of which boundaries are sometimes decorated by small equiaxed grains (see Fig. 3(a)). Some of the coarse grains are featured by wedge-shaped twins (Fig. 3(b), encircled). A misorientation between the twinned region
and the matrix is typically close to 86h11220i; this indicates
that the active twin family is most likely to be f10112g extension twins.15)High-magnification image of the ‘‘mixed’’ structure developed near the SZ (Fig. 3(c)) shows that the ultra-fine grains nucleated at the original grain boundaries are mostly surrounded by HABs and many of them contain almost no substructures. These microstructural features may be attributed todiscontinuousrecrystallization and, therefore, we suppose that the ultra-fine grains have nucleated dis-continuously. On the other hand, the relatively coarse grains seen in Fig. 3(c) are frequently not completely outlined by continuous HAB perimeters and contain significant LAB fraction (27%) with various stages of misorientation development. These observations show a gradual ( continu-ous) nature of the grains development. As it was shown above, it is very probably that the both processes (discontin-uous and contin(discontin-uous) were stimulated by the second-phase particles. However, their exact physical mechanisms are not clear at present and require additional study.
Therefore, microstructural evolution in the TMAZ appears to be a complex process driven by geometrical effects of strain, grains splitting, twinning, as well as discontinuous and continuous recrystallizations. It is important to emphasize, however, that it is not completely clear whether the recrystallization process has occurred directly during FSW or immediately after the FSW upon cooling to ambient temperature, i.e., whether the recrystallization was dynamic or static in nature, only from the present study. A special
SZ
(a)
(c)
20µm
(d)
20µm
(b)
[image:3.595.85.509.73.393.2]experimental approach (so-called ‘‘stop-action technique’’16)) is required to clarify this issue.
3.3 Stir zone
3.3.1 Structure morphology and grain size in SZ
We have not studied microstructural evolution in the top region, being affected by the rotation of shoulder, and the weld root region, where quite complex flows of the material would occur and accordingly the microstructural evolution
was significantly complicated in these regions. So, we focused only on the microstructural evolution in the middle region in the SZ in this study.
EBSD-maps showing arrangements of LABs and HABs in different locations within the SZ are summarized in Fig. 4; LABs are depicted as thin lines and HABs as thick lines. In the RS of the SZ (location 1 in Fig. 4), the microstructure is quite similar to that developed near the inner edge of the RS in TMAZ (Fig. 3(c)) and may be described in terms of
50µm
(a)
SZ
(b)(c)
(b)
25µm
(c)
45µm
Fig. 3 EBSD maps showing arrangement of low- and high-angle boundaries (thin and thick lines, respectively) on RS of TMAZ (a) with selected areas given at higher magnifications in (b) and (c). See text for details.
2 mm
RS
1 2 3AS
ED
TD
WD
3
20µm
2
20µm 20µm
1
[image:4.595.83.511.70.338.2] [image:4.595.53.542.387.629.2]alternating bands of ultra-fine and of fine grains; In Fig. 4, only the bands of the ultra-fine grains are arrowed. Some of the fine grains are not recrystallised in appearance having irregular shapes, being not completely delineated by HABs and containing a significant LAB proportion. On the other hand, the ultra-fine grains have reasonably equaxed mor-phology, and are typically completely surrounded by HABs and contain almost no substructures. The banded structure correlates with ‘‘onion ring’’ structure (Fig. 2(a)) and, there-by, probably reflects specific character of material flows in the SZ. It is interesting to note that the band structure becomes more obscure as the region becomes distant from the outer edge of the SZ.
Microstructures in the central and AS regions of the SZ (locations 2 and 3, respectively) may still be described as the mixture of the ultra-fine and the fine grains but evident band structure disappears. Structural mechanism for this phenom-enon is not completely clear. One possible explanation is a complex character of material flow in the SZ in which these two morphological types of the microstructure were mixed. As a whole, however, the microstructure does not change significantly across the SZ (Table 1).
3.3.2 Texture
Although material flow during the FSW appears to be very complicated, the predominant deformation mode is expected to be simple shear.10,16,17) Ideal orientations of hexagonal-close packed (HCP) metals (including magnesium) under simple shear are given in Fig. 5(a) and Table 2;18) SPN is shear plane normal and SD is shear direction. According to Beausir et al.,18) the ‘‘B’’ in Fig. 5(a) is so-called B-fibre texture component with {0002} basal plane parallel to the shear plane (Table 2). The ‘‘P’’ is so-called P-fibre texture component withh11220idirection parallel to the shear plane and the ‘‘P1’’ is end-orientation of this fibre (Table 2). The ‘‘Y’’ is so-called Y-fibre texture component withh0001iaxis rotated towards the shear plane by 30 (Table 2). The ‘‘C1’’
and ‘‘C2’’ are so-called C1- and C2-fibre texture components withh0001i axis first rotated 90 in the shear direction and then30 in the shear plane direction, respectively.
Before considering the texture developed in the SZ,
SPN
SD
(a)
(b)
Shear Direction (Circle)
Tool rotation
1 mm
RS
AS
Shear Surface (Cylinder)
Shear Plane
Shear Plane
ED
TD WD
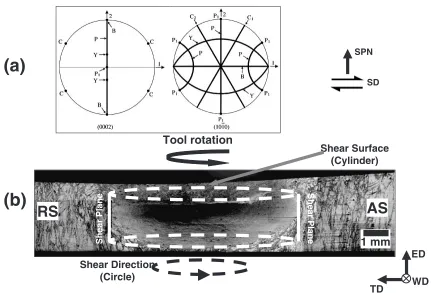
Fig. 5 (a) Ideal orientations of HCP metals under simple shear as they appear in {0002} andf10110gpole figures (after Beausieret al.18))
[image:5.595.81.515.68.361.2]and (b) schematic representation of orientations of shear plane and shear directions within the SZ. See text for details.
Table 1 Mean HAB fraction and boundary spacing for different regions shown in Fig. 4.
Location HAB fraction, % Mean boundary spacing in TD/ED,mm
HABs LABs
1 62 2.1/1.9 1.2/1.1
2 60 2.6/2.4 1.2/1.1
3 65 2.0/1.9 1.1/1.0
Table 2 Main ideal orientations in simple shear deformation of HCP metals.16Þ
Notation Description Euler angles, deg
’1 ’2
B-fibre {0002} plane==shear plane 0 90 0–60 P-fibre h11220idirection==SD 0 0–90 30
Y-fibre h0001iaxis is rotated towards 0 30 0–60 the shear plane by 30
C1-fibre h0001iaxis is first rotated 90 60 90 0–60
C2-fibre
in the SD, then30in the
[image:5.595.305.550.438.554.2] [image:5.595.47.291.439.504.2]however, it is very important to choose a proper reference frame. During FSW of the magnesium alloys, shear plane and shear direction (SD) are expected to be approximately parallel to the pin column surface.10) If so, the shear direction/plane should not be constant within the SZ but follow a curved line/surface across the SZ because of rotation of the tool. The geometrical arrangement of possible shear directions within the SZ would be a circle with SD==WD in the RS and AS, and SD==TD in the central part of the SZ, as illustrated in Fig. 5(b). On the other hand, a shear surface appears to be a cylinder having a diameter close to the tool pin diameter,10)as shown in Fig. 5(b).
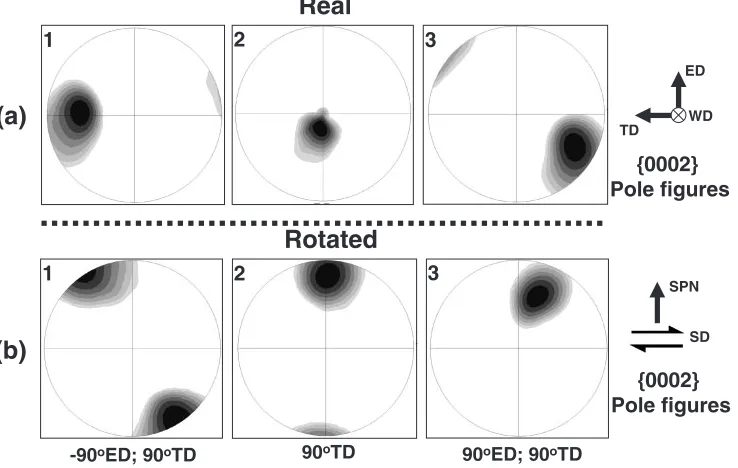
Orientation data derived from the EBSD maps shown in Fig. 4 are presented in Fig. 6. In the present study, {0002} and f10110g pole figures as well as orientation distribution function (ODF) were analyzed for each region. For sim-plicity, only {0002} pole figures are given in Fig. 6. The pole figures in Fig. 6(a) have the same reference directions as the maps, i.e., ED is vertical and TD is horizontal. It is clearly seen that grains are oriented in such a way that the {0002} basal planes are roughly parallel to the pin column surface. This phenomenon has been first reported by Parket al.10)In order to transform the orientation data into a conventional reference frame for simple shear (SD is horizontal and SPN is vertical), the pole figures were rotated around certain axes. Attempting to align the assumed SD horizontal, pole figures for the RS and AS (locations 1 and 3 in Fig. 4, respectively) were rotated at minus 90 and at plus 90 around the ED,
respectively (see scheme in Fig. 5(a)). All three pole figures were then tilted by plus 90 around the TD to align the
assumed SPN vertical (see scheme in Fig. 5(a)). The final (rotated) pole figures are summarized in Fig. 6(b).
To a first approximation, distributions of orientation peaks in the all rotated pole figures may be described in terms of
B-fibre ideal simple shear texture, according to the adopted convention (Fig. 5(a) and Table 2). In all cases, the exper-imental poles deviate from the ideal positions but may be brought into very close correspondence by suitable small rotations (not shown). Analysis of thef10110gpole figures and the ODF (not shown) has additionally confirmed formation of the B-fiber texture. The observed discrepancies between the experimental data (Fig. 6(b)) and the ideal simple shear orientations (Fig. 5(b)) are not surprising and, probably, are mainly associated with a very rough estimation of shear direction/plane orientations in this study.
Formation of the B-fibre texture is associated with predominance of basal slips.18)The obtained results evidence that the material flow during the FSW of a ZK60A magnesium alloy, indeed, results mainly from simple shear deformation and is governed by the basal slips. Taking into account that the basal slip is commonly accepted to be a dominant deformation mode in magnesium, the obtained result appears to be quite reasonable. It should be stressed, however, that the basal slips alone cannot provide five independent slip systems necessary to accommodate arbitra-ry plastic strains imposed on the grains in a polycarbitra-rystalline aggregate. In other words, activation of another slip systems and/or twinning should have occurred.
3.3.3 Misorientation distribution
Misorientation data extracted from the EBSD maps shown in Fig. 4 are arranged as grain-boundary (GB) misorientation-angle and GB misorientation-axis distribu-tions in Figs. 7(a) and 7(b), respectively. For comparative purposes, random distributions are also drawn in Fig. 7(a).
In order to assess the effect of the texture on grain boundary development, misorientation distributions were also derived from the texture (so-called ‘‘uncorrelated’’ misorientation distributions) and were shown in Fig. 7(a).
Real
{0002} Pole figures
ED
TD
WD
(a)
1 2 3
Rotated
SPN
SD
{0002} Pole figures
(b)
1 2 3
-90oED; 90oTD 90oTD 90oED; 90oTD
[image:6.595.116.485.78.312.2]In contrast to the GB misorientation distribution displaying the misorientation data between neighboring pixels in the EBSD map, the uncorrelated misorientation distributions were calculated assuming that there are no spatial correlation between adjacent pixels. In other words, all possible misorientations between the pixels sampled (including non-contiguous ones) were calculated. It is believed that a good correlation between the GB- and uncorrelated misorientation distributions indicates a significant influence of the texture evolution on grain boundary development.
Figure 7(a) demonstrates that the GB misorientation-angle distributions are qualitatively similar to each other for three regions; 1, 2 and 3, but they are distinctly different from the random distribution. Each distribution has a sharp low-angle peak, a broad irregular peak in the angular range of around 10 to 30and a relatively weak peak in the vicinity of 85 to 90.
Of particular interest is the observation that the misorienta-tion axes of the 10–30boundaries are clustered nearh0001i pole, whereas the rotation axes of the 85–90boundaries are centered aroundh211110ipole (Fig. 7(b)).
Crystallographic preference of the 85–90h211110i
bounda-ries is most likely associated with f10112g twins.15) In magnesium, this twinning mode usually operates under tension parallel to h0001i axis or under compression perpendicular to h0001i axis.19) Taking into account the insufficiency of the basal slips to accommodate arbitrary strains (as discussed above), the occurrence of twinning should be expected. It is stressed, however, that the fraction of the twin boundaries is low (around 0.5–2.3%) and, therefore, contribution of the twinning into material flow was, probably, not very high.
The origin of the 10–30h0001i boundaries, dominating the misorientation distributions, is not so evident. However, bearing in mind that the GB misorientation-angle
distribu-tions match well with the uncorrelated distribudistribu-tions in the angular range of 10 to 30 (Fig. 7(a)), it is reasonable to
assume that the crystallographic preference of these bounda-ries is associated with the texture developed in the SZ. Indeed, the B-fibre texture means that the {0002} basal planes are nearly parallel to the shear plane (Table 2) and, hence, grains in the SZ are arbitrary rotated around h0001i direction. Due to limitations imposed by symmetry of HCP crystal structure, the maximal rotation angle aroundh0001i axis is 30. Therefore, the broad peak in the angular range of
around 10 to 30in the GB misorientation-angle distribution
(Fig. 7(a)) and the cluster of the rotation axes in the GB misorientation-axis distribution (Fig. 7(b)) simply result from the B-fibre texture developed in the SZ.
It is important to point out that the basal slip cannot provide the rotation around the h0001i direction and prismatic and/or pyramidal slips are required for such lattice re-orientation. It should be stressed however that the contribution of the pyramidal slips for the h0001i rotation appears to be very low as compared to that of the prismatic slips. Thus, the proximity of the rotation axes of the grain boundaries to h0001i pole, though indirectly, indicates activity of the prismatic slips.
4. Conclusions
The present study has examined microstructural evolution in a ZK60A magnesium alloy caused by a FSW process. The main conclusions obtained are as follows:
(1) Global straining state was close to simple shear deformations with the shear surfaces approximately along the tool pin column surface.
(2) Material flow arose mainly from basal slips but also involved limited f10112g twinning and probably
pris-(a)
(b)
2
3
1
o
Misorientation angle, Θ
0 Fraction, % 0 2 4 6 8 10 12 14 16 18 GB distribution Uncorrelated distribution Random distribution
1
o o o o o o o o
Misorientation angle, Θ
0 Fraction, % 0 2 4 6 8 10 12 14 16 GB distribution Uncorrelated distribution Random distribution
2
o o o o o o o o o
Misorientation angle, Θ
0 Fraction, % 0 2 4 6 8 10 12 GB distribution Uncorrelated distribution Random distribution
3
o o o o o o o o o o 10 20o 30 40 50 60 70o 80 90 10 20o 30 40 50 60 70 80 90 20 30 40 50 60 70 80 90
10
[image:7.595.87.509.80.332.2]matic slips.
(3) There appeared alternating bands of ultra-fine grained and those of fine-grained microstructures in the region close to the SZ in TMAZ. It seemed that the develop-ment of these band structures was due to the formation of deformation bands and/or of fine dispersoids along the parent grain boundaries.
(4) The final microstructure developed in the middle regions in SZ is characterized by a very fine grain size (around 2mm), high HAB fraction (around 60%), and strong B-fiber texture.
(5) Microstructural evolution is a complex process driven by geometrical requirements of strain, grain splitting, twinning, as well as simultaneous development of both discontinuous and continuous recrystallisation.
Acknowledgements
The authors greatly acknowledge the Light Metal Educa-tion FoundaEduca-tion for their financial support.
REFERENCES
1) W. M. Thomas: Friction stir butt welding, Int. Patent No. PCT/GB92/
02203 (1991).
2) R. S. Mishra and Z. Y. Ma: Mater. Sci. Eng. R50(2005) 1–78. 3) C. I. Chang, C. J. Lee and J. C. Huang: Scr. Mater.51(2004) 509–514. 4) Y. N. Wang, C. I. Chang, C. J. Lee, H. K. Lin and J. C. Huang: Scr.
Mater.55(2006) 637–640.
5) S. H. C. Park, Y. S. Sato and H. Kokawa: J. Mater. Sci.38(2003) 4379– 4383.
6) S. H. C. Park, Y. S. Sato and H. Kokawa: Scr. Mater.49(2003) 161– 166.
7) J. A. Esparza, W. C. Davis and L. E. Murr: J. Mater. Sci.38(2003) 941–952.
8) S. Mironov, Y. Motohashi and R. Kaibyshev: Mater. Trans.48(2007) 1387–1395.
9) S. Mironov, Y. Motohashi, T. Ito, A. Goloborodko, K. Funami and R. Kaibyshev: Mater. Trans.48(2007) 3140–3148.
10) S. H. C. Park, Y. S. Sato and H. Kokawa: Metall. Mater. Trans. A34
(2003) 987–994.
11) Y. N. Wang, C. I. Chang, C. J. Lee, H. K. Lin and J. C. Huang: Scr. Mater.55(2006) 637–640.
12) W. Woo, H. Choo, D. W. Brown, P. K. Liaw and Z. Feng: Scr. Mater.
54(2006) 1859–1864.
13) M. R. Barnett: Mater. Sci. Eng. A464(2007) 1–7. 14) M. R. Barnet: Mater. Sci. Eng. A464(2007) 8–16.
15) M. D. Nave and M. R. Barnett: Scr. Mater.51(2004) 881–885. 16) P. B. Prangnell and C. P. Heason: Acta Mater.53(2005) 3179–3192. 17) A. P. Reynolds, E. Hood and W. Tang: Scr. Mater.52(2005) 491–494. 18) B. Beausir, L. S. Toth and K. W. Neale: Acta Mater.55(2007) 2695–
2705.