Effect of stress fields on the structural transformations in the Fe-Zr-B
based amorphous alloy
V.A. Yermishkin1, D.P. Murat1, S.N. Frolov1 and N.L. Fedotova2
1
Baikov Institute of Metallurgy and Materials Science, RAS, Leninskii pr. 49, Moscow, Russia 2
Bardin Central Scientific Research Institute of Ferrous Metallurgy, Vtoraya Baumanskaya ul. 6, Moscow, Russia
Abstract. In the present work, changes of material structure under the action of applied stress with the aid of the photometric analysis of structure images (PHASI) are discussed. For this purpose, amorphous and polycrystalline Fe-Zr-B alloy samples were subjected to the action of mechanical loads in a special setup. Then their surface was investigated without unloading by PHASI, which was developed by the authors. The method is based on the combined analysis of the surface areas of the samples and the spectra of the brightness of their visible light reflection The PHASI method makes it possible to reveal and quantitatively characterize the structural changes in material upon deformation. It clearly fixes the beginning of the development of main crack at the stage of its transition to the steady growth and, thus, can be considered as a technical tool for early diagnostics of the failure of constructions.
1. Introduction
The problem of the improvement in mechanical characteristics of structural materials does not lose its urgency in spite of comprehensive periodic and monographic literature dedicated by its different aspects. The values of the theoretical strength of metals are established theoretically [1] and confirmed experimentally [2]. These data play the role of the upper boundary of the potential strengthening possibilities for metallic materials. It was shown that the theoretical strength of metals for both limiting conditions such as dislocation-free filamentary crystals and the metals saturated by dislocations up to the maximum density (~1013 cm-2) is the same [3]. There is no contradiction in this sentence, because the degree of crystal lattice distortion in the initially dislocation-free crystal with such density is the same as that of the initially imperfect material with the same dislocation density. In view of the fact that the starting stresses of dislocations are extremely low, the possibilities of strain hardening were connected with the presence of internal barriers in the material. The role of such barriers belongs to elements of initial structure or to fine particles purposely introduced into the matrix for withstanding the overload from the pinned planar dislocation pileups, which are abundantly present and evenly distributed in the material [4]. However, insufficiently high mechanical and thermal resistance of the dislocation structures
formed upon strain hardening of structural materials forces researchers to search for principally different ways to solve the problem of the development of high-strength materials. An alternative to conventional structural materials can be find by the reinforcement of relatively low-strength matrix materials, which are technologically effective and economically advantageous for mass production, by continuous high-strength fibers. The use of metals in the amorphous and nanostructural state as the structural materials is another alternative for the solution of this problem. The studies in both directions are conducted sufficiently intensely, although their results provide neither comprehensive scientific substantiation of the production technologies for such materials and articles from them nor their practical large-scale use in the contemporary industry. Therefore, it is important to directly compare the mechanical properties of metallic materials in different structural states, crystalline and nanostructural. The purpose of this work is the correct comparison of the strength characteristics of Fe-Zr-B based alloy in the nanostructural and crystalline states and the evaluation of the role of structural factors in their difference.
2. Experimental
In the experimental part of this work, we used the composite material consisting of a substrate from
© Owned by the authors, published by EDP Sciences, 2011
polycrystalline ribbon coated by a thin film from initially nanocrystalline Fe-Zr-B based alloy (Fe62-Co6 -Ni4-Mo4-Zr9,8-Ti0,2-Al1-B13). It should be noted that the technique of the mechanical tests of amorphous and nanostructural materials is insufficiently thought out. The contemporary practice of the determination of mechanical characteristics is based on the experience of the tests of metals and alloys prepared by conventional metallurgical technologies. For the materials obtained by new technologies, the shape and size of the samples recommended by the standards for the mechanical tests are frequently proved to be unacceptable, but as yet there are no other standards reflecting the specific character of the mechanical behavior in the real constructions, since they yet did not find their place in the contemporary technology. It is obvious that, in any case, the mechanical tests of materials should ensure the reproducibility of results under clearly fixed experimental conditions and, furthermore, the form of the representation of their results should be kept constant. Otherwise, it is impossible to correctly compare conventional structural (engineering) materials and new materials at the stage of their development. These considerations are directly related to our study, since we use the mechanical test samples, which in shape are similar to the samples recommended by the standards, but in size do not satisfy their requirements. They are prepared from aluminum foil coated by a thin film of the Fe-Zr-B alloy in the nanostructural state. Taking into account the foregoing unsuccessful experiment of the tests of thin samples (less than 10 µm thick) made from nanostructural and amorphous materials, we decided to obtain the results of the mechanical tests of the nanostructural material under study by the calculation on the basis of the analysis of the test results for the samples with the coating from the material under study and without it. Were tested four types of samples: (1) aluminum substrate with the coating from the alloy under study; (2) aluminum substrate without coating; 3) Dacron substrate with the coating from the alloy under study; 4) Dacron substrate without coating. All samples of all types were tested with a 5848-model "Instron" type universal testing machine with the maximum breaking force of 200 kgf. The tests were performed in air at T = 20°C and at a grip motion rate of 1 mm/min.
Along with the standard mechanical tests, we performed the experiments on the loading of flat strip samples
made from the same composite materials in a special device for the tests at a stepwise change in the load. This device allowed us to obtain the digital image of the sample surface in the loaded state and to introduce it into the computer for the examination by the method of the photometric analysis of structure images (PHASI). The physical principles of the method and its research possibilities are described in [5-9], and here we consider it only briefly. PHASI is the computer analyzer of the structural images obtained by any visualization method. It is based on the combined analysis of the image of the sample surface and the brightness spectrum of the reflection of visible light from the external source before and after the external action of known physical or chemical nature. The reflection brightness spectrum is depicted in the "spectral density of the reflection brightness - corresponding intensity of the reflection brightness" coordinates. Software of the analyzer allows one to outline the certain intervals of the brightness spectrum by the color selected by the researcher and to obtain the surface distribution of the local zones, which give the light reflections contributing to this chosen spectrum interval. The coded digital image of the object surface and brightness spectrum of the reflection from it are the sources of primary information for all subsequent analytical operations, which make it possible to relate the intensity or the duration of external actions to the spectrum changes caused by such actions. The analyzer includes standard elements: personal computer, scanner, digital photo- or video camera. The illuminating system of scanner is the source of visible light.
3. Results and discussion
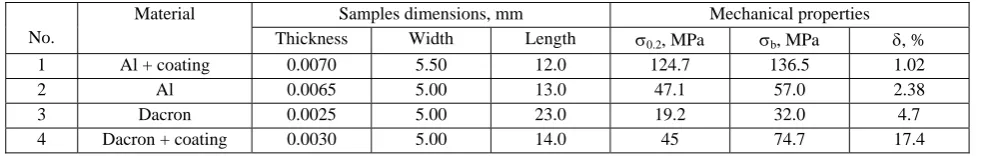
The basic target of this work was to obtain the reliable information about the mechanical behavior of the nanocrystalline alloy itself, since it was impossible to obtain its compact samples of the necessary thicknesses for the mechanical tests. For this aim, we used composite samples with the substrate layers of two types, from aluminum foil and Dacron film. The sizes of all samples used and their standard mechanical characteristics are given in Table 1. It is evident from Table 1 that the thin coating from the nanostructural alloy applied onto aluminum foil substantially increases its strength. Figure 1 shows the deformation curves of samples 1 and 2.
Table 1. Results of the mechanical tests of the materials
No.
Material Samples dimensions, mm Mechanical properties Thickness Width Length 0.2, MPa b, MPa , %
1 Al + coating 0.0070 5.50 12.0 124.7 136.5 1.02
2 Al 0.0065 5.00 13.0 47.1 57.0 2.38
3 Dacron 0.0025 5.00 23.0 19.2 32.0 4.7
.
0 20 40 60 80 100 120 140 160
0 0.005 0.01 0.015 0.02 0.025 0.03
σ
,M
Pa
ε
Fig. 1 Deformation curves of samples 1 (__) and 2 (--)
The following additive law is known generally used for the analysis of the stresses in composite [10]:
(1)
where: c, f, and m are the stresses in the composite, reinforcing phase, and matrix, respectively, and Ac, Af, and Am are the cross-section areas of the composite, reinforcing phase, and matrix, respectively. Furthermore, one should allow for the following condition of the simultaneity of the deformations in the reinforcing phase and matrix:
=
(2)
With allowance for conditions (1) and (2), the analysis of the deformation curves of the composite and matrix (Fig. 1) permits us to build the deformation curve for the reinforcing phase (in this case, its role belongs to the nanostructural coating). Figure 2 shows the deformation curve obtained for the Fe-Zr-B based nanostructural alloy as a result of this analysis.
0 200 400 600 800 1000 1200 1400 1600
0 0.005 0.01 0.015
σ
,M
Pa
ε
Fig. 2. Calculated deformation curve of the Fe-Zr-B nanostructural alloy.
We intended to compare the properties of the nanostructural alloy in the initial state and after its recrystallization. Despite the fact that annealing was performed in an argon medium at T = 550°C for 1 h, the alloy became so brittle that the samples failed upon the attempts to put them into the grips of the tensile device. Such embrittlement of the alloy can be caused by the diffusion of aluminum from the substrate into the nanostructural coating rather than by the interaction with the gas atmosphere or recrystallization of the alloy
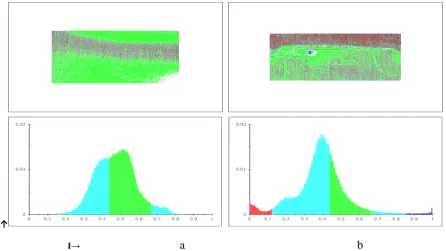
while the spectrum energy drastically grows at the beginning of the fracture development in the sample.
p↑
I→ a b
Fig. 3. Images of the surface fragment (x12) of the alloy under study and the reflection spectra from it before loading (a) and under loading
0.00 0.10 0.20 0.30 0.40 0.50 0.60 0.70 0.80
0 500 1000 1500
p(
s)
σ, MPa
Fig. 4. Dependences of medium spectral density in the interval surrounding the spectrum maximum (_) and out of the
selected intervals (---).
It is nothing to be surprised at. A radical change in the reflection brightness spectrum from the sample surface as a result of the fracture100 development is well seen from the comparison of the fragment surface images before and after the appearance of the crack.
0.00 0.01 0.01 0.02 0.02 0.03 0.03 0.04 0.04
0 500 1000 1500
p(s
)
σ, MPa
The visual presentation of these changes in the sample is given in Fig. 7. The edges of the noticeable crack are bordered by the color belonging to the interval with increased brightness reflections. On top it is shaded by the region of strongly deformed material. This is shown by its color, which belongs to the interval with increased light absorption ability due to the high degree of the roughness of the surface areas contributing to the light absorption in this interval.
0.00 0.05 0.10 0.15 0.20 0.25 0.30
1390 1400 1410 1420 1430 1440 1450
E,
c.
u.
σ,MPa
Fig. 6. Stress dependences of the energies of light reflection spectrum (Es) and of the total energy expended for increase in
the internal energy of the deformed material (Ep) and its
release upon the light reflection.
p↑
I→ a
b
Fig. 7. Image of the sample surface fragment (x12) and light reflection brightness spectra from it before deformation (a) and after the formation of main crack (b).
4. Conclusions
1. The method makes it possible to reveal and quantitatively characterize the structural changes in material upon deformation.
2. The PHASI method clearly fixes the beginning of the development of main crack at the stage of its transition to the steady growth and, thus, can be considered as f technical tool for early diagnostics of the failure of constructions.
3. The deformation curve of the thin nanostructural layer of the alloy used as the coating was built by the calculation method using the test results for the samples with coating and without it.
The work is supported by RFBR (RU) 07-08-00381a; 09-08-00563a.
References
1. Kelly A. High-Strength Materials [Russian translation], Moscow: Mir, (1976). P. 261.
2. Berezhkova G.V. Filamentary crystals. Moscow: Nauka. P. 157 (1976)
3. Ivanova V.S., Yermishkin V.A. Strength and the plasticity of refractory metals and single crystals. Moscow: Metallurgiya. P. 90 (1976.)
4. Novikov I.I., Yermishkin V.A. Physical mechanics of real materials. Moscow: Nauka. P. 323. (2004)
5. Yermishkin V.A., Murat D.P., Podbelskiy V.V. Information technology of the photometric analysis of the fatigue damageability of materials. Informatsionnye Tekhnologii. No. 11, P. 65-70 (2007)
6. Yermishkin V.A., Murat D.P., Podbel'skiy V.V. Application of a photometric analysis of structure images for evaluating the resistance to fatigue failure. Avtomatizatsiya i Sovremennye Tekhnologii. No. 2. P. 11-21. (2008)
7. Yermishkin V.A., Murat D.P., Podbel'skiy V.V. System of the photometric analysis of structure images and its application for materials research in fatigue conditions. Pribory i Sistemy. Upravlenie, Kontrol’, Diagnostika.. No. 10. P. 38-44 (2008) 8. Yermishkin V.A. Photometric analysis of
structural images. Baikov Institute of Metallurgy and Materials Science 70 years, Collected Papers. M.: Interkontakt Science, P. 696-706 (2008) 9. Yermishkin V.A., Lepeshkin Yu.D., Murat D.P.,
Ovchinnikov I.N. Method of photometric diagnostics of the structural state of materials according to the data of the analysis of the digital coded image of their surface. Patent No.2387974, Byull. Izobr. No. 13, P. 14 (2010).
10. Rosen U., Dows N. F. The mechanisms of the destruction of fibrous composites//Destruction. M.: Peace, V. I, Part I, P. 300-366 (1976)
![Fig. 1 Deformation curves of samples 1 (The following additive law is known generally used for __) and 2 (- -) the analysis of the stresses in composite [10]:](https://thumb-us.123doks.com/thumbv2/123dok_us/8090815.1350365/3.595.67.263.526.627/deformation-samples-following-additive-generally-analysis-stresses-composite.webp)