7
Be atmospheric concentration at mid
latitudes (40
◦N) during a year of solar
minimum
E. Kotsopoulou and A. Ioannidou∗
Aristotle University of Thessaloniki, Physics Department Nuclear Physics & Elementary Particle Physics Division
Thessaloniki 54124, Greece
Abstract
In this paper we present the variation of7Be concentration in the
surface air of Thessaloniki, Greece (40◦62N, 22◦95E) over the year
2009, a year of a deep solar minimum, and, as a consequence, a year
of maximum concentration of 7Be in surface air. The mean annual
activity concentration of7Be for the year 2009 was 6.0 mBq m−3. The
relative variability of 7Be surface concentration related to the solar
cycle was calculated to be deviated by about 20% from maximum to
mean. A positive correlation (R = 0.97) was revealed between the
activity of7Be and the temperature T (◦C), confirming that the
in-creased rate of vertical transport within the troposphere, especially
during warmer months, that make descend air masses enriched in7Be
down to the surface layer. The anticorrelation (R=−0.65) with RH%
is due to intense condensation during high relative humidity conditions, which results in increased aerosol particle sizes and as a consequence
in higher scavenging rate of aerosols and lower concentration of 7Be
in the atmosphere. The influence of precipitation on the 7Be
atmo-spheric concentration variability was approximately 10%, with greater
the influence of rainfall events of low precipitation ratee.g.drizzling.
∗E-mail:[email protected]
1.
Introduction
Cosmic rays interact with Earth’s atmospheric nuclei and produce a num-ber of cosmogenic radionuclides [1–3]. The production rate of cosmogenic nuclides depends on the cosmic ray particle flux. The primary cosmic ray flux at the Earth’s orbit has two components: galactic cosmic rays (GCR) and solar cosmic rays (SCR). Since the average galactic cosmic ray flux was inferred to be constant within 10% during the last few million years [4], time-dependent changes of the production rate are caused mainly by variations of the geomagnetic field intensity and the solar activity. Solar modulation is the dominant cause of the observed GCR variability. The atmosphere and the Earth’s magnetic field, also act as shields against cosmic radiation, leading to a latitudinal dependence of the primary and secondary particle fluxes and consequently of the production rate of cosmogenic nuclides, with higher values around the magnetic poles and lower values in the equatorial region.
Besides the latitude, the cosmic ray flux and the production rate of cosmogenic nuclides depends on the altitude. The production rate begins to increase at the top of the atmosphere, reaches a maximum at a depth between 100–200 g cm−2 (depending on nuclide and latitude), and finally decreases gradually down to the Earth’s surface [5].
Be-7 is a relative short lived (T1/2 = 53.3 d) naturally occurring ra-dionuclide of cosmogenic origin, which is formed in the upper troposphere and lower stratosphere by spallation reactions of light atmospheric nuclei (nitrogen and oxygen) with cosmic rays [6]. The combined effects of high 7Be production rates in the stratosphere (about 70%; [1]) and the relatively
rapid removal of aerosol-associated species from the troposphere, produce a stratospheric7Be concentration of about an order of magnitude higher than those just below the tropopause [7]. Because of the thermal structure of the stratosphere and its separation from the troposphere by the tropopause, the residence time of aerosols in the stratosphere is substantially longer (about 1-2 years) than in the troposphere, where it is on the order of week [8].
γ-radiation (Eγ = 477 keV, 10.4% emission probability), which has served
for studying precipitation scavenging [11], vertical and horizontal removal of air masses [12], aerosol transit and residence times in the troposphere [8]. From year 2000 to 2007, the solar activity varied from the maximum to the minimum. Sunspot minimums come along every 11 years, therefore, it is expected for the Sun to undergo minimum solar activity on a regular basis. 2008 was considered a very deep solar minimum; however, sunspot counts for 2009 have dropped even lower. This was the quietest sun seen in almost a century. Now, during 2010 solar cycle corrects itself and solar activity increases towards the next maximum. In particular, the temporal trends of the recent solar activity could be determined by simply measuring the daily 7Be concentrations in the ambient air. An anti-correlation is ex-pected between the production rate of cosmogenic nuclides and the sunspot number [13, 14]. Hence, our observations should be advantageous in investi-gating the current issue of the unusually long calm period of solar activity during 2009 [15].
The objective of this work is to define the concentration of 7Be in the region of Thesslaoniki, Greece (40◦ N) during a year of deep solar minimum and to calculate the relative variability of 7Be surface concentration from maximum to mean due to the solar modulation. During a year of minimum solar activity, maximum concentrations of 7Be are recorded in surface air and can reveal easily the differences in7Be fluctuations due to any meteoro-logical and seasonal variation. The influence of the different meteorometeoro-logical conditions and especially the influence of temperature, relative humidity and the wet precipitation is examined.
2.
Sampling procedure — instrumentation
Beryllium-7 atmospheric concentration was measured by air sampling; using Staplex high-volume air samplers with Staplex type TFAGF 810 glass-fiber filters 8×10, having 99.28% collection efficiency for particles as small as 0.3μm. This design involves a regulated airflow rate of 1.7–1.92 m3min−1 (60–68 ft3min−1). The length of each collection period was 24 h. Air sam-plings were carried out once a week on the roof (20 m above the ground, and 52 m a.s.l.), at the Faculty of Science building in the center of the city of Thessaloniki, Greece.
activity (Eγ = 477 keV) using a high resolution (1.9 keV at 1.33 MeV),
low-background HPGe (high purity germanium) detector with 42% relative ef-ficiency. The 1σ counting uncertainties for 7Be measurements were almost always smaller than 8%. Blank filters were regularly checked.
3.
Results and discussion
3.1. 7Be concentration levels in surface air
Weekly measurements of7Be activity concentration on aerosol particles were performed at ground level air in Thessaloniki, Greece during the year 2009. Aerosol sampling started on January 2009. The mean activity concentration of 7Be in surface air has been found to be 6.0 mBq m−3.
The variability of yearly 7Be concentration due to solar modulation was calculated. The mean annual activity concentration of 7Be during the year 2009 was 6.0 mBq m−3. This value is 20% higher than the typical mean value of 5.0 mBq m−3 for our latitude (40◦N) [16]. This variability of 7Be concentration is due to solar modulation. This result is in a good agreement with results reported from other investigators [17, 18].
The concentration of7Be in surface air fluctuates considerably. The7Be weekly concentration values showed a great variability ranging from 0.9 to 14.6 mBq m−3. The highest value was observed in June and the lowest in December. The variability is mainly due to local prevailing meteorolog-ical conditions of the atmosphere during the sampling period. Since the day-by-day concentrations of 7Be in surface air show strong variations due to interactions on daily or even shorter time scales, considering the mean monthly concentration, these variations are minimized. Averaging the data of 7Be atmospheric concentration on a monthly basis the mean monthly concentration of7Be over a year is calculated.
2 3 4 5 6 7 8 9 10
n a
J F e b M a r A p r M a y J u n J u l A u g S e p O c t N o v D e c
M onth
7
m
q
B
m ,
s n
o i t
r a
t n
e c
n o
c c
i r
e h
p s
o
m t
a
y l
h t
n o
m
n a
e
m e
B
3-Fig. 1: Mean monthly atmospheric concentration of 7Be during the year 2009 at
Thessaloniki, Greece 40◦N.
3.2. 7Be concentration levels in surface air and the influence of T (◦C)
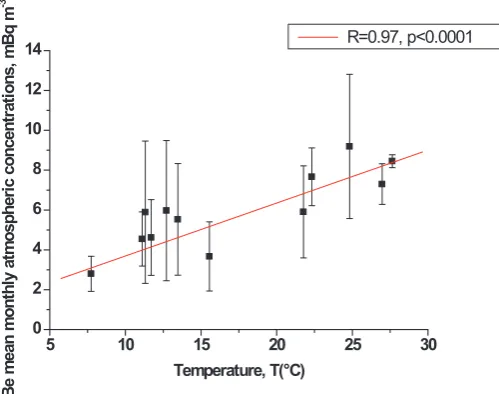
The highest 7Be activity values are observed during summer, which can be explained by the solar heating of the atmosphere. The solar heating of the surface of the Earth has a result of heating of air masses that are in contact with the ground surface. Cooler air sinks, displacing the warm, less dense air and forcing it upward. This new cold air becomes warm and is forced upward again. A convective circulation is produced, carrying surface air upward, bringing downward air from higher levels [19]. This convective circulation is then connected with the higher 7Be activity concentration in surface air, described by the positive correlation between the activity of7Be and the temperatureT(◦C).
Regression analysis shows that the correlation coefficient between the mean monthly activity concentration of7Be and the temperature T (◦C) is 0.97 and the significance of the regression is given byp <0.0001 (Fig. 2).
5 10 15 20 25 30 0
2 4 6 8 10 12
14 R=0.97, p<0.0001
7 B
e m
ean
m
o
n
th
ly at
m
o
sp
h
er
ic co
n
cen
tr
at
io
n
s,
m
B
q
m
-3
Temperature, T(°C)
Fig. 2: Mean monthly atmospheric concentration of7Bevs.temperature,T(◦C).
The combined effects of high7Be production rates in the stratosphere (about 70%; [1]) and the relatively rapid removal of aerosol-associated species from the troposphere, produce a stratospheric 7Be concentration that is about an order of magnitude higher than those just below the tropopause [7]. Consequently, the stratosphere-troposphere exchange of air masses seems to result in a significant increase of 7Be in the troposphere during the spring period.
3.3. 7Be concentration levels in surface air and the influence of RH%
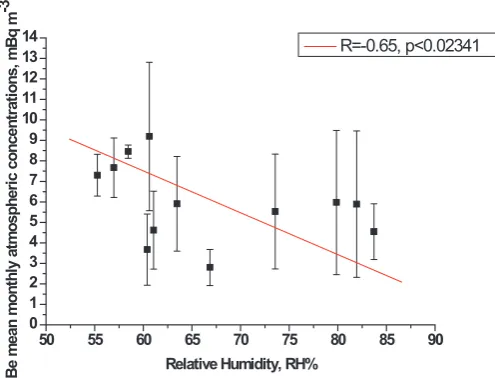
A negative correlation coefficient was found between the mean monthly ac-tivity concentration of 7Be and the relative humidity (RH%). The correla-tion coefficient between the mean monthly activity concentracorrela-tion of7Be and RH (%) is−0.65 and the significance of the regression is given by p<0.02341 (Fig. 3).
50 55 60 65 70 75 80 85 90 0
1 2 3 4 5 6 7 8 9 10 11 12 13
14 R=-0.65, p<0.02341
7 Be
m
ea
n m
ont
hl
y a
tm
o
sp
he
ri
c c
onc
ent
ra
ti
o
ns
, m
B
q m
-3
Relative Humidity, RH%
Fig. 3: Mean monthly atmospheric concentration of7Bevs.relative humidity RH%.
3.4. 7Be concentration levels in surface air and the influence of precipitation
The percentage of rainy days, including drizzling, during the sampling pe-riod was on the average 13%. The mean activity concentration of 7Be, excluding the values during rainfall events, is equal to 6.7±2.7 mBq m−3, that means 10% higher than the mean activity concentration of7Be for year 2009, a year of maximum7Be concentrations and minimum sunspot number. Therefore, the yearly variation in the7Be concentration is mainly caused by the variation in the7Be production rate and, hence, by the solar modulation of cosmic rays.
4.
Conclusions
In this paper we presented the variation of the 7Be concentration in sur-face air at Thessaloniki (latitude 40◦N) during the year 2009. It was a year of a deep solar minimum and, as a consequence, a year of maximum concentrations o 7Be. For first time in our region of investigation (Thes-saloniki, Greece), we recorded values as high as 14.6 mBq m−3. The mean annual activity concentration of7Be during the year 2009 was 6.0 mBq m−3. This value is 20% higher than the typical mean value of 5.0 mBq m−3 for our latitude (40◦N). This variability of 7Be concentration is due to solar modulation.
The atmospheric concentration of7Be shows strong seasonal trends with the highest values being observed in summer and the lowest in winter. The highest observed values during summer are correlated with the vertical re-moval of air masses within the troposphere, which is stronger during summer period carrying surface air upward and bringing downward air from higher levels enriched in7Be, described also by the positive correlation between the 7Be activity and the temperatureT(◦C).
The observed anti-correlation between the mean monthly activity con-centration of7Be and the relative humidity RH% might be due to that con-densation becomes more intense during high relative humidity conditions, resulting in increased particle sizes of atmospheric aerosols, causing higher scavenging rates of aerosols and, as a result, lower activity concentration of 7Be in the atmosphere.
No correlation was found between the mean monthly concentration of 7Be and the amount of precipitation.
References
[1] LAL D., PETERS B., Handbuch der Physik, 46 (1967) 551.
[2] O’BRIEN K., J. Geophys. Res.84, (1979) 423.
[3] MASARIK J., REEDY R. C., Earth Planetary Science Letters, 136 (1995) 381.
[4] VOGT S., HERZOG G. F., REEDY R. C., Reviews of Geophysics 28, (1990) 253.
[6] LAL D., MALHOTRA P. K., PETERS B., J. Atmosph. Terrestrial Phys.12, (1958) 306.
[7] BHANDARI N., LAL D., RAMA., Tellus 18 (1966) 391.
[8] PAPASTEFANOU C., IOANNIDOU A., J. Environ. Radioactivity 26 (1995) 273.
[9] BONDIETTI E. A., BRANDLEY J. N., RANGARAJAN C., J. Envi-ron. Radioactivity 6(2) (1988) 99.
[10] BROST R. A., FEICHTER J., HEIMANN M., J. Geophys. Res. 96 (D12) (1991) 22423.
[11] McNEARY D., BASKARAN M.,J. Geophys. Res.108(D7), 4210, doi: 10.1029/2002JD003021.(2003)
[12] TALPOS S., CUCULEANU V.,J. Environ. Radioactivity 36(1) (1997) 93.
[13] IOANNIDOU A., PAPASTEFANOU C., Nuclear Geophysics 8 (6) (1994) 539.
[14] IOANNIDOU A., PAPASTEFANOU C., J. Radioecology 3 (1) (1995) 3.
[15] Solar Influences Data Analysis Center. http://sidc.oma.be/.
[16] IOANNIDOU A., MANOLOPOULOU M., PAPASTEFANOU C., Ap-plied Radiation and Isotopes 63(2) (2005) 277.
[17] O’BRIEN K., DE LA ZERDA, LERNER A., SHEA M. A., SMART D. F.,The Sun in Time (1991) 317.
[18] KIKUCHI S., SAKURAI H., GUNJI S., TOKANAI F., J. Environ. Radioactivity 100(6) (2009) 515.
[19] FEELY H. W., LARSEN R. J., SANDERSON C. G.,J. Environ. Ra-dioactivity 9 (1989) 223.
[20] IOANNIDOU A., PAPASTEFANOU C., J. Environ. Radioactivity 85(1) (2006) 121.
[21] HOTZL H. WINKLER R.,J. Environ. Radioactivity 5, (1987) 445.