1
Juabin Matey Divass Consult
Bolgatanga, Upper East Region, Ghana
Abstract
A robust bank industry is a major player in the stability of an economy. The operational efficiency and stability of banks are therefore paramount. By way of financial ratios and Z-score, this study analysed UT Bank’s financial performance prior to the 2017 bank sector reforms in Ghana. Annual financials over a ten year period (2007-2016) were used. Debt management practices of UT Bank per the results obtained were quite on the hind side and unimpressive. This was reflected in the poor leverage and risk management variables. UT Bank would have been unable to meet creditors’ claims considering the mean average values of debt-to-assets and debt-to equity ratios of 0.76 and 0.90 respectively. The entire bank sector will benefit if credit management practices of individual banks are refreshed and worked on. The bank industry regulator should tighten its supervisory and monitoring role over banks to help detect early signs of non-performing banks. The study further recommends that statutory lending limits of banks be re-enforced to uphold the threshold of 10 percent for unsecured loans and 25 percentage for secured loans of net owned funds of the bank.
JEL classification: G01, G2, G21, G28, G33, M41
Keywords: Bank, Debt, Distress, Performance, Credit Management Practice, Z-score
2
INTRODUCTION Background to the Study
In the context of the recent bank industry crisis in Ghana, it is seen as an outlier without which policymakers, regulators and bank management will feel complacent. This I will want to agree will bring bankers and economists alike to find answers to inevitable questions about the sporadic bank industry crises across the global economy. These crises have had fragmented and differing consequence on individual economies depending on how the macro economy is run with its spill-overs. There have been reported cases of bank mergers, take-overs and consolidations, even in the more cherished advanced economies where risk management practices are presumed to gain prominence.
3
crises resulting into loss of about 2,700 jobs with an estimated debt pile of 1.7 US dollars (Nyalatorgbi, 2019). The governor of Bank of Ghana (BoG), Dr. Ernest Ad-dison, attributed the crises to poor banking practices, weak supervision and regulation by the immediate past administration of the Central Bank. Most of the affected banks were found to have exceeded their regulatory single obligor limits, the governor revealed. For instance, the UT Bank exceeded its single obligor limit of GH¢20m when it advanced a loan of GH300m to a politically exposed customer, the governor added (Nyalatorgbi, 2019). Apart from the aforementioned, uncertainties surrounding shareholder funds raised
suspicions (Ghana Banking Survey, 2019).
The Banks and Special Deposit-Taking institutions Acts 2016 (Act 930), Section
62 of Ghana has a legal lending limit which demands that beyond a certain threshold of
unimpaired capital and surplus accounts, the bank is not permitted to grant to a single
customer. This requirement is meant to reduce the risk exposure of a single customer. It
further emphasises; depending on whether such a loan is secured or unsecured, it must not
exceeding 10 percent of net owned funds of the bank in the case of an unsecured loan and
not more than 25 percent if a loan is collateralized (see Abor et al, 2019).
4
becoming the third largest stockholder of Agricultural Development Bank. Overzealous equity owners of banks coupled with internal wrangling with bank managers over risk taking threshold and neglect of best risk management practices are central to most banks’ distress situations.
An estimated GH860m and GH620m in liquidity support were given to the UT Bank and Capital Bank respectively in 2015 by the BoG to help strengthen their operations. Added to these revelations, issues of rising non-performing loans and capitalisation challenges eventually compelled the central bank to unleash the inevitable measures to salvage the deposits of unsuspecting customers (Nyalatorgbi, 2019). The reports further states; between 2015 and 2018, UniBank took an estimated GH3.1bn, of
which more than half the amount was uncollateralized exposing the central bank itself to
naked risk. All these shortfalls notwithstanding, closures, mergers and takeovers of
certain banks are said to be politically motivated and rashly executed. This study was
undertaken to indeed accept or otherwise of the general null hypothesize of the society.
Review of Related Literature
5
The Market Power-Theory vs. Efficient Structure Theory
Two hypotheses are linked to the market-power theory; the traditional structure-conduct-performance and the relative market hypotheses. The traditional structure conduct performance (SCP) occurs where higher loan rates are determined by more concentrated market. This, Aguenaous, Lahreech and Bounnakaya (2017) explain; with the tightened up of industry entry requirements, firms are forced to improve efficiency in service delivery or allow for normal distribution of efficiency. Due to association discipline, banks can collude, reminiscent of high level of their concentration to reduce deposit rates. Similarly, interest on lending could be increased to enjoy relatively high profits due to same advantage of highly concentrated firms. There are cited failed attempts to establish strong and a significant link between market structure and bank’s efficiency (Aguenaous et al, 2017). In the case of Kaufman (1966), he found a non-linear relationship between those two variables (market structure and bank performance). Their findings (Smirklock, 1985; Rhodes; 1985) were not contrary to Kaufman’s (1966).
6
performance to have a high dependency on bank’s efficiency as opposed to market structure.
Some researchers had challenges with the use of market share as a function of efficiency (see Berger, 1995; Shepherd, 1986; Seelanatha, 2010; cited in Aguenaous et al, 2017). As an elongation of available empirics on bank performance measures, Sheikh-Waqas (2005) found a positive relationship between debt-to-equity, equity multiplier and bank’s insolvency risk. In their study of financial ratio approach to evaluating financial performance, Attefah and Darko (2016) realised that debt-to-equity, debt-to-asset and equity multiplier positively influence bank risk, insolvency and instability.
Methodology
This study adopts a panel data analysis to test bank stability and probability of insolvency using the Z-score (Srairi, 2013; Lepetit, Nya, Rous & Tarazi, 2008; Altman, 1968). Specifically, the study looks at how justifiably distressed certain banks were in the midst of the current financial turbulence in Ghana. The UT Bank Ghana is a case under consideration, as the researcher seeks to investigate its stability and insolvency, using its published financials between 2007 and 2016.
7 RoA𝑍 − 𝑆𝑜𝑟𝑒 = µ (𝑅𝑜𝐴) + (𝐶𝐴𝑃𝐴𝑅)
ϭ(𝑅𝑜𝐴) ……..……….…………...……….. (1)
It must be stressed that, equity capital to asset ratio is computed using only shareholders’ equity, subordinated debt exclusive (Li, Tripe & Malone, 2017).
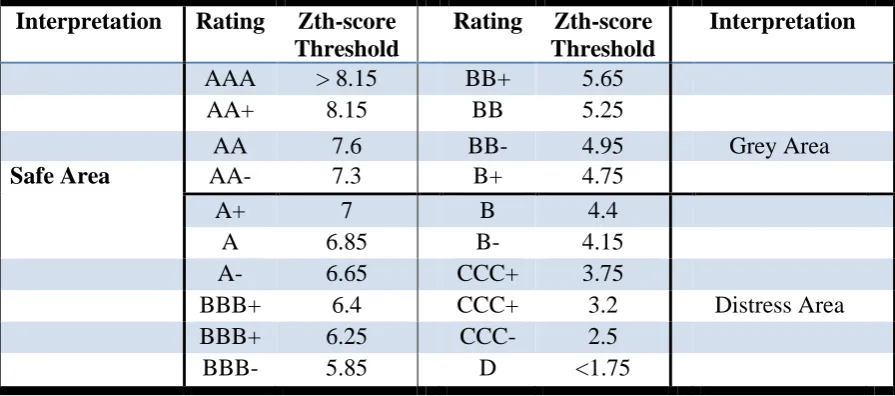
Table 1: Correspondence between the Z-score and Standard and Poor’ Rating
Interpretation Rating Zth-score Threshold
Rating Zth-score Threshold
Interpretation
AAA > 8.15 BB+ 5.65
AA+ 8.15 BB 5.25
AA 7.6 BB- 4.95 Grey Area
Safe Area AA- 7.3 B+ 4.75
A+ 7 B 4.4
A 6.85 B- 4.15
A- 6.65 CCC+ 3.75
BBB+ 6.4 CCC+ 3.2 Distress Area
BBB+ 6.25 CCC- 2.5
BBB- 5.85 D <1.75
Source: Altman and Hotchkiss (2006, p.314)
8
𝑍 1 = 1.2 β 1 + 1.4 β 2 + 3.3 β 3 + 0.6 β 4 + 1.0 β5 ……… ……….... (2)
Where
β 1 = Net Working Capital divided by Total Assets (WC/TA)
β 2 = Retained Earnings for the year divided by Total Assets (RE/TA) β 3 = Earnings before Interest and Tax divided by Total Assets (EBIT/TA)
β 4 = Market Value of Shareholders’ Equity divided by Book Value of Total Liabilities (MVE/TL)
β5 = Revenue divided by Total Assets
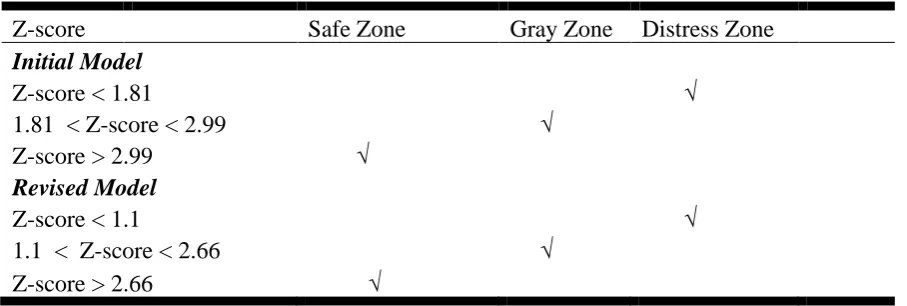
Table 2: Classification according to Altman (1993) Z-score
Z-score Safe Zone Gray Zone Distress Zone
Initial Model
Z-score < 1.81 √
1.81 < Z-score < 2.99 √
Z-score > 2.99 √ Revised Model
Z-score < 1.1 √
1.1 < Z-score < 2.66 √
Z-score > 2.66 √
9 Results and Analysis
The researcher analysed the financial performance of defunct UT Bank Limited between 2007 and 2016 using a number of bank stability and insolvency measures. The study was limited to only UT Bank Limited due to unavailability of published financials of other banks that suffered same fate, on which to base conclusion.
The Unique Trust Bank (UT Bank) Ltd was rebranded in May 2009 and got listed into the Ghana Stock Exchange in 2010 under the brand name UTB. It was one of privately owned indigenous commercial banks in Ghana prior to the revocation its licence together with Capital Bank Ltd in August 2017. In order to compare average performance selected variables over ten (10) years, analysis was done under two headings; Risk and Leverage / stability and solvency.
Risk and Leverage Measurement Ratios Debt-to-Equity-Ratio (DER)
10
Table 3: Bank Level Stability Variable Performance
2007 2008 2009 2010 2011 2012 2013 2014 2015 2016 µ Ơ CV DER 5.83 6.54 8.1 9.1 10.6 6.7 9.4 10.8 4.8 4.5 7.6 2.30 3.3 EM 6.8 7.6 9.1 10.1 11.6 7.7 10.4 11.8 5.8 5.5 8.6 2.30 3.8 DAR 0.85 0.86 0.89 0.9 0.91 0.87 0.9 0.91 0.83 0.82 0.9 0.03 26.4 Source: Author’s own computation from bank financials (2007-2016)
It is realised that, an average mean score of 7.6 over the ten year period was recorded in terms DER. One of the implications is, UT Bank’s creditors provided 0.76 out of every cedi financed by the bank. In an unlikely event where assets value declines, it will have the potency of damaging lenders, since they have preferential rights of payment. In fact, it’s unsafe to go beyond 50% DER threshold. That is, a bank should finance 0.5 of every GH¢1 (Creditors bear 0.5). Equity owners are comfortable when high DER values. The reverse is true of lenders and depositors. Lenders tend to interfere with the management of the bank due to higher DER which allows them a higher stake in financial decisions either directly or otherwise.
11 Equity Multiplier (EM)
Equity Multiplier (EM) is one of financial leverage ratios that are a representation of the proportion of bank’s assets financed by shareholders relative to lenders. It is estimated that, about 70-90 percent of banks’ assets is tied to loans and advances (Koflowits, 2019). Table 3 shows that 8.6 percent of UT Bank’s assets were financed by owners’ equity as against 1.4 percent financed by lenders/customers’ deposits. A higher EM value draws the bank to risk of failure (Sheikh-Wagas, 2005). That perhaps would have gratified investors because UT Bank used more equity to purchase assets than they used debt. To finance assets purchase. It must quickly be stressed that, a higher equity rations sometimes could be a strategy used by the bank to look profitable so as to purchase assets at a low cost.
Traditionally, a higher EM is not a safe place for a bank to stay, and very risky as it is an unhealthy practice and serves as a conduit for discontinuity. A trigger of high default by customers or debtors to the bank in the form of non-performing loans, UT Bank had a high tendency going distressed as was the case.
Debt-to-Asset-Ratio (DAR)
12
out of every GH¢1 ownership claim by UT Bank, only 0.1 pesewa is really owned in terms of in real assets. Efficiency in banking sector is paramount if and positively impacts on banks’ stability. Seelanatha (2010) studied bank’s profitability using the efficiency theories and found better performance and best management practices to have a high dependency on bank’s efficiency. Inefficient banks are associated with high debt ratios.
Solvency Measurement
The Z-score has gained wide spread acceptance as a measure of bank stability and the inverse of the probability of insolvency in the bank industry and financial stability literature (Bouvatier, Lepetit, Rehault and Strobel, 2017). The researcher used RoA-based Z-score and Altman (2006) Z-score Plus to potentially compare capitalisation and returns or variability and returns. This was made possible by the use of accounting data. Table 4 has computed results.
Table 4: Results of Z-scores computed from different Approaches
2007 2008 2010 2011 2012 2012 2013 2014 2015 2016 Average FV-Zscore 10.6 9.4 8.3 7.6 6.8 9.4 7.4 6.8 11.8 12.3 9.04 LN-Zscore 2.4 2.2 2.1 2.0 1.9 2.2 2.0 1.9 2.50 2.5 2.17 𝑍 1 -score 1.7 1.5 1.1 0.9 0.8 1.3 1.4 1.7 1.50 1.9 1.38 Source: Author’s own computation from bank financials (2007-2016)
13 Conclusion and Recommendations
Stability measures of banks and their ability to take risk are very central to arguably determine if they are capable of generating income to meet fixed cost. Uncontrollable rising debt is justifiably a source of concern, especially when used unwisely and without moderation could spark financial crisis. UT Bank’s ability to control its debt to assets, debt to equity and equity multiplier was weak. Per results from its financials and the methodology adopted by the researcher, UT Bank relied heavily on external debt since it was unable to internally generate adequate income to meet its fixed costs and to oblige to claims from creditors; hence 90% of its resource ownership literally was to creditors.
14 Limitation of Study
15
Abor, J.Y., Gyeke-Dako, A., Fiador, V.O., Agbloyor, E.K., Amidu, M., & Mensah, L. (2019). Money and banking in Africa loan portfolio and credit management. Advances in African Economic, Social and Political Development, Springer Nature. doi.org/10.1007/978-3-319-77458-9
Aguenaou, S., Lahrec, A., & Bounakaya, S. (2017). Analyzing banks’ efficiency as a measurement of performance in the Moroccan context: Application of CAMEL Framework. International Review of Research in Emerging Markets and the Global Economy, 3 (1), 1105-1121
Altman, E. I. (1968). Financial ratios, discriminant analysis and the prediction of corporate bankruptcy. Journal of Finance, 189–209.
Altman, E.I. & Hotchkiss, E. (2006). Corporate financial distress & bankruptcy. 3rd edition. J. Wiley & Sons. Hoboken, New Jersey
Attefah, E.K, & Darko, E.A. (2016). Financial ratios approach to evaluating financial performance of Cal Bank Ghana from 2010 to 2014 International Journal of Academic Research in Business and Social Sciences, 6(6), 150-176
Basel Committee on Banking Supervision, BCBS. (2010). Basel III and financial stability. Bank for International Settlement
Berger, A. (1995). The profit-structure relationship in banking – Tests of market-power and efficient-structure hypotheses. Journal of Money, Credit and Banking, 404 420.
Central Bank of Nigeria [CBC] (2010). Annual report bullion; January-march
Kaufman, G. (1966). Bank market structure and performance: The evidence from Iowa. Southern Economic Journal, 429-439.
Lepetit, L., Nys, E., Rous, P. & Tarazi, A. (2008). Bank income structure and risk: An empirical analysis of European banks. Journal of Banking and Finance, 32(8), 1452-1467
Li, X., Tripe, D., & Malone, C. (2017). Measuring bank risk: An exploration of z-score
16
Financial Performance of Banks, International Journal of Applied Business and Economic Research, 15(23), 300-312
Nyalatorgbi, E. (2019). Bank of Ghana closes seven banks in banking crisis: African Agenda, Third World Network Africa, 21(3), 33-36
Rhoades, S. (1985). Market share as a source of market power: Implications and some evidence. Journal of Economics and Business, 3 (4), 343-355.
Seelanatha, L. (2010). Market structure, efficiency and performance of banking industry in Sri Lanka. Banks and bank systems, 5(1), 65-75
Sheikh Waqas, A. (2005). Financial statement analysis of bank, Falah. Virtual University Pakistan, Pakistan
Shepherd, W. (1986). Tobins’q and the Structure-Performance Relationship: Comment. The American Economic Review, 76(5), 1205-1210
Smirlock, M. (1985). Evidence of the (non) relationship between concentration and profitability in banking. Journal of Money, Credit and Banking, 17(1), 69-74. Srairi, S. (2013). Ownership structure and risk-taking behaviour in conventional and
Islamic banks: Evidence for MENA countries. Borsa Istanbul Review, 13(4) Taboi, L. (2017). How the Kenyan banks went under African Business.
Tassev, L. (2019). Three bank failures open new chapter in never-ending financial crisis
Torna, G. & DeYoung, R., (2013). Nontraditional banking activities and bank failures during the financial crisis. Journal of Financial Intermediation 22, 397