Financial performance analysis of selected banks using CAMEL Model
Mrs.JyotiTalreja Assistant Professor Gogte Institute of Technology
Dr.Shivappa Associate Professor
Kousali Institute of Management Studies Karnatak University Dharwad
Abstract
Banking is a fast growing sector it is approaching stock market for further capital requirement public sector banks need further capital to meet their Basel III norms.Banking sector in India is very essential for the growth of the economy and therefore it should attract investors. It is now predominantly significant for bankers to increase the shareholders wealth and encourage them for more investment in banks.A rationale investor will consider the overall performance of any sector before investing on the basis of profitability, management efficiency, goodwill, growth rate long term sustainability etc., there are various methods to measure the performance of banking sector one such method is CAMEL Model this model measures overall performance of the banking sector. It uses various ratios in each of the parameters, CAMEL rating can also be used to analyse which bank needs high supervision and support form RBI. In this paper an attempt is made to compare the financial performance of selected private sector and public sector banks in India for a period of 4 years from 2011-12 to 2014-15 using CAMEL model. From the analysis it is observed that Private sector banks have performed better in terms of capital adequacy, earning capability, asset quality, and public sector banks have performed better in liquidity and management capability for the selected period.
Key Words:Bank, CAMEL, Capital adequacy, Financial Performance, profitability, shareholders value.
Introduction
Banking sector provides a wide range of services to a wide range of customers. It lends to almost all types of industries, hence it is considered as an integral part of the Indian economy and the performance of banking sector has an impact on the economy. Banking sector is considered as a
barometer of economy which reflects the macroeconomic variables. Structure of Indian banking System
CAMEL Model
CAMEL stands for Capital Adequacy, Asset Quality, Management Competence, Earning Quality, and
Liquidity. This model measures the performance of the organization using the above five parameters which helps in analysing the organizations performance from different point of views. It is a ratio based model to analyse the performance of the banks. Camel models helps to rate the banks performance on a five parameter scale.
Capital Adequacy: it is important to analyse the capital structure of the banks because it is important to retain confidence of all the investors, and avoid the bank from being insolvent. It also deals with the ability of the bank to meet its additional financial requirements. The following four ratios are measured to find the capital adequacy of the banks.
Capital adequacy ratio
Debt equity ratio
Total advances to total asset ratio
Government securities investments
1.
Asset Quality: this ratio helps to analyse the quality of assets the bank has created to earn income, i.e., what quality of loans are given to earn interest income. Quality of loan means less number of defaulters or non-performing assets. The major aim of this ratio is to measure the Non-performing assets as compared to the total assets. The following four ratios are required to measure the asset quality of the banks.Structure of Indian banking System
Reserve Bank of India
Commercial Banks
Co-operative Banks
State Co-operative
Developmental Banks and other Financial Institutions
Public Sector Banks
Regional Rural Banks
Central Co-operative Foreign Banks
Net NPAs-to-total Asset ratio
Net NPA to total Advance ratio
Total investment to total asset ratio
Percentage change in NPAs
2.
Management Competence: this ratio measures the competence of management to earn better returns and to add value to the shareholders. It measures the earnings on the basis of per employee which helps the management their contribution to know towards the banks. Management of a bank plays crucial role in making many strategic decisions. Therefore it is important to measure management efficiency. The following four ratios are used to measure the management competence Total advance to total deposit ratio
Profit per employee
Business per employee
Return on net worth
3.
Earning Quality: As it is important to measure the earnings of the bank made through the assets employed it is also important to measure the quality of the earnings this means the consistency of earnings over the years. The ratios used to measure the earning quality are Return on asset ratio
Spread ratio
Percentage change in net profits
4.
Liquidity: managing liquidity is a big task for the bankers as they have to properly hedge their risk, earn better returns at the same time maintain liquidity to allow the investors to withdraw their investments whenever required. Therefor the banks must have a proper balance between liquidity, risk and returns. The following ratios are used to measure the liquidity of the banks. Liquid assets to total assets
Liquid assets to total deposits
Government securities to total assets
Literature review
PrabhjotKaur(2015): A Financial Performance Analysis of the Indian Banking Sector Using CAMEL Model: conducted a study on financial performance of five public sector banks and five private sector banks for a period from 2009 to 2014 using CAMEL model. In this paper each bank is studied in detail on each parameter of CAMEL and the mean of each parameter is found, the author has also applied regression analysis to find out the most dominant factor from the 17 factors considered for the study. The results of step-wise regression show that profit per employee, total advances-to-total deposits ratio, debt-equity ratio, capital adequacy ratio and total investments-to-total assets ratio are the most impacting factors on the performance of the banks.
Jayanta Kumar Nandi: Comparative Performance Analysis ofSelect Public and Private Sector Banks in India: An Application of CAMEL Model: this paper evaluates the financial performance of 10 public sector and 10 private sector banks in India for a period of 2001 to 2012. Results shown that on average Bank of Baroda occupies the top most position followed by ICICI Bank and HDFC Bank As a whole, selected public sector banks perform better than selected private sector banks. The banks were selected on the basis of their total Income and balance sheet size
Gowri.M Ramya. G: An empirical study on banking sectorwith the use of CAMEL model: This paper has evaluated ban performance on the basis of CAMEL model and ranked the banks on a scale of 1 to 10, 1 being the highest rank and 10 being the lowest. After ranking the banks on each parameter average rank of each parameter was taken on the basis of which the banks were ranked as a whole on the CAMEL model from the analysis Bank of Baroda had performed well and secured 1st rank followed by Andhra bank, Axis Bank, Bank of India, HDFC, ICICI, Canara Bank, SBI and Syndicate bank.
GaziaJamilSayed ,NajmusSaharSayed: Comparative Analysis of Four Private Sector Banks as per CAMEL Rating : four private sector banks namely Axis Bank, HDFC Bank, ICICI Bank Ltd. and Kotak Mahindra Bank Ltd. The data used in the study relate to the banks which are among the list of 'Top Ten Banks in India - as per greenworldinvestor.com and ETIG database and are listed on the Bombay Stock Exchange (BSE). Each bank was analyzed for three years on the basis of CAMELS parameters based on the average ratios the banks were ranked for performance. The author suggests various other techniques of financial performance can be applied for future research.
Dharmendra Singh and GarimaKohli: Evaluation of Private Sector Banks in India A SWOT Analysis: This paper attempts to undertake SWOT Analysis of 20 old and 10 new private sector banks. These banks have also been ranked on the basis of financial data for the years 2003, 2004 and 2005. The study has used CAMEL model for evaluating these banks. The author concludes that the banks should adopt latest technology to excel in banking and to sustain competition. Another important feature of banking industry is mergers and acquisitions. The banking sector is into consolidation
Dr.D.Maheshwara Reddy K.V.N.Prasad EVALUATING PERFORMANCE OF REGIONAL RURAL BANKS: AN APPLICATION OF CAMEL MODEL: this paper evaluates the financial performance of Regional Rural banks using CAMEL model during post reorganization period. The authors have selected two RRB’s Andhra PragathiGrameenaBank ,SapthagiriGrameena Bank. Analysis is done for a period from 2006-2010.
Mishra Aswini Kumar, G. Sri Harsha, ShiviAnand and Neil Rajesh Dhruva: Analyzing Soundness in Indian Banking: A CAMEL Approach: The objective of this paper was to analyse the performance of 12 public and private sector banks for a period of 11 years from 2000-2011 using CAMEL model. It was found that private sector banks have performed well and public sector banks display low economic soundness in comparison. Theyconclude that performance of the banks cannot be judged solely based on the absolute values of the
CAMEL ratios because ranking is subjectto criticism as the ratios used for the purpose of ranking can be interpreted in different ways by different people.
Research methodology
Type of research: descriptive research is been used for this study it describes the performance of the selected banks over the years
Sample selected: CAMEL analysis is done for 6 banks 3are public sector banks and 3 are private sector banks. The criteria for selecting these banks are 1) the banks should be listed on the stock exchange during the period of study 2) on the basis of total asset value the top three banks having highest total asset value were selected both from public and private sector banks.
Selected banks are State Bank of India, Bank of Baroda, Bank of India, ICICI Bank, HDFC bank, and Axis bank
Period of study: the study is conducted based on the data collected for a period of 4 years from 2011-12 to 2014-15
Sources of data: secondary data like the financial statements of banks was collected through the annual reports of banks and the Ace Equity analyser software.
Data Analysis and Interpretation
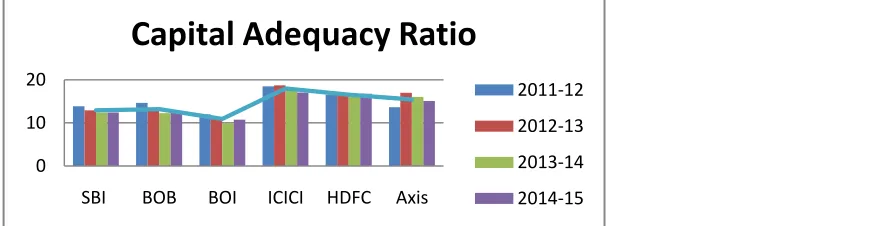
1. Capital Adequacy
Table No. 1.1
Capital Adequacy ratio
Year/Banks SBI BOB BOI ICICI HDFC Axis
2011-12 13.86 14.67 11.95 18.52 16.5 13.66
2012-13 12.92 13.3 11.02 18.74 16.8 17
2013-14 12.44 12.28 9.97 17.7 16.07 16.07
2014-15 12.44 12.6 10.73 17.02 16.79 15.09
Average 12.915 13.2125 10.9175 17.995 16.54 15.455
From the above analysis we can observe that ICICI bank maintained highest capital adequacy ratio followed by HDFC, Axis, Bank of Baroda, SBI and Bank of India. Private sector banks have performed better in capital adequacy providing high safety to their investors
Table No. 1.2
Debt Equity Ratio
SBI BOB BOI ICICI HDFC Axis
2011-12 1.51 0.9 1.63 2.32 0.8 1.49
2012-13 1.71 0.86 1.56 2.18 0.91 1.33
2013-14 1.55 1.05 1.85 2.11 0.91 1.32
2014-15 1.6 0.91 1.44 2.14 0.73 1.79
Average 1.5925 0.93 1.62 2.1875 0.8375 1.4825
Graph No 1.2
From the above analysis we can observe that on an average ICICI bank followed by SBI and Axis bank have higher debts in the bank which indicates high risk and low performance of the banks
Table No. 1.3
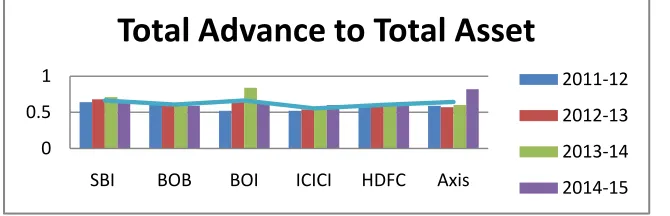
Total Advance to Total Asset
Year/Banks SBI BOB BOI ICICI HDFC Axis
2011-12 0.64 0.64 0.52 0.52 0.58 0.59
2012-13 0.68 0.6 0.66 0.54 0.6 0.57
2013-14 0.71 0.6 0.84 0.56 0.62 0.6
2014-15 0.63 0.59 0.64 0.6 0.62 0.82
Average 0.665 0.6075 0.665 0.555 0.605 0.645
Graph No 1.3
0 2 4
SBI BOB BOI ICICI HDFC Axis
Debt Equity Ratio
2011-12
2012-13
2013-14 0
10 20
SBI BOB BOI ICICI HDFC Axis
Capital Adequacy Ratio
2011-12
2012-13
2013-14
From the above analysis we can observe that SBI, BOB and Axis bank have higher total advance ratio this indicates that the banks have highest lending leading to more profit.
Table No. 1.4
Government Securities Investments Rs. In Million
SBI BOB BOI ICICI HDFC Axis
2011-12 2,558,336.00 691,882.00 715,705.70 869,480.21
762,178.49 584,162.12
2012-13 2,692,602.00 1,020,445.00 794,907.50 923,762.92
849,023.18 722,498.59
2013-14 3,081,988.08 957,360.94 966,802.60 951,820.56
946,400.17 690,967.20
2014-15 3,776,542.00 968,976.40 1,019,949.00 1,056,108.70
1,203,902.96 812,460.11
Average 3,027,367.02 909,666.09 874,341.20 950,293.10
940,376.20 702,522.01
Graph No 1.4
From the above analysis we can observe that on an average SBI has a highest investment in government securities followed by other banks. Investing in government securities is considered safe
0 0.5 1
SBI BOB BOI ICICI HDFC Axis
Total Advance to Total Asset
2011-12 2012-13 2013-14 2014-15 -1,000,000.00 2,000,000.00 3,000,000.00 4,000,000.00
SBI BOB BOI ICICI HDFC Axis
Government Securities Investments
2011-12
2012-13
2013-14
2014-15
2. Asset Quality
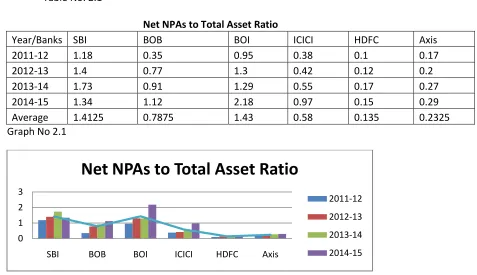
Table No. 2.1
Net NPAs to Total Asset Ratio
Year/Banks SBI BOB BOI ICICI HDFC Axis
2011-12 1.18 0.35 0.95 0.38 0.1 0.17
2012-13 1.4 0.77 1.3 0.42 0.12 0.2
2013-14 1.73 0.91 1.29 0.55 0.17 0.27
2014-15 1.34 1.12 2.18 0.97 0.15 0.29
Average 1.4125 0.7875 1.43 0.58 0.135 0.2325
Graph No 2.1
From the above analysis we can observe that SBI has the highest NPAs to total Assets followed by Bank of India and Bank of Baroda. These banks have to manage their NPAs compared to public sector banks private sector banks have low NPAs in their total assets
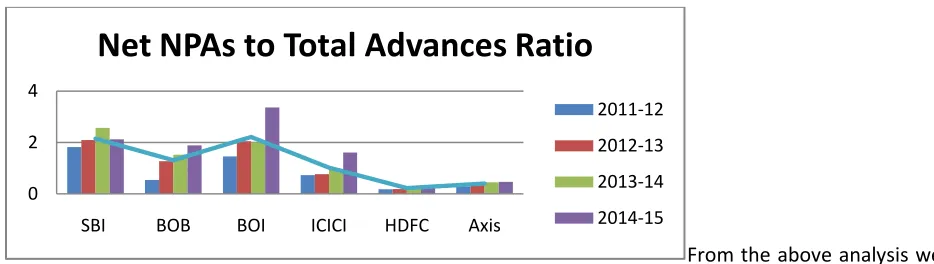
Table No. 2.2
Net NPAs to Total Advances Ratio
Year/Banks SBI BOB BOI ICICI HDFC Axis
2011-12 1.82 0.54 1.46 0.73 0.18 0.29
2012-13 2.09 1.27 2.05 0.77 0.19 0.38
2013-14 2.57 1.52 2 0.97 0.27 0.45
2014-15 2.12 1.89 3.36 1.61 0.25 0.47
Average 2.15 1.305 2.2175 1.02 0.2225 0.3975
0 1 2 3
SBI BOB BOI ICICI HDFC Axis
Net NPAs to Total Asset Ratio
2011-12
2012-13
2013-14
Graph No 2.2
From the above analysis we can observe that public sector banks on an average have high NPAs as compared to private sector banks. Government must take initiatives to reduce these NPAs.
Table No. 2.3
Percentage change in Net NPAs to Net Advances
Year/Banks SBI BOB BOI ICICI HDFC Axis
2011-12 1.82 0.54 1.47 0.73 0.18 0.27
2012-13 2.1 1.28 2 0.77 0.2 0.36
2013-14 2.57 1.52 2 0.97 0.27 0.44
2014-15 2.12 1.89 3.36 1.61 0.25 0.46
Average 2.153 1.3075 2.2075 1.02 0.225 0.3825
Graph No 2.3
From the above analysis we can observe that public sector banks on an average have high NPAs as compared to private sector banks.
0 2 4
SBI BOB BOI ICICI HDFC Axis
Net NPAs to Total Advances Ratio
2011-12
2012-13
2013-14
2014-15
0 1 2 3 4
SBI BOB BOI ICICI HDFC Axis
Percentage change in Net NPAs to
Net Advances
2011-12
2012-13
2013-14
2014-15
3. Management Capability
Table No. 3.1
Total Advance to Total Deposit Ratio
Year/Bank SBI BOB BOI ICICI HDFC Axis
2011-12 0.83 0.75 0.78 0.99 0.79 0.77
2012-13 0.87 0.69 0.76 0.99 0.81 0.78
2013-14 0.87 0.7 0.78 1.02 0.82 0.82
2014-15 0.82 0.69 0.76 1.07 0.81 0.87
Average 0.848 0.7075 0.77 1.0175 0.8075 0.81
Graph No 3.1
From the above analysis we can observe that ICICI bank followed by SBI, Axis bank and others has the highest ability to convert its deposits into advances, which is a good sign and will improve profitability of the bank.
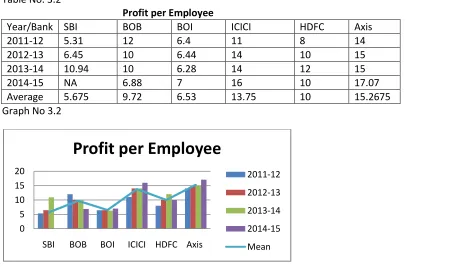
Table No. 3.2
Profit per Employee
Year/Bank SBI BOB BOI ICICI HDFC Axis
2011-12 5.31 12 6.4 11 8 14
2012-13 6.45 10 6.44 14 10 15
2013-14 10.94 10 6.28 14 12 15
2014-15 NA 6.88 7 16 10 17.07
Average 5.675 9.72 6.53 13.75 10 15.2675
Graph No 3.2
0 0.5 1 1.5
SBI BOB BOI ICICI HDFC Axis
Total Advance to Total Deposit Ratio
2011-12
2012-13
2013-14
2014-15
Mean
0 5 10 15 20
SBI BOB BOI ICICI HDFC Axis
Profit per Employee
2011-12
2012-13
2013-14
2014-15
From the above analysis we can observe that Axis Bank has made the highest profit per employee followed by ICICI bank HDFC and BOB. It can be seen that private banks have earned more profits compared to public banks.
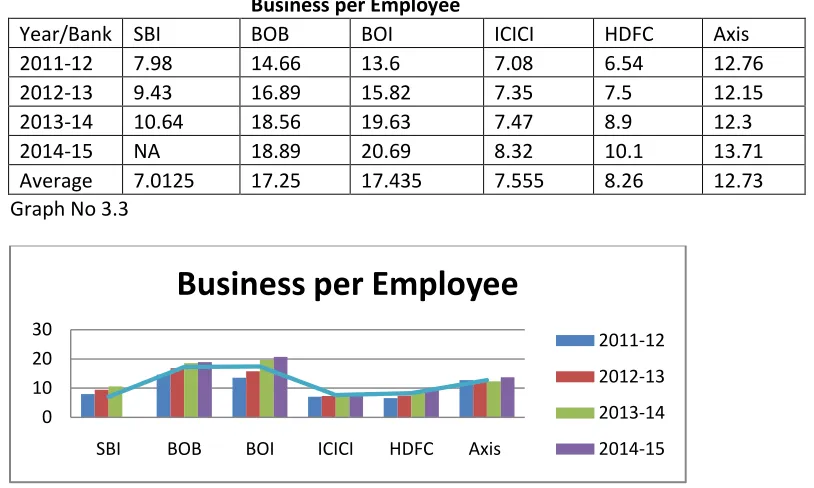
Table No. 3.3
Business per Employee
Year/Bank SBI BOB BOI ICICI HDFC Axis
2011-12 7.98 14.66 13.6 7.08 6.54 12.76
2012-13 9.43 16.89 15.82 7.35 7.5 12.15
2013-14 10.64 18.56 19.63 7.47 8.9 12.3
2014-15 NA 18.89 20.69 8.32 10.1 13.71
Average 7.0125 17.25 17.435 7.555 8.26 12.73
Graph No 3.3
From the above analysis we can observe that BOI followed by BOB, Axis bank and others has highest business per employee. That means these banks have high efficiency in creating business.
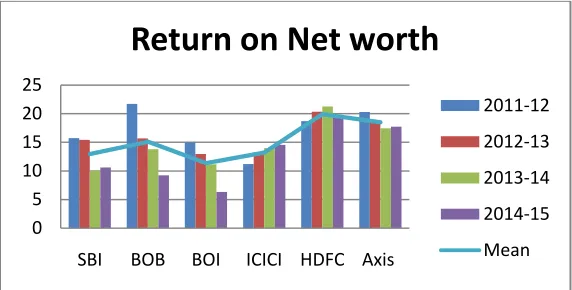
Table No. 3.4
Return on Net worth
Year/Bank SBI BOB BOI ICICI HDFC Axis
2011-12 15.72 21.72 15 11.2 18.69 20.29
2012-13 15.43 15.68 12.95 13.1 20.34 18.53
2013-14 10.03 13.8 11.16 14.02 21.28 17.43
2014-15 10.62 9.21 6.32 14.55 19.37 17.75
Average 12.95 15.1025 11.3575 13.2175 19.92 18.5
0 10 20 30
SBI BOB BOI ICICI HDFC Axis
Business per Employee
2011-12
2012-13
2013-14
Graph No 3.4
From the above analysis we can observe that HDFC bank followed by Axis bank, BOB and others has highest net worth which means these banks have competency to make higher returns on invested capital.
4. Earning capacity
Table No. 4.1
Return on Asset
Year/Bank SBI BOB BOI ICICI HDFC Axis
2011-12 0.88 1.24 0.72 1.5 1.8 1.68
2012-13 0.97 0.9 0.65 1.7 1.9 1.7
2013-14 0.65 0.75 0.51 1.78 2 1.78
2014-15 0.68 0.49 0.27 1.86 2.00 1.83
Average 0.795 0.845 0.5375 1.71 1.925 1.7475
Graph No 4.1
From the above analysis we can observe that private sector banks have utilised their assets efficiently and generated better return on assets as compared to public sector banks.
0 5 10 15 20 25
SBI BOB BOI ICICI HDFC Axis
Return on Net worth
2011-12
2012-13
2013-14
2014-15
Mean
0 1 2 3
SBI BOB BOI ICICI HDFC Axis
Return on Asset
2011-12
2012-13
2013-14
2014-15
Table No. 4.2
Spread as a percentage of asset
Year/Bank SBI BOB BOI ICICI HDFC Axis
2011-12 3.24 2.31 2.16 2.19 3.81 2.81
2012-13 2.83 2.07 1.99 2.58 3.95 2.84
2013-14 2.75 1.81 1.89 2.77 3.76 3.12
2014-15 2.68 1.84 1.83 2.94 3.79 3.07
Average 2.875 2.0075 1.9675 2.62 3.8275 2.96
Graph No 4.2
From the above analysis we can observe that spread ratio is highest for HDFC bank followed by Axis Bank, SBI and others reflecting high earning capacity
Table No. 4.3
Percentage Change in Net Profit
Year/Bank SBI BOB BOI ICICI HDFC Axis
2011-12 41.66 18.04 7.59 25.21 31.6 25.19
2012-13 20.48 -10.51 2.68 28.77 30.18 22.09
2013-14 -22.78 1.35 -0.73 17.84 26.05 20.05
2014-15 20.3 -25.61 -37.39 13.91 20.49 18.34
Average 14.915 -4.1825 -6.9625 21.4325 27.08 21.4175
0 2 4 6
SBI BOB BOI ICICI HDFC Axis
Spread as a percentage of asset
2011-12
2012-13
2013-14
2014-15
Graph No 4.3
From the above analysis we can observe that percentage change in net profit is highest for HDFC bank. Private sector banks have performed well as compared to public sector banks as BOB and BOI have negative profits
5. Liquidity
Table No. 5.1
Government Securities to Total Assets
Year/Bank SBI BOB BOI ICICI HDFC Axis
2011-12 19.16 15.47 18.61 17.78 22.56 20.45
2012-13 17.19 18.65 17.56 17.21 21.21 21.21
2013-14 17.19 14.52 16.87 16.01 19.25 18.03
2014-15 18.44 13.55 16.49 16.35 20.39 17.59
Average 17.99 15.55 17.38 16.84 20.85 19.32
Graph No 5.1
From the above analysis we can observe that HDFC bank followed by Axis and SBI have higher government securities to total asset ratio
-60 -40 -20 0 20 40 60
SBI BOB BOI ICICI HDFC Axis
Percentage Change in Net Profit
2011-12
2012-13
2013-14
2014-15
Mean
0.00 10.00 20.00 30.00
SBI BOB BOI ICICI HDFC Axis
Government Securities to
Total Assets
2011-12
2012-13
2013-14
2014-15
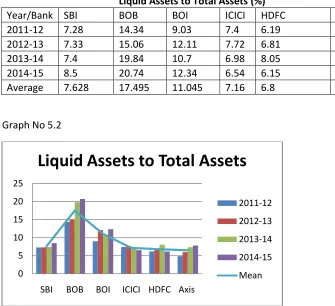
Table No. 5.2
Liquid Assets to Total Assets (%)
Year/Bank SBI BOB BOI ICICI HDFC Axis
2011-12 7.28 14.34 9.03 7.4 6.19 4.87
2012-13 7.33 15.06 12.11 7.72 6.81 6
2013-14 7.4 19.84 10.7 6.98 8.05 7.36
2014-15 8.5 20.74 12.34 6.54 6.15 7.81
Average 7.628 17.495 11.045 7.16 6.8 6.51
Graph No 5.2
From the above analysis we can observe that public sector banks have higher liquid assets in total assets as compared to the private sector banks. Bank of Baroda being the highest
Table No. 5.3
Liquid Assets to Total Deposits (%)
Year/Bank SBI BOB BOI ICICI HDFC Axis
2011-12 9.3 16.66 10.9 14.18 8.49 6.33
2012-13 9.54 18.02 14.36 14.15 9.21 8.08
2013-14 9.5 23.01 12.86 12.51 10.78 10.05
2014-15 11.08 24.02 14.36 11.7 8.05 11.19
Average 9.855 20.4275 13.12 13.135 9.1325 8.9125
Graph No 5.3
0 5 10 15 20 25
SBI BOB BOI ICICI HDFC Axis
Liquid Assets to Total Assets
2011-12
2012-13
2013-14
2014-15
From the above analysis we can observe that public sector banks have higher liquid assets in total deposits as compared to the private sector banks. Bank of Baroda being the highest
Conclusion:
In this paper an attempt is made to study the financial performance of selected private and public sector banks. Through the study it is observed that In terms of capital adequacy private sector banks have performed better among those ICIC bank has the capital adequacy, in terms of debt equity ratio SBI and ICICI bank have more leverage compared to other banks, in terms of total advances SBI is leading followed by Bank of Baroda and axis bank and in terms of government securities SBI has the highest investments.
In terms of asset quality public sector banks have high NPAs as compared to selected private sector banks for the period therefore we can say that asset quality of private sector banks was better for the selected period. In terms of management capability private sector banks have performed better in profit per employee ratio, total advances ratio and return on net worth ratio whereas public sector banks are leading in business per employee ratio. Overall private sector banks have performed better in management capability. In terms of earning capacity private sector banks have performed better in all the ratios whereas public sector banks have also incurred losses during the study period. In terms of liquidity selected public sector banks have better liquidity position than the selected private sector banks. To conclude Camel model is a good measure to evaluate overall performance of the banks but using it solely may not be advised there are other value based measures like economic value added, market value added etc. which can be applied to know the economic financial performance of the banks. A combination of different methods will give better performance measurement.
0 5 10 15 20 25 30
SBI BOB BOI ICICI HDFC Axis
Liquid Assets to Total Deposits (%)
2011-12
2012-13
2013-14
2014-15
References
Mihir Dash, GarimaKumari and SnehaAnand, Journal of Accounting and Finance Volume 29, No.1 October2014-March 2015
Jayanta Kumar NandiPerformance Analysis of Select Public and Private Sector Banks InIndia: An Application of CAMEL Model
Gowri.MRamya. GSona Global Management Review | Volume 8 | Issue 1 | November 2013
PrabhjotKaurThe IUP Journal of Bank Management, Vol. XIV, No. 4, 2015
GaziaJamilSayed,NajmusSaharSayed,January-June, 2013 Journal of Business Perspectives and Research
Dharmendra Singh and GarimaKohliJournal of Management ResearchVolume 6, Number 2 • August 2006
K.V.N. Prasada*, G. Ravinderb International Journal of Trade and Commerce-IIARTC January-June 2012, Volume 1, No. 1, pp. 23-33 ISSN-2277-5811
Dr.D.Maheshwara ReddyK.V.N.Prasad-Journal of Arts, Science & Commerce ■ E-ISSN 2229-4686 ■ ISSN 2231-4172