M
ANUS
C
R
IP
T
AC
C
EP
TE
D
Test retest reliability and predictive validity of a juvenile guide dog behavior test
1
Harvey, Naomi*1; Craigon, Peter1; Sommerville, Rebecca2; McMillan, Caroline1; Green, 2
Martin1; England Gary1; and Asher, Lucy3 3
1The University of Nottingham, School of Veterinary Science & Medicine, Sutton Bonington, 4
LE12 5RD, UK. 5
2Royal School of Veterinary Studies, Easter Bush, Midlothian, Edinburgh, EH25 9RG. 6
3Centre for Behavior and Evolution, Henry Wellcome Building, Newcastle 7
University, Newcastle, NE2 4HH, UK. 8
9
*Corresponding author: [email protected] 10
11
Keywords: Juvenile; Guide dog; Behavior test; Consistency; Validity; Reliability 12
13
ABSTRACT
14
The ability to measure stable and consistent behavioral traits in dogs would facilitate 15
selection and assessment of working dogs, such as guide dogs. Ideally, these measures 16
should predict suitability for the working role from a young age. This study assessed test-17
retest reliability of a juvenile guide dog behavior test and predictive validity using 18
qualification or withdrawal from guide dog training. Ninety-three guide dog puppies (52F; 19
41M) were tested at 5 (mean 4.78; ± 0.73 SD) and 8 (mean 7.98; ± 0.78 SD) months of age. 20
The dogs were exposed to a sequence of 11 stimuli designed to assess the dogs’ reactions 21
to: meeting a stranger, obedience commands, body sensitivity, scavenging, and ‘animal’ and 22
human distractions. The behavior of dogs was digitally recorded and analysed using an 23
ethogram incorporating both frequency of behavior and specific reactions to stimuli. Test-24
retest reliability indicated inter-individual consistency in many of the behavioral measures 25
such as jumping, barking and ‘low’ greeting posture. Behavior measures that did not show 26
inter-individual consistency between tests included obedience responses, lip-licking, body 27
shaking and scratching. Binary logistic regression models revealed seven behavioral 28
measures at five months and five measures at eight months that were significantly 29
associated with qualification or withdrawal. Uncorrelated measures and principal 30
M
ANUS
C
R
IP
T
AC
C
EP
TE
D
that showed great potential for predicting the probability of a dog qualifying or being 32
withdrawn from guide dog training. 33
34
INTRODUCTION
35
Puppy testing (the assessment of behavioral responses in puppies) has been referred to as 36
“the holy grail of temperament testing” (Miklosi, 2011). This description reflects the 37
potential value of predicting future behavior from a young age to future owners and 38
rehoming and working dog organisations. Valid and reliable behavior tests could be 39
invaluable, enabling the selection of dogs suitable to owner need, specific working dog roles 40
such as support, police or guide dogs, and aid in suitable placement of puppies to homes 41
from rescue shelters (King et al., 2012). The four periods of development during 42
‘puppyhood’ are the neonatal, transitional, socialisation, and juvenile periods (Scott and 43
Fuller, 1965). The juvenile period is the longest, beginning at approximately three months of 44
age and continuing until sexual maturity (Scott and Fuller, 1965). Domestic dogs typically 45
undergo sexual maturity between 6-9 months of age, but behavioral, or social, maturity is 46
considered to be achieved anywhere from 12 to 24 months of age depending on breed 47
(Overall, 2013). Despite the juvenile period being defined as ending at sexual maturity, the 48
majority of published studies consider dogs less than 1 year of age to be puppies and dogs 49
greater than 1 year of age to be adults, or young adults (Fratkin et al., 2013). 50
The juvenile period is currently the least studied or documented stage of puppy 51
development. The majority of what is known about neural and behavioral development in 52
the dog focuses on the first 8 to 12 weeks of life (Scott and Fuller, 1965) and little is known 53
about what further changes may occur in regards to neural development after 12 weeks 54
(Overall, 2013). However, evidence from human and rat studies show that the mammalian 55
neural network continues to grow and develop throughout adolescence and that this can 56
have long term effects on adult personality (McCrae et al., 2000; Sisk and Zehr, 2005; Crone, 57
2009; McCormick and Mathews, 2010). 58
While some studies have shown associations between puppy test results, and training 59
outcomes of adult working dogs (Slabbert and Odendaal, 1999; Svobodova et al., 2008; 60
Asher et al., 2013), the majority of previously developed puppy tests have had limited to no 61
M
ANUS
C
R
IP
T
AC
C
EP
TE
D
1997b; Wilsson and Sundgren, 1998a; Wilsson and Sundgren, 1998b; Riemer, et al., 2014). 63
However, these tests were mainly conducted on dogs in the early stages of development, 64
below 12 weeks of age. The lack of success in predicting adult behavior shown by many 65
puppy tests could be explained by continuing neural and behavioral changes within juvenile 66
dogs, which are likely to continue past sexual maturity, stabilizing at only social maturity 67
(Overall, 2013). This is supported by evidence which shows that the predictive ability of 68
behavior tests improve as an animal ages (Goddard and Beilharz, 1986; Wilsson and 69
Sundgren, 1998a; McCrae et al., 2000; Hoffmann, 2002; Bell et al., 2009; Fratkin et al., 70
2013). Therefore, conducting assessments on juvenile or young adult dogs, rather than dogs 71
less than 12 weeks of age, could improve a tests predictive value. 72
Previous research indicates that behavior in juvenile and young adult dogs, aged as young as 73
5 months, can be partly predictive adult behavior (Hoffmann, 2002; Duffy and Serpell, 74
2012). Significant associations were found between suitability to the guiding role and scores 75
on a questionnaire known as the C-BARQ, when completed by volunteer puppy carers 76
(known as puppy walkers or puppy raisers) about behavior of dogs’ aged 6 and 12 months 77
(Duffy and Serpell, 2012). While the results of Duffy and Serpell indicate that prediction of 78
working suitability could be possible from 6 months of age, the questionnaire scores were 79
unable to actually separate individual dogs that went on to qualify or be withdrawn, and so 80
could not be used to categorically predict the training outcome of a given individual. 81
There may be further applications for predicting adult behavior on the basis of canine 82
personality. Stable and consistent differences in behavior have been demonstrated for dogs 83
less than 1 year of age (Fratkin et al., 2013). The mean correlation for personality tests 84
assessed at different ages and across a large number of studies was 0.34, similar to human 85
behavioral consistency measures (Mischel, 2006). Yet the majority of published studies that 86
assess juvenile dog behavior (Goddard and Beilharz, 1986; Wilsson and Sundgren, 1998a; 87
Wilsson and Sundgren, 1998b; Slabbert and Odendaal, 1999; Batt et al., 2008; Sforzini et al., 88
2009; Kim et al., 2010; Duffy and Serpell, 2012; Asher et al., 2013) fail to provide evidence of 89
the test’s reliability, have been conducted on too few dogs for the results to be meaningfully 90
interpreted (Batt et al., 2008; Sforzini et al., 2009; Kim et al., 2010). For any behavior to be 91
‘predictive’ of a future event or outcome, it must be reliable, consistently recorded, and 92
M
ANUS
C
R
IP
T
AC
C
EP
TE
D
Personality traits must be consistent and stable over time (McCrae et al., 2000; Uher, 2011), 94
so tests that have been shown to predict the same behavior at a later date may be 95
measuring aspects of personality. Questionnaire based assessments can be used to assess 96
dog personality (e.g. Duffy and Serpell, 2012), but the most commonly employed method is 97
the test battery (Jones and Gosling, 2005). Test battery approaches using ethograms can be 98
used to assess ‘personality’ (Sinn et al., 2010; Wilsson and Sinn, 2012; Fratkin et al., 2013), 99
and are considered less subjective than questionnaire assessments. Tests are conducted 100
under controlled or semi-controlled conditions and involve exposing dogs to a series of 101
stimuli while recording behavior either at the time, or subsequently from video footage 102
(Highfill et al., 2010; Carter et al., 2012; Wilsson and Sinn, 2012). Scoring protocols 103
associated with practical behavior tests are reductionist in nature, breaking down complex 104
series’ of behavior into small constituent parts that can fail to capture subtle or rare 105
behavior (Asher et al., 2009; Uher, 2011). Test batteries are often employed by staff in 106
rescue shelters who wish to evaluate a dog’s behavior to aid in successful rehoming, and in 107
decisions regarding euthanasia or rehabilitation (Dowling-Guyer et al., 2011; Mornement et 108
al., 2014,) as well as in working dog organisations that use military dogs (e.g. Haverbeke et 109
al., 2009), police dogs (Slabbert and Odendaal, 1999), or run breeding programs (Arvelius et 110
al., 2014). 111
Predictive validity of behaviour tests could also be improved by ensuring that the situations 112
under which the tests are conducted, and the stimuli encountered, closely reflect the 113
situations to which the results are meant to be applied (Taylor and Mills, 2006; King et al., 114
2012; Mornement et al., 2014). Two tests of shelter dog behaviour, which provided 115
sufficient evidence of test reliability, and have successfully predicted future behaviour of 116
dogs following rehoming were both designed to reflect everyday situations, often 117
conducted in the dogs home kennel (Dowling-Guyer et al., 2011; Valsecchi et al., 2011; 118
Marder et al., 2013). It is possible that the novel stimuli encountered under artificial testing 119
situations may make the tests inherently stressful for the subjects, reducing the range of 120
traits that can be studied to those related to stress or anxiety, and weakening the validity of 121
the results (Rayment et al., 2015). 122
The main aim of this study was to design and evaluate a test battery for juvenile dog 123
M
ANUS
C
R
IP
T
AC
C
EP
TE
D
training programme. A subsidiary and related aim was to investigate which aspects of 125
behavior measured in the test were consistent and stable over time and so could be related 126
to personality. To achieve these aims we assessed: 1) test-retest reliability (temporal 127
consistency) between tests at two different ages; and 2) predictive criterion validity by 128
comparing dogs test scores to their outcome within the Guide Dogs’ training program 129
(qualification as a guide dog or withdrawal from the program for behavioral reasons). 130
131
METHODS
132
SUBJECTS 133
The target population was defined as all Guide Dogs’ puppies born in December & January 134
2011 who were tested once at 5 months and again at 8 months of age. Potential guide dogs 135
are cared for by volunteer ‘puppy walkers’ (PWs) during the formative months of their life. 136
Contact details of all volunteer puppy walkers, nationwide, due to receive these puppies 137
were obtained (n=148). A postcode map of participant locations was created using online 138
mapping software Batchgeo (http://batchgeo.com/). Puppy walkers whose locations were 139
more than a two-hour drive from another puppy walker were removed from the study 140
sample. The remaining 119 PWs were invited by letter to participate with their dog. The 93 141
PWs who consented to participate met with the researchers at the venue closest to them 142
(see below). PWs were briefed over the phone, and by letter, on the content of the test 143
battery. 144
145
Ninety-three dog-PW dyads participated in the study (69 tested twice, 13 tested only at 5 146
months, and 11 tested only at 8 months). The mean age of dogs tested in the first test was 147
4.78 months (±0.73 SD); and in the second test was 7.98 months (±0.78 SD). Of the 93 dogs 148
tested, 52 were female and 41 male (first test 48F/34M; second test 44F/36M). The dogs 149
came from 29 litters, with 23 different sires. The dogs tested (sire x dam) were 39 golden x 150
Labrador retrievers; 38 Labrador retrievers; 8 Labrador x golden retrievers; 6 Labrador x 151
golden retriever crossbreeds; and 1 German shepherd x golden retriever. 152
153
M
ANUS
C
R
IP
T
AC
C
EP
TE
D
Tests were conducted in 21 different venues, typically village halls, church halls or 155
community centres with at least two rooms, one of a minimum size of 7m by 5m for testing 156
and another for use as a waiting area. All venues also had an outside space not adjacent to a 157
road. The test battery was named the ‘juvenile guide dog behavior test’. 158
A test arena, measuring 6.5 x 4.5 metres, was marked out at each venue using rows of 159
chairs, and always included an entry/exit route in view of at least one camera (Figure 1). 160
Video recordings of the indoor test arena were made using three camera’s (Camera 1 was a 161
Panasonic HDC-HS60; Camera’s 2 and 3 were wide angle GoPro HD-Hero2) mounted on 162
chairs. A pathway in an outside area, which measured a minimum of 14 metres in length, 163
was established with stimuli consistently placed at a measured distance from the path 164
(Figure 2). Filming of the outside area was permitted by the use of a head mounted camera 165
on Experimenter 1 (wide angle GoPro HD-Hero2) positioned at approximately a 45⁰ 166
downward angle. 167
168
PROCEDURE 169
The test procedure was developed following an extensive review of literature, consultation 170
with Guide Dogs’ training staff, three months of observations of puppy behavior in Guide 171
Dogs’ puppy classes, and pilot work with juvenile pet and potential guide dogs. Subtests 172
were designed to address behavior that could be representative of distractions (from food, 173
animals or people), training and obedience, and body sensitivity. The food distraction 174
subtest was designed to replicate situations where food rubbish is encountered on walks, 175
which is problematic in guide dogs (Murphy, 1998). No stimuli or procedures were 176
considered which had the potential to induce a strong fear response. To maximise the test’s 177
validity, efforts were made to make the protocol as ‘normal’ and stress-free as possible for 178
the dogs by mimicking situations they could encounter on a day-to-day basis. Testing took 179
place during the months of May-June and August-September 2012. 180
181
A total of 11 subsets were used: 1) Meet a stranger; 2) Obedience with PW; 3) Obedience 182
with stranger; 4) Raised path; 5) Body check; 6) Head ring; 7) Tea-towel; 8) Food; 9) Robin; 183
10) Pigeons; and 11) Human distraction (see Table 1). Two subtests, 1 & 5, were adapted 184
M
ANUS
C
R
IP
T
AC
C
EP
TE
D
experimenters were involved and the main handler for the tests, Experimenter 1 was kept 186
out of sight from the dogs until the test began. 187
188
Equipment for subtests 1-7 included two polyethylene foam blocks (L600mm, W400mm, 189
D80mm), placed end-to-end to form a raised path for subtest 4, sourced from Foam 190
Solutions UK (http://www.foamsolutionsuk.co.uk), a rubber 13” Aerobie® Pro Ring for 191
subtest 6, and a quarter folded cotton tea-towel for subtest 7. Drawstring treat bags were 192
worn by experimenters 1 and 2 clipped onto their belts that contained a mixture of two 193
types of dog treats (Misfits®: Ruff Rips™ and Scruffy Bites™). Equipment for subtests 8-11 194
consisted of two small cones used to mark the beginning of subtest 8, two paper plates 195
holding three torn up hot dog sausages (Herta® Frankfurters Classics), two plastic, whole 196
pigeon decoys with legs (head down) (www.countrykeeper.net), and an RSPB ‘singing’ robin 197
tied to a pulling device). The pulling device consisted of an adjusted remote control car with 198
a retractable dog lead joined to its wheel, hidden in a cardboard box by a woollen blanket. 199
The car was activated by remote control and the lead then pulled the robin into a second 200
cardboard box ‘hide’. 201
202
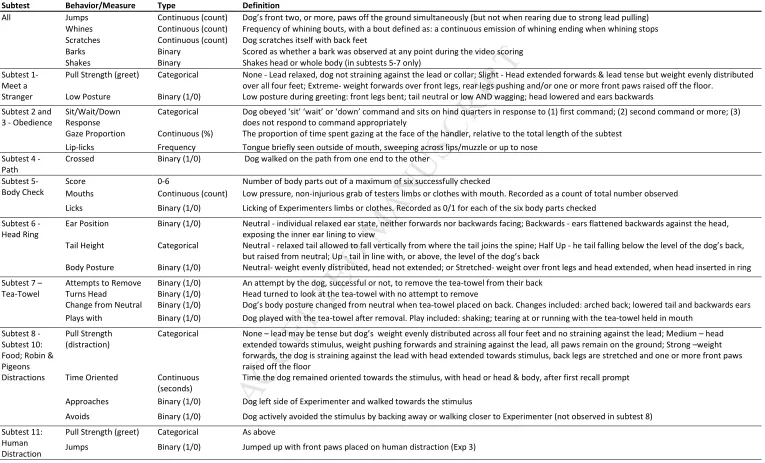
VIDEO ANALYSIS 203
An ethogram of behavioral responses was created prior to behavioral testing (Table 2). A 204
single rater scored all videos over a five-month period. 205
206
STATISTICAL ANALYSIS 207
Tests for correlations, associations between variables and principal components analysis 208
were undertaken using SPSS v. 21 (SPSS Inc., Chicago, IL, USA). Logistic regression analysis 209
was undertaken in R version 3.0.2 (R Core Team, 2013); R scripts available on request. 210
Unless otherwise stated, significance was set at P<0.05. 211
INTRA-RATER RELIABILITY 212
Intra-rater reliability was assessed for all ethogram measures. For measures that were 213
repeated, due to subtest replicates, they were combined so that just the measure was 214
M
ANUS
C
R
IP
T
AC
C
EP
TE
D
height’ and ‘2nd Tail height’ but for this analyses the replicates were combined to give just 216
‘Tail height’. Cohen’s Kappa (K) was utilized to assess binary data (Gwet, 2014), and 217
intraclass correlation coefficients (ICC’s) were calculated for continuous data using a two-218
way mixed model with consistency (Nichols, 1998). Mean weighted kappa coefficients are 219
most commonly used to assess agreement for ordinal data where there is an underlying 220
continuum (Roberts and McNamee, 2005). Average measures ICC’s with absolute 221
agreement are directly equivalent to the mean weighted kappa (Fleiss and Cohen, 1973), so 222
average ICC’s were applied to ordinal data. Cohen’s Kappa (K) is most often interpreted as 223
follows: less than 0.20 is poor, unacceptable correlation, 0.21-0.4 is a fair and acceptable 224
correlation, 0.41-0.60 is moderate correlation, 0.61-0.80 is a good correlation, and 0.81-1.00 225
a very good correlation (Altman, 1991). Guidelines for interpretation of both mean weighted 226
kappa and ICC coefficients suggest that below 0.40 is poor or unacceptable, between 0.40-227
0.59 is fair, between 0.60-0.74 is good, and above 0.75 is excellent (Cicchetti, 1994; 228
Bryington at al., 2004). ICC coefficients of above 0.60 were considered acceptable for this 229
analysis. 230
Using methods outlined by Walter et al. (1998), a sample size estimation based upon 231
α=0.05, β=0.20, with a minimum acceptable coefficient of 0.60 and a maximum expected 232
coefficient of 0.80, provided an acceptable sample size of 39.1. Further sample size 233
guidelines for intra-rater reliability of tests using ICC statistics suggest that 40 samples with 234
2 replicates are sufficient to obtain precise coefficients (where precision is shown by 95% 235
confidence interval widths of less than 0.40) when the coefficient is above 0.50 (Gwet, 236
2014). Based upon these two guidelines, videos of 40 tests were analysed twice by the same 237
rater, approximately two years apart. 238
TEST-RETEST RELIABILITY 239
To investigate test-retest reliability all individual measures were tested for correlations 240
between the 5M and 8M tests. Of the 93 dogs in this study, 69 participated in both tests and 241
form the basis of this analysis. To assess test-retest reliability (for which rank-order 242
consistency is assessed) Kendall’s tau-b was used for binary variables, and Spearman’s rank 243
M
ANUS
C
R
IP
T
AC
C
EP
TE
D
with existing literature) correction for multiple testing using the Improved Bonferroni 245
Procedure (Simes, 1986). 246
PREDICTIVE VALIDITY 247
Of the 93 dogs tested, 61 qualified as guide dogs (Q), 22 were withdrawn for behavior 248
reasons (W-B), 4 were withdrawn for health reasons and 6 were selected for breeding. For 249
the purposes of this analysis only test scores of those dogs that were qualified or withdrawn 250
for behavior reasons were be used. This gave a sample size of 73 dogs (52Q and 21W-B) 251
with 5M test scores and 72 dogs (56Q and 16W-B) with 8M test scores. 252
Separate binary logistic regression analyses were conducted for the 5M and 8M tests. The 253
basic model equation using a logit link function can be written as: 254
yi ~ Binomial(ni,πi)
255
logit(πi) = log !
"#
$%"#& = β0 + βnXi
256
Where yi represents the response variable (withdrawal for behavior vs. qualification as a
257
guide dog) for the ith dog; πi represents the probability that yi = 1; β0 is the model intercept
258
(the estimated response value when the predictor equals zero), and the regression 259
coefficient for the explanatory variables are represented by βnXi (where ‘n’ indicates the
260
variable ID). 261
A four-step process was utilized for multivariate analyses: (1) univariate logistic regressions 262
were run for each variable from the test against training outcome, criteria for retention of 263
variables was set to p<0.1; (2) to avoid multi-collinearity, correlations between retained 264
variables (Spearman’s for continuous measures, Kendall’s tau-b for ordinal measures, 265
McNemar’s tests for binary measures, and Mann Whitney U tests to compare binary against 266
ordinal or continuous measures) were conducted and where correlations were significant 267
(p<0.1) principal component analysis (PCA) was utilized to reduce the variables by creating 268
component scores (PCAs based on Eigen values >1, with varimax rotation), following 269
guidelines set out by Budaev (2010) for studies with fewer than 100 subjects loading values 270
of >0.50 were considered significant; (3) PCA scores and remaining uncorrelated variables 271
were entered into a composite logistic regression model using a backwards elimination 272
M
ANUS
C
R
IP
T
AC
C
EP
TE
D
selection of the best fitting model. Figures were made by plotting the probability of being 274
withdrawn, and outcome (withdrawn or qualified), against the probability of being 275
withdrawn and a composite score (calculated from the model), which will henceforth be 276
referred to as the “composite model score”. 277
278
RESULTS
279
INTRA-RATER RELIABILITY 280
The variables ‘approaches’ and ‘avoids’ from subtests 8 to 10 showed too little variation in 281
this random subsample of tests. Only ‘approaches’ for subtest 10 (Pigeons) could be 282
assessed for intra-rater reliability. Following the combination of measures that were 283
repeated within replicates of subtests 5 to 7, this created 33 variables for which intra-rater 284
reliability was testable. 285
For the 16 testable binary variables, one could be classified as showing ‘fair’ agreement with 286
a K of 0.35, according to Altman (1991) and one could be considered to have ‘moderate’ 287
agreement, with eight showing ‘good’ agreement and 6 showing ‘very good’ agreement 288
(Table 3). 289
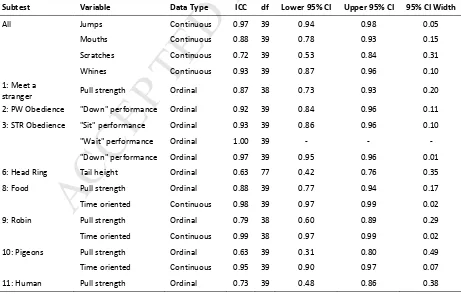
For the 17 continuous or ordinal variables evaluated here, all showed ICC values above 0.60, 290
with three being classified as ‘good’ and 14 classified as ‘excellent’ according to the 291
guidelines set out by Cicchetti (1994) (Table 4). 292
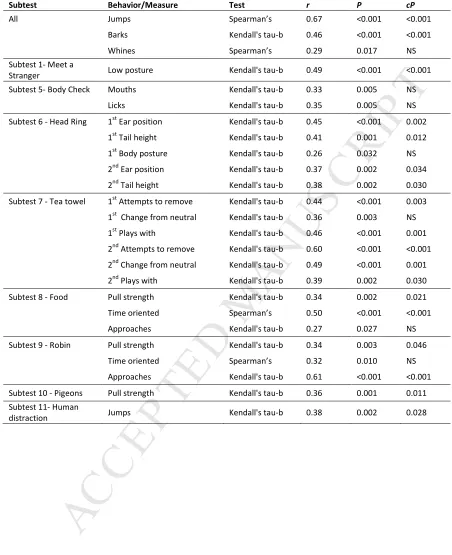
TEST-RETEST RELIABILITY 293
Most behavioral measures considered showed some temporal, test-retest consistency 294
between 5 and 8 months (Table 5). Twenty-five measures were significant before correction 295
for multiple testing, with 18 remaining significant after correction. Measures that did not 296
show temporal consistency include: shakes, scratches (across subtests), pull strength (in 297
subtest 1), the response to sit, wait and down commands, proportion of time spent gazing 298
at the puppy walker, and lip-licks (in subtest 2 & 3), crossing a raised pathway (subtest 4), 299
compliance score in a body check test (subtest 5), body posture in the 2nd trial of the head-300
M
ANUS
C
R
IP
T
AC
C
EP
TE
D
orientated towards, approaching or avoiding a pair of fake pigeons (subtest 10), and pull 302
strength towards an unknown person (subtest 11). 303
304
PREDICTIVE VALIDITY 305
FIVE MONTHS 306
Ten variables at 5M showed associations with qualification or withdrawal to the p<0.1 level 307
(Table 6). Six were found to be significantly associated with each other and were included in 308
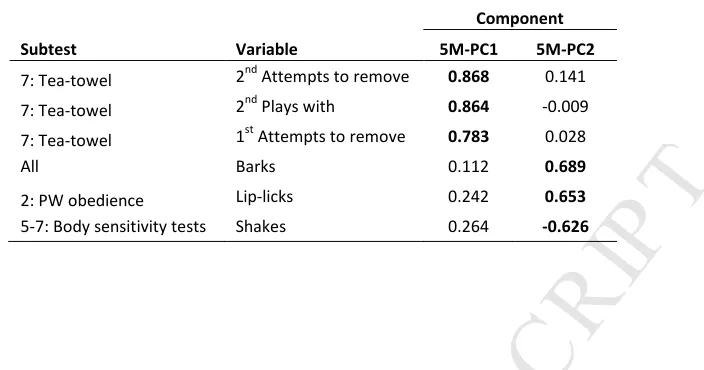
a PCA, which yielded two components (Table 7). The 5M PCA achieved a KMO statistic of 309
0.59 and Bartlett’s test of sphericity of p<0.05. Three variables loaded strongly in the first 310
5M component (5M-PC1), all of which came from subtest 6 (tea-towel). High 5M-PC1 scores 311
were achieved by dogs that attempted to remove the tea towel on both repetitions and 312
played with it on the second repetition. The remaining three variables loaded on 5M-PC2, 313
and high scores for this component were indicated by barking at any point during the test, 314
lip-licking in subtest 2 (PW obedience) and not-shaking for subtests 5-7 (body sensitivity 315
tests). A significant composite logistic regression model could be formed for the 5M test 316
combining each component score (5M-PC1 and 5M-PC2) with three independent variables: 317
time oriented towards the food in subtest 8, and ‘Down’ performance in subtest 2 and 318
subtest 3 (Z=3.81, p<0.001, R2=48.4%, Figure 3). For each 1 unit increase in the composite 319
score the odds of being withdrawn for behavioral reasons increased by x1.7 (95% CI 1.63 to 320
4.55). 321
EIGHT MONTHS 322
Ten variables at 8M were associated with qualification or withdrawal to the p<0.1 level 323
(Table 6). Nine of these variables were significantly associated with each other and so were 324
included in a PCA, which yielded three components (Table 8). The 8M PCA achieved a KMO 325
statistic of 0.65 and Bartlett’s test of sphericity of p<0.05. The first component, 8M-PC1, 326
contained mostly variables from subtests 8-10 (distraction circuit), dogs with high scores on 327
8M-PC1 pulled more strongly towards the food, Robin and Pigeons, and played with the tea-328
towel the first time in subtest 7. Component two, 8M-PC2, contained two variables; dogs 329
with high scores on this component avoided the Pigeons and showed a change from neutral 330
M
ANUS
C
R
IP
T
AC
C
EP
TE
D
two variables loading above 0.50 (turning to look at the tea-towel in subtest 7 and 332
approaching the robin in subtest 9), and one variable with a loading on 0.47 (time oriented 333
toward the food). 334
A significant composite logistic regression model could be formed for the 8M test combining 335
each component score (8M-PC1, 8M-PC2, 8M-PC3) with the one independent variable: ‘low’ 336
greeting posture in subtest 1 (Z=3.64, p<0.001, R2= 52.3%, Figure 3). For each 1-unit increase 337
in the composite score the odds of a dog being withdrawn increased by x1.7 (95%CI 1.59 to 338
4.66). 339
DISCUSSION
340
341
The aim of this study was to design a battery of practical tests for assessing juvenile dog 342
behavior using a behavioral coding ethogram, which would record and identify behavior 343
associated with the dog’s personality and had potential to predict suitability for the guiding 344
role. The study found evidence for both reliability and validity of this test (Taylor and Mills, 345
2006, Martin and Bateson, 2007). To identify behavior that may be indicative of personality, 346
reliable measurement items were assessed for test-retest reliability (temporal consistency). 347
Temporal consistency was good with a mean correlation of 0.41 for 25 measures, and 0.45 348
for the 18 measures that remained significant after correction for multiple testing. These 349
results compare favourably to published literature, which together showed a mean 350
correlation of 0.34 (Fratkin et al., 2013). To assess validity, we considered the association 351
between measurements and outcome in Guide Dogs’ training programme, finding seven 352
measures at five months and five measures at eight months that were significantly 353
associated with qualification or withdrawal individually. Additionally, a logistic regression 354
model could be produced for each age tested that demonstrated potential for identifying 355
dogs likely to qualify or be withdrawn from the training program. 356
357
INTRA-RATER RELIABLITY 358
Intra-rater reliability of the ethogram revealed the majority of measures achieved good to 359
M
ANUS
C
R
IP
T
AC
C
EP
TE
D
Cicchetti, 1994). As predicted in sample size estimation the 95% confidence interval width 361
for all ICC statistics was less than 0.40, which lends credibility and confidence to these 362
results. It is essential to establish reliability of scoring methods, especially where decisions 363
are made based upon their results. While intra-rater reliability has been demonstrated 364
within this study, it will need to be re-assessed in any future application of the behavior test 365
when new raters are trained (Martin and Bateson, 2007). Inter-rater reliability was not 366
assessed in this study because all tests were scored by a single rater. If multiple rates are 367
used, as is commonly the case, inter-rater reliability will also need to be demonstrated. 368
369
TEST-RETEST RELIABILITY (TEMPORAL CONSISTENCY) 370
The results from the test-retest analysis show that many behavioral measures from the 371
ethogram achieved good (>0.3) to high (>0.6) correlations between the time points, 372
suggesting the presence of inter-individual consistency. These results compare favourably to 373
those found in a meta-analysis of behavioral consistency in dogs where similar studies on 374
puppies (dogs <1 year old) had a mean correlation between tests of 0.34 (Fratkin et al., 375
2013). 376
Measurement items that showed poor temporal consistency in rank order of individuals 377
were obedience task response, gaze behavior and summed counts of lip-licking, shaking and 378
scratching. Intra-observer reliability for these measures was acceptable to good, which 379
suggests the lack of correlations between tests is due to instability of the behavior, not 380
recording error. These results suggest that these behavior are most subject to change, and 381
cannot be considered behavior that directly reflect personality traits due to their lack of 382
inter-individual consistency (Freeman et al., 2011). 383
Behavior that showed medium to high consistency correlations (rho of >0.4) across the 384
three month time period included jumping, barking, whining, ‘Low’ posture upon greeting, 385
mouthing, human licking, and ear and tail position. The measures from the distraction 386
subtests (8-11) also showed good to high consistency, confirming that they detect 387
consistent individual differences in behavior. These measurement items could be used as 388
M
ANUS
C
R
IP
T
AC
C
EP
TE
D
assess distraction related tendencies, but to be sure that they measure a distraction trait 390
(e.g., Arata et al., 2010) would require comparison with independent measures. 391
The high level of inter-individual consistency for the distraction measures, compared to the 392
other measures, contradicts one study that showed low repeatability for distraction 393
measures in dogs tested at 6 and 12 months of age in an Australian guide dog population 394
(Goddard and Beilharz, 1984). Differences between these studies may stem from 395
differences in the test and recording methods. Our study used semi-controlled situations 396
and objective behavioral coding methods to score the dogs, and the re-test interval was half 397
that of Goddard and Beilharz and behavior is more consistent across shorter time intervals 398
(Bell et al., 2009, Fratkin et al., 2013). Goddard and Beilharz (1984) observed the dogs in 399
uncontrolled conditions and used a more subjective scoring system. Assessments of 400
distraction behavior should be conducted under standardised, controlled or semi-controlled 401
conditions. 402
Our results compare favourably with those from other test-retest studies of behavior in 403
dogs. Sinn et al. (2010) found medium to high, significant correlations (0.4-0.6) for behavior 404
scores between tests with short intervals (1-30 days) for US Military Working Dogs. 405
Correlations decreased to <0.3 with longer intervals (30 - 157 days). In our study the interval 406
between tests was approximately 91 days (13 weeks), and medium to high correlations 407
were achieved with a mean significant correlation of 0.41. 408
There was a lack of correlation between the 5M and 8M tests of obedience, which suggests 409
that obedience, itself, may not be an aspect of personality in dogs. In a meta-analysis of 410
consistency of personality ‘traits’ in dogs, ‘Responsiveness to Training’ was found to have 411
the lowest overall consistency of the ‘traits’ assessed (Fratkin et al., 2013). Such 412
assessments of trainability are often based on questions about obedience, so it is probable 413
terms are being used synonymously in the scientific literature. Obedience has a strong 414
reliance upon factors external to the dog including amount, type, and quality of training, 415
which are not often assessed in such tests and may mask dog effects. 416
417
M
ANUS
C
R
IP
T
AC
C
EP
TE
D
Some test measures discriminated between dogs that eventually qualified or were 419
withdrawn for behavior, at both 5 and 8 months of age. Only one measurement item was 420
significantly associated with the dogs’ training outcome from both tests: time oriented 421
towards the food in subtest 8. Dogs who spent longer oriented towards the food had 422
increased chances of withdrawal from the training program. 423
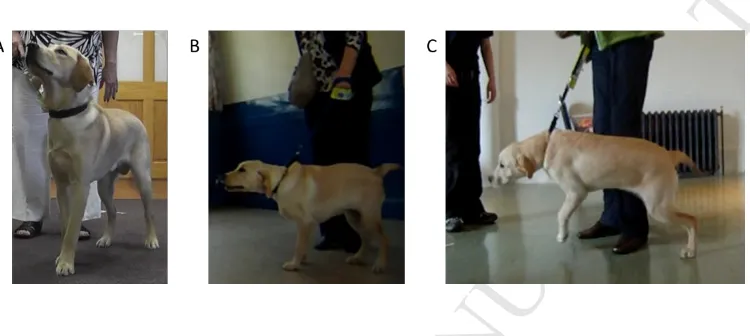
Expression of a ‘low’ posture, as defined in Table 2, during greeting in subtest 1 was found 424
to be positively associated with success in guide dog training. Low postures have been 425
associated with the experience of both chronic and acute stress (Beerda et al., 1998; 426
Haverbeke et al., 2009). Our definition of ‘low’ posture included that the dog wagged its 427
tail. While in this position the dogs often licked the hands of the experimenter, a behavior 428
associated with human-greeting in dogs (Westgarth et al., 2008). This version of a ‘low’ 429
posture occurs only during greeting and is accompanied by tail wagging (and potentially 430
hand licking), and could be considered to be an appeasement posture that may reflect a 431
particularly ‘sociable’ dog. It is possible that dogs viewed as more ‘sociable’ could be more 432
likely to qualify as a working guide dog. 433
434
Body shaking behavior was also associated with qualification from guide dog training and is 435
also thought to be associated with the experience of anxiety or internal conflict in a dog 436
(Beerda et al., 1997). However, in our study, shaking following the ‘body sensitivity’ subtests 437
substantially decreased the odds of a dog being withdrawn. One possible explanation for 438
this unexpected association could be that shaking is a coping behavior, expressed to help 439
alleviate anxiety. Shaking behavior was not temporally consistent, and only shaking at 5 440
months was associated with a dog’s training outcome. The presence of lip-licking during the 441
puppy walker obedience subtest at 5 months was also associated with increased chances of 442
withdrawal, and also did not show temporal consistency. In our study shaking and lip-licking 443
were shown not to predict future shaking or lip-licking, but they did appear to represent an 444
aspect of the dog’s state at the time of testing, which was predictive of the independent 445
event of qualification as a guide dog more than a year later. 446
447
Using composite regression models, the factors of most importance in predicting outcome 448
M
ANUS
C
R
IP
T
AC
C
EP
TE
D
the first time to the ‘down’ command from their puppy walker, responded the second or 450
third time to the novel person for the same command, and scored low on the two five 451
month component scores. The first five-month component score included attempted 452
removal of the tea-towel from their back in subtest 7 (on each replicate) and playing with 453
the tea-towel in the second replicate. This component represents a subtest specific score 454
regarding the dogs’ reaction to a garment-like fabric being placed on their back. The second 455
five month component score included barking in any subtest, lip-licking during obedience 456
with their puppy walker, and an absence of body shaking after subtests 5-7 (body sensitivity 457
tests). Barking, lip-licking and shaking may be associated with internal conflict or anxiety 458
(Beerda et al., 1997). These components could contain some aspect of responses to anxiety 459
provoking situations. If so, they may reflect behaviors defined under the 460
‘Fearfulness/nervousness’ dimension (McGarrity et al., 2015). 461
462
At eight months, the dogs that were statistically predicted as most likely to qualify as guide 463
dogs were those which did not display a ‘low’ greeting posture, had low scores on the first 464
component (distraction) and/or second component (fear/anxiety) identified from a PCA, 465
and/or high scores on the third component (low reactivity). The first eight-month 466
component included pulling more strongly towards the food, robin, and Pigeons from 467
subtests 8-10 and playing with the tea-towel from the first replicate of subtest 7. This 468
component appears to represent distraction-related behavior, one of the most common 469
reasons for withdrawal within Guide Dogs in the UK, and other guiding schools (Arata et al., 470
2010). The second 8-month component included avoidance of the Pigeons from subtest 10, 471
and change from neutral posture in response to the first tea-towel replicate in subtest 7. 472
These behaviors may be indicative of a fearful or anxious response. Interpretation of these 473
behaviors would be aided by concomitant assessment of physiological variables, such as 474
heart rate or circulating glucocorticoid levels (Rayment et al., 2015). It may appear 475
contradictory that dogs least likely to qualify as a guide dog are those that pulled harder 476
towards the Robin and those that also avoided the robin. While dogs would be unlikely to 477
show both behavioral responses simultaneously, strong avoidance or approach behavior 478
with respect to novel items is undesirable for a working guide dog. The third 8-month 479
component was based upon turning to look at the tea-towel on their back in subtest 7, and 480
M
ANUS
C
R
IP
T
AC
C
EP
TE
D
qualification. Although the principal components discussed here may place dogs within 482
proposed personality dimensions (such as 5M-PC2 within ‘fearfulness/nervousness’), it is 483
important to note the methodological limitations of this study. The main aim was to identify 484
behavior that may be predictive of guide dog suitability, as such the principal components 485
were formed only from behavior that showed predictive associations and cannot be 486
considered to be exclusive measures of dog personality traits. Additionally, behavior 487
included in the predictive models was not required to be temporally consistent in order to 488
predict guide dog suitability. For a behavioral measure to be considered a measure of 489
personality it must be temporally consistent. Therefore any placement of these principal 490
components within a personality framework must be done with caution. 491
492
The composite regression models highlighted the test’s ability to identify dogs with high and 493
low probabilities of withdrawal for behavior. Models based on probability of withdrawal 494
could be utilized as a tool to aid decision-making regarding a dog’s training, or subsequent 495
inclusion in the training program. The model was able to classify a dog’s outcome 496
(qualification or withdrawal) correctly for 79.7% of dogs for the 5M model and 87.3% for the 497
8M model. These values compare favourably with previous literature where 78% of adult 498
dogs (15-18 months-old) in the Swedish Armed Forces programme were correctly classified 499
by a behavioral coding method (Wilsson and Sinn, 2012). Our results were based on a 500
default threshold of 50% probability of success as a guide dog to classify dogs as either likely 501
to qualify or likely to be withdrawn. Based upon the requirements of organisations such as 502
Guide Dogs, a highly conservative threshold for automatic withdrawal of a dog could be set 503
at 90% probability. Dogs with a probability of withdrawal of between 60-90% could be given 504
a ‘flag’ that would allow their progress to be monitored more closely and for the application 505
of potential rescue strategies. Dogs with a probability of withdrawal of less than 10% could 506
be fast-tracked through the system, or individuals with desired physiological phenotypes 507
within this group could be selected for breeding. Using a 60% probability as a threshold for 508
alerting dogs likely to be withdrawn would yield positive predictive values (correctly 509
identified withdrawn dogs) of 55% and 50%, for the 5 and 8-month tests, with 92% and 80% 510
of dogs scoring above the cut-off being withdrawn. Positive predictive values (PPVs) are 511
rarely reported from behavioral assessments of working dogs, but Asher et al. (2013) noted 512
M
ANUS
C
R
IP
T
AC
C
EP
TE
D
One test of 6 month old trainee police dogs had a 33% PPV (Slabbert and Odendaal, 1999). 514
Positive predictive values of 50% and 55% from the test described here are high, and could 515
be of significant value to Guide Dogs. 516
517
CONCLUSIONS 518
The test presented here represents a new behavior test for juvenile dogs from which 519
reliable and consistent measurement items have been identified. Some of these 520
measurements have shown considerable predictive criterion validity for guide dog 521
suitability. This juvenile guide dog behavior test has the potential to be used as a decision 522
making tool for Guide Dogs, by identifying dogs who will not be successful while they are 523
still puppies. Identification of dogs most likely to qualify could assist with selection of dogs 524
for inclusion in the breeding program. As with many test batteries, the application and 525
subsequent scoring associated with this test in its current form is labour intensive compared 526
to that of a rating style assessment. Not all elements of the test included measures shown 527
to be of predictive value, such as subtest 4 (Path). The test order was not randomised, so as 528
with most tests there is the potential for order effects on the dogs’ behavior. The overall 529
test length was below 20 minutes, within the minimal length suggested by Taylor and Mills 530
(2006). If the only purpose of the test were to predict guide dog training outcome, only 531
behavior that showed significant associations with guide dog qualification or withdrawal 532
would need to be recorded and measured from video footage. Combined with additional 533
assessment methods, this test could be applied to those dogs whose behavior is already 534
under question, to gain further estimates of their chances of success in training. The juvenile 535
guide dog behavior test and its associated ethogram could also be utilized for future 536
scientific studies of juvenile dog personality and behavior, which has broad applicability and 537
M
ANUS
C
R
IP
T
AC
C
EP
TE
D
ACKNOWLEDGEMENTS539
We would like to thank Dr. Kathleen Gallagher for her help filling in for ‘Exp2’ in some of the 540
tests, in addition to all of the Guide Dogs volunteer puppy walkers, and their dogs, who 541
participated in this study. We would also like to thank the two anonymous reviewers for 542
their valuable feedback on previous versions of this manuscript. 543
544
CONFLICT OF INTEREST STATEMENT 545
The research reported in this publication was funded by Guide Dogs and The University of 546
Nottingham as part of a larger five-year research initiative. Authors of this publication 547
frequently consult with Guide Dogs regarding the behavior of their dogs. Guide Dogs have 548
approved the paper for publication. The terms of this arrangement have been reviewed and 549
approved by the University of Nottingham in accordance with its policies on research. 550
551
AUTHORSHIP STATEMENT 552
NH conceived and designed the study and data collection tools, collected data, performed 553
data analysis and drafted and revised the paper. PC assisted with design of the study, 554
collected data and commented on drafts and revisions of the paper. RS & CM assisted in 555
design of the study, data collection and commented on drafts and revisions of the paper. 556
MG supported statistical analysis and commented on drafts and revisions of the paper. GE 557
initiated the project, monitored the study and commented on drafts and revisions of the 558
paper. LA oversaw the study, conceived and designed the study, monitored data collection, 559
M
ANUS
C
R
IP
T
AC
C
EP
TE
D
REFERENCES 561 562Altman, D.G., 1991. Practical statistics for medical research. Chapman and Hall, London 563
Arata, S., Momozawa, Y., Takeuchi, Y., Mori, Y. 2010. Important behavioral traits 564
for predicting guide dog qualification. J. Vet. Med. Sci. 72, 539–545. 565
Arvelius, P., Strandberg, E., Fiske, W.F. 2014. The Swedish Armed Forces temperament test 566
gives information on genetic differences among dogs. J. Vet. Behav.: Clin. Appl. Res. 567
9, 281-289. 568
Asher, L., Blythe, S., Roberts, R., Toothill, L., Craigon, P.J., Evans, K.M., Green, M.J., England, 569
G.C.W., 2013. A standardized behavior test for potential guide dog puppies: Methods 570
and association with subsequent success in guide dog training. J. Vet. Behav.: Clin. 571
Appl. Res. 8, 431-438. 572
Asher, L., Collins, L.M., Ortis-Pelaez, A., Drewe, J.A., Nicol, C.J., Pfeiffer, D.U., 2009. Recent 573
advances in the analysis of behavioral organization and interpretation as indicators 574
of animal welfare. J. R. Soc. Interface 6, 1103-1119. 575
Batt, L.S., Batt, M.S., Baguley, J.A., McGreevy, P.D., 2008. Factors associated with success in 576
guide dog training. J. Vet. Behav.: Clin. Appl. Res. 3, 143-151. 577
Beaudet, R., Chalifoux, A., Dallaire, A., 1994. Predictive value of activity level and behavioral-578
evaluation on future dominance in puppies. Appl. Anim. Behav. Sci. 40, 273-284. 579
Beerda, B., Schilder, M.B., van Hooff, J.A., de Vries, H., Mol, J.A., 1998. behavioral, saliva 580
cortisol and heart rate responses to different types of stimuli in dogs. Appl. Anim. 581
Behav. Sci. 58, 365-381. 582
Beerda, B., Schilder, M.B., Van Hooff, J.A., de Vries, H.W., 1997. Manifestations of chronic 583
and acute stress in dogs. Appl. Anim. Behav. Sci. 52, 307-319. 584
Bell, A.M., Hankison, S.J., Laskowski, K.L., 2009. The repeatability of behavior: a meta-585
analysis. Anim. Behav. 77, 771-783. 586
Bryington, A.A., Palmer, D.J., Watkins, M.W., 2002. The estimation of interobserver 587
agreement in behavioral assessment. Behav. Analyst. 3, 323-328. 588
Budaev, S.V. 2010. Using principal components and factor analysis in animal behavior 589
research: Caveats and guidelines. Ethology 116, 472-480. 590
Carter, A.J., Marshall, H.H., Heinsohn, R., Cowlishaw, G., 2012. Evaluating animal 591
personalities: do observer assessments and experimental tests measure the same 592
thing? Behav. Ecol. Sociobiol. 66, 153-160. 593
Cicchetti, D.V., 1994. Guidelines, criteria, and rules of thumb for evaluating normed and 594
standardized assessment instruments in psychology. Psychol. Assessment. 6, 284-595
290. 596
Crone, E. A. 2009. Executive functions in adolescence: inferences from brain and behavior. 597
Developmental Sci., 12, 825-30. 598
Dowling-Guyer, S., Marder, A., D’Arpino, S. 2011. Behavioral traits detected in shelter dogs 599
by a behavior evaluation. Appl. Anim. Behav. Sci. 130, 107-114. 600
Diederich, C. and Giffroy, J. M. 2006. Behavioural testing in dogs: A review of methodology 601
in search for standardisation. App. Anim. Behav. Sci. 97, 51-72. 602
Duffy, D.L., Serpell, J.A., 2012. Predictive validity of a method for evaluating temperament in 603
young guide and service dogs. Appl. Anim. Behav. Sci.138, 99-109. 604
Fratkin, J.L., Sinn, D.L., Patall, E.A., Gosling, S.D., 2013. Personality Consistency in Dogs: A 605
M
ANUS
C
R
IP
T
AC
C
EP
TE
D
Freeman, H., Gosling, S.D., Schapiro, S., 2011. Comparison of Methods for Assessing 607
Personality in Nonhuman Primates. Personality and Temperament in Nonhuman 608
Primates. A. Weiss, J. E. King and L. Murray. New York, Springer, pp. 17-40. 609
Goddard, M.E., Beilharz, R.G., 1984. The Relationship of Fearfulness to, and the Effects of, 610
Sex, Age and Experience on Exploration and Activity in Dogs. Appl. Anim. Behav. Sci. 611
12, 267-278. 612
Goddard, M.E., Beilharz, R.G., 1986. Early prediction of adult behavior in potential guide 613
dogs. Appl. Anim. Behav. Sci. 15, 247-260. 614
Goleman, M., 2010. Use of puppy tests in the evaluation of future dog behavior and 615
character. Med. Weter. 66, 418-420. 616
Gwet, K.L., 2014. Handbook of inter-rater reliability, 4th ed: the definitive guide to measuring 617
the extent of agreement among raters. Advanced Analyitics, LLC, Gaithersburg, MD. 618
Haverbeke, A., De Smet, A., Depiereux, E., Giffroy, J.-M., Diederich, C., 2009. Assessing 619
undesired aggression in military working dogs. Appl. Anim. Behav. Sci. 117, 55-62. 620
Highfill, J., Hanbury, D., Kristiansen, R., Kuczaj, S., Watson, S., 2010. Rating vs. Coding in 621
Animal Personality Research. Zoo Biol. 29, 509-516. 622
Hoffmann, G. 2002. Puppy tests: An evaluation of their predictive validity. PhD, The 623
University of Queensland. 624
Jones, A.C., Gosling, S.D., 2005. Temperament and personality in dogs (Canis familiaris): A 625
review and evaluation of past research. Appl. Anim. Behav. Sci. 95, 1-53. 626
Kim, Y.K., Lee, S.S., Oh, S.I., Kim, J.S., Suh, E.H., Houpt, K.A., Lee, H.C., Lee, H.J., Yeon, S.C., 627
2010. behavioral reactivity of the Korean native Jindo dog varies with coat colour. 628
Behav. Process. 84, 568-572. 629
King, T., Marston, L.C., Bennett, P.C. 2012. Breeding dogs for beauty and behavior: Why 630
scientists need to do more to develop valid and reliable behavior assessments for 631
dogs kept as companions. pl. Anim. Behav. Sci. 137, 1-12. 632
Marder, A.R., Shabelansky, A., Patronek, G.J., Dowling-Guyer, S., D’Arpino, S. 2013. Food-633
related aggression in shelter dogs: A comparison of behavior identified by a behavior 634
evaluation in the shelter and owner reports after adoption. Appl. Anim. Behav. Sci. 635
148, 150-156. 636
Martin, P., Bateson, P., 2007. Measuring behavior: an introductory guide, 3rd edition. 637
Cambridge, UK, Cambridge University Press. 638
McCormick, C.M. and Mathews, I.Z. 2010. Adolescent development, hypothalamic-pituitary-639
adrenal function, and programming of adult learning and memory. Prog. Neuro-640
Psychoph. 34, 756-765. 641
McCrae, R.R., Costa, P.T., Jr., Ostendorf, F., Angleitner, A., Hrebickova, M., Avia, M.D., Sanz, 642
J., Sanchez-Bernardos, M.L., Kusdil, M.E., Woodfield, R., Saunders, P.R., Smith, P.B., 643
2000. Nature over nurture: temperament, personality, and life span development. J. 644
Pers. Soc. Psychol. 78, 173-186. 645
McGarrity, M.E., Sinn, D.L., Gosling, S.D. 2015. Which personality dimensions do puppy tests 646
measure? A systematic procedure for categorizing behavioral assays. Behav. Process. 647
110, 117-124. 648
Miklosi, A. 2011. Dog behavior, evolution, and cognition. New York, Oxford University Press. 649
Mischel, W. 2006. Consistency and Specificity in behavior, in: Funder, D.C., Ozer, D.J. (Eds.), 650
Pieces of the personality puzzle (4th Edition), W.W. Norton & Co., New York, pp. 60-651
M
ANUS
C
R
IP
T
AC
C
EP
TE
D
Mornement, K.M., Coleman, G.J., Toukhsati, S., Bennett, P.C. 2014. Development of the 653
behavioral assessment for rehoming K9’s (B.A.R.K.) protocol. Appl. Anim. Behav. Sci. 654
151, 75-83. 655
Murphy, J. A., 1998. Describing categories of temperament in potential guide dogs for the 656
blind. Appl. Anim. Behav. Sci. 58, 163-178. 657
Nichols, D.P. 1998. Choosing an intraclass correlation coefficient. Principal Support 658
Statistician and Manager of Statistical Support SPSS Inc. 659
http://www.ats.ucla.edu/stat/Spss/library/whichicc.htm 660
Overall, K. 2013. Manual of clinical behavioral medicine for dogs and cats. St Louis, Mosby 661
Elsevier Inc., pp. 129-130. 662
Perez-Guisado, J., Munoz-Serrano, A., Lopez-Rodriguez, R., 2008. Evaluation of the Campbell 663
test and the influence of age, sex, breed, and coat color on puppy behavioral 664
responses. Can. J. Vet. Res. 72, 269-277. 665
Pfaffenberger, C.J., Scott, J.P., Fuller, J.L., Binsburg, B.E., Bielfelt, S.W., 1976. Guide dogs for 666
the blind: their selection, development and training. Amsterdam, Elsevier. 667
Scott, J. P. and Fuller, J. L. 1965. Genetics and the Social Behavior of the Dog, Chicago, 668
University of Chicago Press. 669
Sforzini, E., Michelazzi, M., Spada, E., Ricci, C., Carenzi, C., Milani, S., Luzi, F., Verga, M., 670
2009. Evaluation of young and adult dogs' reactivity. J. Vet. Behav.: Clin. Appl. Res. 4, 671
3-10. 672
Simes, R. J., 1986. An improved Bonferroni procedure for multiple tests of significance. 673
Biometrika 73, 751-754. 674
Sinn, D.L., Gosling, S.D., Hilliard, S., 2010. Personality and performance in military working 675
dogs: Reliability and predictive validity of behavioral tests. Appl. Anim. Behav. Sci. 676
127, 51-65. 677
Sisk, C.L. and Zehr, J.L. 2005. Pubertal hormones organize the adolescent brain and 678
behavior. Front. Neuroendocrinol. 26, 163-74. 679
Slabbert, J. M., Odendaal, J. S. J., 1999. Early prediction of adult police dog efficiency - a 680
longitudinal study. Appl. Anim. Behav. Sci. 64, 269-288. 681
Stamps, J. 2003. behavioral processes affecting development: Tinbergen's fourth question 682
comes of age. Anim. Behav. 66, 1-13. 683
Stamps, J. & Groothius, G. G. T. 2010. The development of animal personality: relevance, 684
concepts and perspectives. Biol. Rev. 85, 301-325. 685
Svartberg, K., 2005. A comparison of behavior in test and in everyday life: evidence of three 686
consistent boldness-related personality traits in dogs. Appl. Anim. Behav. Sci. 91, 687
103-128. 688
Svobodova, I., Vapenik, P., Pinc, L., Bartos, L., 2008. Testing German shepherd puppies to 689
assess their chances of certification. Appl. Anim. Behav. Sci. 113, 139-149. 690
Taylor, K.D., Mills, D.S., 2006. The development and assessment of temperament tests for 691
adult companion dogs. J. Vet. Behav.: Clin. Appl. Res. 1, 94-108. 692
R. Core Team, 2013. R: A language and environment for statistical computing. R Foundation 693
for Statistical Computing, Vienna, Austria. ISBN 3-900051-07-0, URL http://www.R-694
project.org/ 695
Rayment, D.J., De Groef, B., Peters, R.A., Marston, L.C. 2015. Applied personality assessment 696
M
ANUS
C
R
IP
T
AC
C
EP
TE
D
Riemer, S., Muller, C., Viranyi, Z., Huber, L., Range, F. 2014. The predictive value of early 698
behavioral assessments in pet dogs – A longitudinal study from neonates to adults. 699
PloS One 9, e101237. 700
Roberts, C. and McNamee, R., 2005. Assessing the reliability of ordered categorical scales 701
using kappa-type statistics. Stat. Methods Med. Res. 14, 493-514. 702
Uher, J., 2011. Personality in Non-Human Primates: What Can We Learn from Human 703
Personality Psychology? In: Weiss, A., King, J.E., Murray, L. (Eds.), Personality and 704
Temperament in Nonhuman Primates. Atlanta, USA, Springer, pp. 41-76. 705
Valsecchi, P., Barnard, S., Stefanni, C. and Normando, S. 2011. Temperament test for re-706
homed dogs validated through direct behavioral observation in shelter and home 707
environment. J. Vet. Behav.: Clin. Appl. Res. 6, 161-177. 708
Walter, S.D, Eliasziw, M., Donner, A., 1998. Sample size and optimal designs for reliability 709
studies. Stat. Med. 17, 101-110. 710
Westgarth, C., Pinchbeck, G.L., Bradshaw, J.W., Dawson, S., Gaskell, R.M., Christley, R.M., 711
2008. Dog-human and dog-dog interactions of 260 dog-owning households in a 712
community in Cheshire. Vet. Rec. 162, 436-442. 713
Wilsson, E. and Sinn, D.L., 2012. Are there differences between behavioral measurement 714
methods? A comparison of the predictive validity of two ratings methods in a 715
working dog program. Appl. Anim. Behav. Sci. 141, 158-172. 716
Wilsson, E. and Sundgren, P.E. 1997b. The use of a behaviour test for the selection of dogs 717
for service and breeding 1: Method of testing and evaluating test results in the adult 718
dog, demands on different kinds of service dogs, sex and breed differences. Appl. 719
Anim. Behav. Sci. 53, 279-295. 720
Wilsson, E. and Sundgren, P. E., 1998a. behavior test for eight-week old puppies - 721
heritabilities of tested behavior traits and its correspondence to later behavior. 722
Appl. Anim. Behav. Sci. 58, 151-162. 723
Wilsson, E. and Sundgren, P. E., 1998b. Effects of weight, litter size and parity of mother on 724
M
ANUS
C
R
IP
T
AC
C
EP
TE
[image:25.842.46.717.44.298.2]D
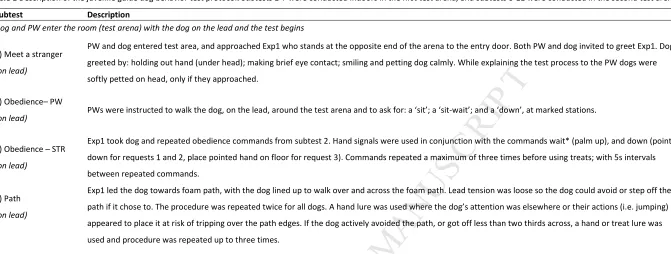
Table 1 Description of the juvenile guide dog behavior test protocol. Subtests 1-7 were conductedindoors in the first test arena, and subtests 8-11 were conducted in the second test arena. 726
Subtest Description
Dog and PW enter the room (test arena) with the dog on the lead and the test begins
1) Meet a stranger
(on lead)
PW and dog entered test area, and approached Exp1 who stands at the opposite end of the arena to the entry door. Both PW and dog invited to greet Exp1. Dog
greeted by: holding out hand (under head); making brief eye contact; smiling and petting dog calmly. While explaining the test process to the PW dogs were
softly petted on head, only if they approached.
2) Obedience– PW
(on lead) PWs were instructed to walk the dog, on the lead, around the test arena and to ask for: a ‘sit’; a ‘sit-wait’; and a ‘down’, at marked stations.
3) Obedience – STR
(on lead)
Exp1 took dog and repeated obedience commands from subtest 2. Hand signals were used in conjunction with the commands wait* (palm up), and down (point
down for requests 1 and 2, place pointed hand on floor for request 3). Commands repeated a maximum of three times before using treats; with 5s intervals
between repeated commands.
4) Path
(on lead)
Exp1 led the dog towards foam path, with the dog lined up to walk over and across the foam path. Lead tension was loose so the dog could avoid or step off the
path if it chose to. The procedure was repeated twice for all dogs. A hand lure was used where the dog’s attention was elsewhere or their actions (i.e. jumping)
appeared to place it at risk of tripping over the path edges. If the dog actively avoided the path, or got off less than two thirds across, a hand or treat lure was
used and procedure was repeated up to three times.
Dog is given a 2-3 minute break and offered a bowl of water. Following which two play behavior subtests occurred (data not presented here))
5) Body check
(off lead)
Exp1 and Exp2 knelt down and called dog to them. Exp2 held the dog’s collar and/or used a treat lure to keep dog still (where required) while Exp1 conducted
the physical examination which included: a slow pet to the head; ears were then smoothed and lifted for inspection; the dog was then stroked down its back,
sides, chest then legs where paws were lifted and given a slight press (attempted twice only). Exp1 & Exp2 avoided eye contact with the dog, talked soothingly
and if unable to conduct the subtest waited up to one minute for the dog to calm down before carrying on.
6) Head ring
(off lead)
Exp1 called dog to them and placed the ring c.20cm in front of the dogs face. Exp1 inserted hand through ring to place treat in front of dogs’ muzzle, at which
point hand was slowly pulled back through the ring and stopped when dogs head was (or could be) fully inserted. Repeated twice.
7) Tea-towel
(off lead)
Exp1 called dog to them and offered it a treat and, While dog retrieved the treat, Exp1 placed a quarter folded tea-towel over its back. Exp1 remained in position
for 10s or until the dog removed the tea-towel. Repeated twice.
M
ANUS
C
R
IP
T
AC
C
EP
TE
D
Subtest Description
8) Food
(on lead)
Exp1 led dog to the cones and asked to "sit" once. Exp1 and dog stayed there for 10s then dog led forward and walked past the plates. If the dog stopped or
tried to reach the plates Exp1 stopped ahead of it, holding it back from the food, turned and calls dogs name, if no response then the following commands were
used; "come on", followed with "dogs name" and " leave". If the dog refused to leave the plates it is touched on the side flank to gain its attention then finally
lured away with a treat (only if required).
9) Robin
(on lead)
As Exp1 and the dog approached within 0.3m of the stimuli Exp3 activated the remote control pulling device. The toy robin emerged from a hide to the right and
rapidly moved across dogs’ path to hide again on the dogs left. If the dog stopped or tried to reach the robin the response procedure from subtest 8 was
repeated until the dog moved on.
10) Pigeons
(on lead)
Exp1 and dog walked past two plastic pigeons placed 0.5 meters from the path. If the dog stopped or tried to reach them the procedure from subtest 8 was
repeated until the dog moved on.
11) Human distraction
(on lead)
Exp1 & dog walked past Exp3 who stood 1/2 a meter from the path. Exp3 stood still and looked at the dog as they approach but withholds any other contact. If
the dog stopped or jumped up on Exp3 the response procedure from subtest 8 was repeated until the dog moved on.
Note: PW indicates the dog’s puppy walker, Exp indicates an experimenter, STR is used to represent Exp1, in subtest 1 and 3, who was previously unknown to the dogs and therefore acts
as a stranger (STR) for subtests 1 and 3. *dog asked to "sit", once sat dog asked to "wait", Exp1 then takes two steps away from the dog, holding a long lead, repeats "wait" then returns
to dog and praises. If, at any point, the dog jumped up onto the experimenters they would turn their back on the dog, cross their arms and wait until jumping ceased then resume the test
calmly. Between subtest 4 and 5 the dogs took part in two further subtests on play behavior carried out by Exp2, the results of which do not form part of this study.