Article
Dentary Bone Conduction Device Equipped with a
Self-Made Laser Pointer
Jau-Woei Perng 1 and Tung-L Hsieh 1,2,*
1 Department of Mechanical and Electromechanical Engineering, National Sun Yat-sen University,
Kaohsiung 80424, Taiwan; [email protected]
2 General Education Center of Wenzao Ursuline University of Languages, Wenzao Ursuline University,
Kaohsiung 80793, Taiwan
* Correspondence: [email protected]; Tel.: +886-7-342-6031 (ext. 7226)
Abstract: Using the headphone jack of a mobile phone, the proposed device connects mobile music playback through a customized red laser pointer that is cascaded to batteries and the 3.5-mm stereo plug. The red laser pointer flashes according to the frequency of the music currently playing on the mobile phone. The self-made laser pointer which wavelength is 630–650 nm and maximum output is 5 mw and it will light up when the smart phone’s music starts playing at a music frequency matching the light frequency. The frequency signal of the light received by a solar panel is converted to an electrical analog signal, and the analog current signal is amplified through the energy conversion panel and then output to the direct current motor. The motor shaft does not rotate under a small current, but rather only slightly vibrates according to the magnitude of the currents’ analog frequency. Through gripping the motor shaft with teeth, users can transmit audio to the auditory ossicles (i.e., malleus, incus, and stapes) through the dentary bones. After receiving a music signal, the auditory ossicles enable people with congenital or acquired hearing loss to access external audio.
Keywords: dentary bone conduction; photoelectric conversion; auditory ossicles
1. Introduction
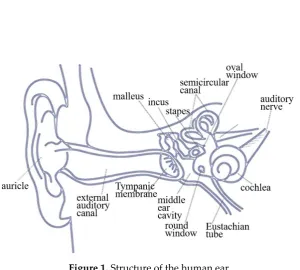
In general, the auditory system involves two means of sound transmission. The first uses air as the transmission medium, with sound passing through the outer, middle, and inner ear via the auditory nerve to the brain’s auditory center. Sound is first transmitted from the auricle to the external auditory canal, vibrating the tympanic membrane. This vibration affects the ossicles in the middle ear, which consist of three small bones, namely, the malleus, incus, and stapes (from outer to inner). The sound is then transmitted from the stapes to the foramen ovale of the inner ear. The cochlear nerve of the inner ear is responsible for hearing, and the vestibular nerve for balance; together they are known as the eighth pair of cranial nerves. This vestibulocochlear nerve extends to the auditory nucleus of the brainstem and finally reaches the auditory center in the brain, which generates an auditory sensation. In the second process, sound is transmitted through the bones. The auditory path begins with bone vibration and passes through the inner ear via the auditory nerve to the auditory center, without passing through the outer and middle ear. Sound is thus transmitted directly to the cochlea in the inner ear through the bone. The major function of this auditory path is to cause the cochlear wall to vibrate, allowing the inner ear sensors to receive the signal, which is then transmitted through the auditory nerve to the auditory center in the brain, which generates an auditory sensation. Figure 1 shows the structure of a human ear.
Figure 1. Structure of the human ear
The sound transmission path in a normal human auditory system is as follows: sound → auricle → external auditory canal → tympanic membrane → ossicles → oval window → cochlea → auditory nerve → brain. This is the path whereby each human being receives an auditory sensation. Without passing through the auditory structures before the oval window, bone conduction directly transmits sound through bone vibration. In this case, an auditory sensation travels by the following path: skull → cochlea → auditory nerve → brain. People with hearing loss who have a normal auditory nerve can still utilize the bone conduction path to receive an auditory sensation [1, 2]. According to domestic and foreign research on bone conduction hearing aids, such a device usually includes a signal converter electrically connected to a vibrator. The signal converter receives the ambient sound signal, converting it into a corresponding electrical signal. A vibrating sheet is then driven by the electrical signal to generate a vibration. Users would simply press the vibrating sheet against the bones in their middle ear area to utilize the bone as a medium to transmit the vibration frequency of the vibrating sheet to the user’s cochlear structure and auditory nerve, enabling perception of the sound received by the signal converter. However, the signal converter of a bone conduction hearing aid can receive sounds from all directions. Excessive sound sources or continual noise can prevent users from correctly receiving the target sound, resulting in the low accuracy of sound transmission. Additionally, when an audio signal is transmitted through the air, its intensity attenuates with distance. Excessive distance between the user and a sound source can thus prevent smooth transmission of the audio signal to the signal converter, and the user will therefore be unable to receive sounds from distant locations, thus diminishing usability. Conventional bone conduction devices therefore require a redesign to resolve these defects of low accuracy and poor usability. The proposed transmission device employs dentary bone vibration for sound conduction. It receives an optical signal that also carries auditory information, and limits users to receive only the audio information carried by the optical signal. This not only facilitates sound transmission accuracy but also improves usability by preventing audio signal attenuation with distance.
2. Materials and Methods
the solar panel can sensitively register the frequency and intensity of the light source and convert the light frequency signal into an analog current signal. This signal is amplified using the energy conversion board and then output to the direct current motor. The motor shaft does not rotate under the effect of a small current, but only vibrates slightly according to the magnitude of current’s analog frequency. In this study, the proposed device for transmitting sound to the auditory ossicles utilizes dentary bone conduction [3]. The device can receive an optical signal that carries auditory information, but only allows the auditory information within the signal to be received, thus improving transmission accuracy. In addition, because the proposed device [4, 5] receives an optical rather than an audio signal, the defect of signal attenuation caused by distance is substantially reduced, thereby improving usability.
2.1. Apparatus
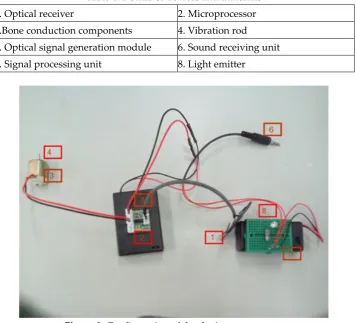
The bone conduction components consist of a motor body, power cord, and motor support frame (Table 1). The vibration rod is the power shaft of the direct current motor. The optical signal generation module is a light emitter serially connected to a 22-Ω resistor, a 3.5-mm mono socket, and a battery holder; attention should be given to the positive/negative poles and mono socket pins. The sound receiving unit is a 3.5-mm jack plug. The light emitter can be a laser source or a light-emitting diode as shown in Figure 2.
Table 1. Details of devices and materials
1. Optical receiver 2. Microprocessor
3.Bone conduction components 4. Vibration rod
5. Optical signal generation module 6. Sound receiving unit
7. Signal processing unit 8. Light emitter
Figure 2. Configuration of the device components
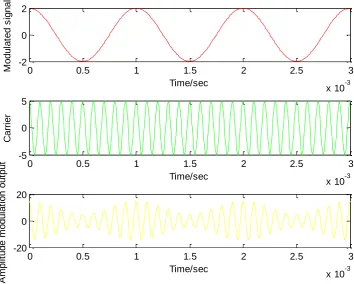
signals into electromagnetic waves (either analog or digital signals) and transmit them through the air. The original signal is coded as a high-frequency electromagnetic wave suitable for transmission in the natural environment at normal atmospheric pressure. Such a high-frequency radio wave is called a carrier wave, and the original signal is referred to as a modulating signal or signal with fundamental frequency. The converted high-frequency signal is called a modulated signal, and is suitable for radio wave transmission. The modulated signal is transmitted from transmitter to receiver through a radio interface. After receiving the signal, the receiver reverses the modulation and restores the original signal, a process known as demodulation. Modulation is a technique for converting an original signal into one suitable for transmission, thereby facilitating transmission efficiency. If the original signal is analog, analog modulation and demodulation [6, 7] are required.
Figure 3. Modulation process
2.2. Sound vibration mechanism modeling
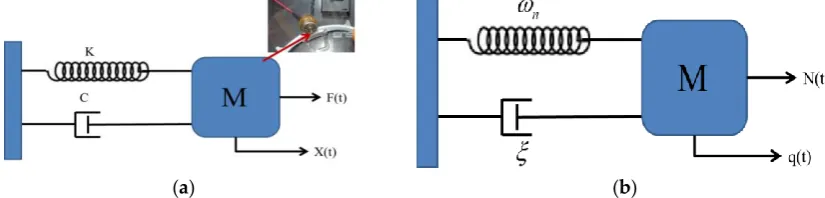
Figure 4a expresses the mathematical model [8] with physical parameters, with the equation of motion as follows:
mx cx
&
& &
+ +
kx
=
f ( t )
(1)where m, c, and k represent the mass, damping coefficient, and spring constant, respectively, which are the physical quantities of the system’s mass, damping, and spring components, respectively. Figure 4b expresses a mathematical model with modal parameters. By dividing Equation (1) by m and substituting the variables, the equation of motion for the physical parameters can be rewritten in modal parameter form as follows:
2
2
n nq
&
&
+
q
&
+
q
=
N( t )
(2) where nk
m
=
, cc
c
=
,2
2
c n
c
=
m
=
mk
q
(
t
)
=
x
(
t
)
, andf ( t )
N( t )
m
=
,0 0.5 1 1.5 2 2.5 3
x 10-3 -2 0 2 Time/sec M o d u la te d s ig n a l
0 0.5 1 1.5 2 2.5 3
x 10-3 -5 0 5 Time/sec C a rr ie r
0 0.5 1 1.5 2 2.5 3
where 𝑐𝑐 is the critical damping coefficient, which denotes the damping ratio, 𝜔𝑛 denotes the
natural frequency, x(t) is the physical coordinate, f(t) defines the physical force, and q(t) is the modal coordinate.
Each conversion between domains, such as the conversion from a mathematical model with physical parameters to one with modal parameters, or the conversion of a mathematical model with modal parameters into one with frequency parameters, has a corresponding equation.
(a) (b)
Figure 4. Mathematical model with (a) physical parameters and (b) with modal parameters.
2.3. Response Analysis
Harmonic excitation force was set as the external force, f(t) = F𝑒𝑖𝜔𝑡. By substituting x(t) = X𝑒𝑖𝜔𝑡
into the equation of motion, the frequency response function is obtained:
2 2 2
1
1
2
n n
X
m
H(
)
F
( k
m
) i( c )
(
) i(
)
=
=
=
−
+
−
+
(3)Using Equation (3), the frequency response function can be converted into a function of physical or modal parameters, which is related to the harmonic excitation frequency ω.
For the transient response analysis, if the input condition f(t), initial conditions 𝑥0 and 𝑣0, and
system content (e.g., the physical and modal parameters) are known, the time-domain output response of the system can be obtained using the following equation:
(
)
( ) (
)
( )
nn t t
d d
0
t 2
d n d
d
x(t)
e
A cos
t
Bsin
t
f t h t
d
1
1
; h t
e
sin
t
m
ξω
ξω
ω
ω
τ τ
ω
ω
ξ
ω
ω
−
−
=
+
+
−
=
−
=
(4)
where 𝜔𝑑 denotes the damped natural frequency; A and B are random constants defined by the
initial condition; and h(t) represents the unit impulse response function of the system.
For the spectrum response analysis, if the frequency domain can be presented as the power spectral density (PSD) [9] function x(t) and the frequency response function is known, the frequency domain response can be obtained through spectrum response analysis:
2
xx ff
G (
)
=
H (
) G (
)
(5) where 𝐺𝑥𝑥(𝜔) is the physical coordinate and x(t) denotes the PSD function as shown in (5).Figure 5. Circuit diagram of photoelectric conversion.
The purpose of system modal analysis and testing is to develop specific analysis procedures and testing and measurement methods to obtain a mathematical model of the sound vibration mechanism. This model can be presented in the form of mathematical model with modal or physical parameters. The analysis process flowchart is presented in Figure 6.
2.3. Speech analysis
Before feature extraction, audio signals undergo preprocessing through an analog-to-digital converter, using software to easily and accurately obtain their characteristics. After the speech frame is determined through normalization, the initial and final positions of the sound are estimated using the zero crossing rate (ZCR) of the time domain endpoint detection algorithm. Subsequently, effective frames are extracted, and feature extraction is performed using Fast Fourier transform (FFT). Figure
7 presents the voice signal processing procedure.
Voice signal
Analog to
Digital
Normalization
Zero Crossing
Rate
FFT
Feature
Extraction
Figure 7. Flowchart of voice signal processing
2.3.1. Normalization
The different sound volume of each person generates a distinctive amplitude. To unify the amplitudes for subsequent signal processing, they are normalized as shown in (6).
(6)
2.3.2. ZCR
Zero crossing is defined as the number of times the amplitude of a signal crosses the zero level. The aspiration or friction sound in human speech requires low energy but features higher frequency, shorter cycle length, and higher ZCR than sound in general. These features can assist in identifying the location of aspiration or friction sound sections in the audio signal. This can be expressed in the following equation as shown in (7):
(7)
1
0
0
0
, x
s( x )
, x
=
1
0
1
0
, x
sgn( x )
, x
=
−
where Z (n) is the ZCR of the nth frame; s(x) denotes the step function; sgn(x) represents sign function; x(…) is the amplitude information of the signal; c denotes the center of the frame; and N is the frame width, generally 256 or 512. when two adjacent signal samples of the same sign multiply, the result must be positive; conversely, when their signs are opposite, the result must be negative. For every frame, the frequency at which each sample point crosses zero is calculated.
3.3.3. FFT
( )
( )
( )
maxmax
P
max P n
P n
y n
P
=
=
2 21
1
N /k N /
Z( n )
s sgn( x( c k ) x( c k
))
N
=−Because signal variation in a time domain causes difficulty in identifying signal characteristics, it is often converted to energy distribution in the frequency domain. Different energy distributions in the frequency domain represent different speech characteristics, which is typically analyzed using the FFT, the equation of which is as follows:
(8)
where
X
iis the ith frame vector;x n
i( )
is the nth value of the ith frame vector; and N is the numberof sample points in the frequency domain as shown in (8).
3. Results
3.1. Speech Endpoint Detection
Firstly, the analog signal of speech is converted into a digital signal using the Audacity software program. The sample points obtained per second are expressed in Hz, and this is called the sample rate (fs). Common sample rates include 8 kHz (telephone), 16 kHz (general speech recognition), and 44.1 kHz (CD player). A voice-receiving channel can be divided into mono and stereo. A mono system is similar to a point source, which only replays the original sound but cannot represent its directionality and spatial sense, whereas the stereo system uses linear noise composed of both left and right channels to represent horizontal sound in its directionality and spatial sense. The channel adopted in this experiment is mono. Because different volumes generate different amplitudes, audio signals are normalized to unify amplitudes and obtain a valid frame range for subsequent signal processing. Human speech often contains aspiration or friction, which can render the detection of sound energy difficult due to its low energy. The zero crossing rate in the endpoint detection method [10] can be employed to correct the endpoint range and extract an entire syllable (Figure 8).
Figure 8. An audio signals after ZCR calculation.
0
0.5
1
1.5
2
2.5
3
-1
0
1
v
o
ic
e
.w
a
v
0
0.5
1
1.5
2
2.5
3
0
50
100
V
o
lu
m
e
(
A
b
s
.
s
u
m
)
0
0.5
1
1.5
2
2.5
3
-50
0
50
V
o
lu
m
e
(
D
e
c
ib
e
ls
)
Time (sec)
(
2)
1( )
20 N
j k / N j k / N
i i
n
X e
x n e
−
=
=
3.2. Feature extraction
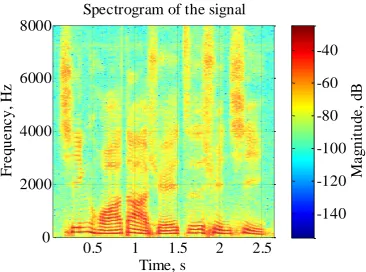
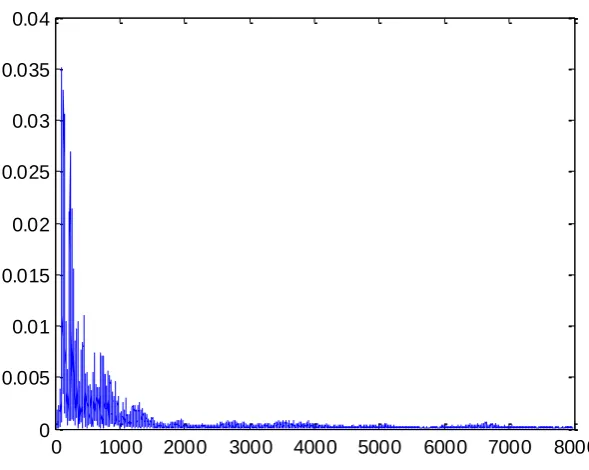
Signal features are troublesome to be cognized by perceiving changes of the scope value of an audio signal in the time domain (Figure 9). Transforming the audio signal into a spectrogram (Figure 10) permits sonic features to be identified [11]. Since this procedure seems fingerprint contrast, it is also familiar as voiceprint recognition. The scope value of an audio signal in the time domain is often transformed to an energy allocation in the frequency domain for inspection. Various energy allocations in the frequency domain imply different speech features. A signal in the time domain transforms rapidly and constantly, guiding to inexact observation. Thence the most frequently used skill is transposition of the audio signal from the time to the frequency domain, accordingly define the spectral features of various sounds through their energy allocation. The spectrum is a expression of a time domain signal in the frequency domain and can be acquired by performing FFT on the signal [12-17]. The result is expressed as a spectrogram, with the amplitude or phase as the vertical axis and the frequency as the horizontal axis (Figure 11).
Figure 9. Scope value of audio signal, where fs (44100) is the sampled frequency
Figure 10. Audio signal spectrogram
0
0.5
1
1.5
2
2.5
-0.5
0
0.5
Time, s
A
m
p
li
tu
d
e
The signal in the time domain
0.5
1
1.5
2
2.5
0
2000
4000
6000
8000
Spectrogram of the signal
Time, s
F
re
q
u
e
n
c
y
,
H
z
M
a
g
n
it
u
d
e
,
d
B
Figure 11. Audio signal spectrum
3.3. Filter Design
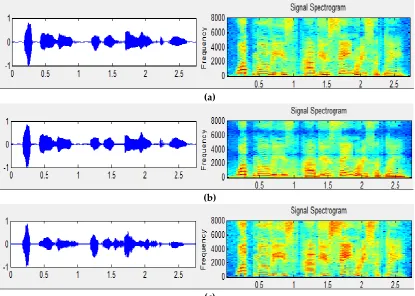
Figure 12a describes the discrepancy between the first signal and the filter output signal, representing that the treble is almost removed. So, we can utilize the audio to see if the high-frequency elements can be removed. The low-pass filter [18-22] functions to pass the low-frequency signal and weaken the high-frequency signal, which is appropriate for high-frequency noise as shown in Figure 12b. For example, if the temperature or flow sensor has a low frequency, the low-pass filter can be used to eliminate electrical noise generated by a motor [23–26].
A digital filter can be represented by two parameter vectors, a and b, where the lengths of a and b are p and q, respectively, and the first element of a is always 1, as follows:
a = [1, a2, ... a𝑝]
b = [b1, b2, ... b𝑞]
If we apply a digital filter with parameters a and b to a stream of discrete-time signal x[n], the output y[n] should satisfy the following equation:
y[n] + a2y[n – 1] + a3y[n – 2] + ... + a𝑝x[n – p + 1] = b1x[n] + b2x[n – 1] + ... + b𝑞x[n – q + 1]
Or equivalently, we can express y[n] explicitly as:
y[n] = b1x[n] + b2x[n – 1] + ... + b𝑞x[n – q + 1] –a2y[n – 1] –a3y[n – 2] – ... – a𝑝x[n – p + 1]
The preceding equation is somewhat complicated. We provide some more specific examples to facilitate understanding.
First, if we have a filter with the parameters a = [1] and b = [1/5, 1/5, 1/5, 1/5, 1/5], then the output of the filter is y[n] = (x[n] + x[n – 1] + x[n – 2] + x[n – 3] + x[n – 4])/5.
Figure 15 shows the different levels of filtering effects at different cutoff frequencies. The treble part is almost deleted after filtering. Only the sound of the bass survives, and then the bass sound that appears through these regular rules allows us to track the beat.
The result is a simple filter set y[n] as the average of the preceding five points of the
input signals. In fact, this is a low-pass filter
[27–31]
, since after the averaging operator, the
high-frequency component is averaged out, while the low-frequency component is retained.
0 1000 2000 3000 4000 5000 6000 7000 8000
The effect of a low-pass filter is like putting a paper cup over one’s mouth while speaking,
generating a murmuring-like, indistinct sound.
a = [1] b = [1, -1] The output of the fitler is
y[n] = x[n] - x[n-1]
In other words, the output of the filter y[n] is equal to the difference of the preceding two points of x[n]. As the result, low-frequency components (with slow variations) will have low values while high-frequency components (with fast variations) will have high values. So this is a typical high-pass filter (Figure 12c) which amplifies high-frequency and suppresses low-frequency components.
(a)
(b)
(c)
Figure 12. (a) Original audio. (b) The output signal passes through a low-pass filter. (c) The output signal passes through a High-pass filter.
4. Discussion
(a) (b)
(b) (d)
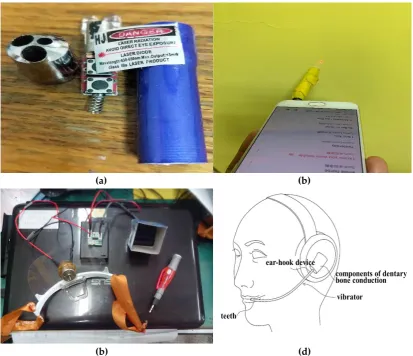
Figure 13. (a) Disassembly of a laser diode. (b) Laser pointer combined with mobile phone audio. (c) Design of the experimental dentary bone conduction device. (d) Final dentary bone conduction device.
Author Contributions: T.-L.H. and J.-W.P. conceived of the presented idea. T.-L.H. developed the theory and performed the computations. T.-L.H. verified the analytical methods. J.-W.P. encouraged investigation and supervised the work. All authors discussed the results and contributed to the final manuscript.
Funding: This research received no external funding
Acknowledgments: This research has been reviewed by the IEEE ECBIOS 2020 committee, where it was recommended to be submitted to Electronics.
Conflicts of Interest:
The authors declare no conflict of interest.
References
1. Haim S.; Sharon F.; Miriam G. D.; Cahtia A. and Igal S. Bone Conduction Experiments in Humans a Fluid Pathway from Bone to Ear. Hearing Research, 2000, 146, 81-88.
2. Sabine R.; Stefan S.; Tobias G. and Bo H. Examination of bone-conducted transmission from sound field excitation measured by thresholds. ear-canal sound pressure, and skull vibrations, 2007, Acoustical Society of America.
3. Kenji K. and Mikio M. Effects of Wearing Ear Plugs in Bone-Conduction Hearing Via Teeth. IEEE 5th Global Conference on Consumer Electronics (GCCE), 2016, Kyoto, 573-574.
4. Bakare, B.I.; Nwakpang, F.M.; Desire, A.E. Propagation Analysis of Radio Frequency (RF) Signal of Love FM Transmitter in Port Harcourt, Nigeria. IOSR J. Electron. Commun. Eng. (IOSR-JECE) 2019, 14, 5–12. 5. T. Koike, Sound transmission in human auditory system. Comp. Physiol. Biochem., 2007, 24, 3, 122–125. 6. Y. Balal, M. Pinchas and Y. Pinhasi. Constant Envelope Modulation Techniques for Limited Power
7. Y. Liu, W, Chen, A. Wang and C. Han. Combination of High-Order Modulation and Non-Binary LDPC Codes over GF(7) for Non-Linear Satellite Channels. Electronics 2019, 8(12), 1396.
8. Munyazikwiye, B.B.; Robbersmyr, K.G.; Karimi, H.R. A state-space approach to mathematical modeling and parameters identification of vehicle frontal crash. Syst. Sci. Control Eng. 2014, 2, 351–361.
9. Sun, Y.; Wang, X. Power spectral density of pulse train over random time scaling. IET Signal Process 2014, 8, 601–605.
10. Jiea, L.; Pingb, Z.; Xinxingc, J.; Zhiran, D. Speech End point Detection Method Based on TEO in Noisy Environment. Procedia Eng. 2012, 29, 2655–2660.
11. Müller, M.; Ellis, D.P.W.; Klapuri, A.; Richard, G. Signal Processing for Music Analysis. IEEE J. Sel. Top. Signal Process. 2011, 5, 1088–1110.
12. Jiang, D.N.; Cai, L.H. Speech emotion classification with the combination of statistic features and temporal features. IEEE ICME 2004, 3, 1967–1970.
13. Schuller, B.; Rigoll, G. Timing levels in segment-based speech emotion recognition. In Proceedings of the Interspeech 2006—ICSLP, 2006, Pittsburgh, PA, USA, 17–21 September.
14. Reynolds, D.A. Large Population Speaker Identification Using Clean and Telephone Speech. IEEE Signal Process. Lett. 1995, 2, 46–48.
15. Mashao, D.J.; Baloyi, N.T. Improvements in The Speaker Identification Rate Using Feature-Sets on A Large Population Database. In Proceedings of the Seventh European Conference on Speech Communication and Technology, 2001, Aalborg, Denmark, 3–7 September.
16. Chetouani, M.; Mahdhaoui, A.; Ringeval, F. Time-scale feature extractions for emotional speech characterization. Cognit. Comput. 2009, 1, 194–201.
17. Vondra, M.; Vích, R. Recognition of emotions in german speech using gaussian mixture models. In Multimodal Signals: Cognitive and Algorithmic Issues; 2009.
18. J. Zhang.; R. Yang and C. Zhang. High-Performance Low-Pass Filter Using Stepped Impedance Resonator and Defected Ground Structure. Electronics 2019, 8(4), 403.
19. M. H. Weng.; F. Z. Zheng.; H. Z. Lai and S. K. Liu. Compact Ultra-Wideband Bandpass Filters Achieved by Using a Stub-Loaded Stepped Impedance Resonator. Electronics 2020, 9(2), 209.
20. L. Liu, P. Zhang, M. H. Weng, C. Y. Tsai and R. Y. Yang. A Miniaturized Wideband Bandpass Filter Using Quarter-Wavelength Stepped-Impedance Resonators. Electronics 2019, 8(12), 1540.
21. Xu, Y.; Muhlestein, J.; Moon, U.K. A 0.65 mW 20 MHz 5th-order low-pass filter with +28.8dBm IIP3 using source follower coupling, In Proceedings of the IEEE Custom Integrated Circuits Conference (CICC), 2017, Austin, TX, USA, 30 April–3 May.
22. Ding, Y.; Liu, L.; Li, R.; Zhang, X.; Liu, L. A 5–80 MHz CMOS Gm-C Low-Pass Filter with On-Chip Automatic Tuning. In Proceedings of the 2011 International Conference on Digital Manufacturing and Automation (ICDMA), 2011, Hunan, China, 5–7 August.
23. Bao, K.; Fan, X.; Wang, Z. A 0.18-μm-CMOS Low-Power Reconfigurable Low Pass Filter for Multi-Standard Receivers. In Proceedings of the 2013 IEEE Advanced Technologies for Communications (ATC), 2013, Ho Chi Minh City, Vietnam, 16–18 October.
24. Oliveira, M.S.; de Aguirre, P.C.; Severo, L.C.; Girardi, A.G.; Susin, A.A. A Digitally Tunable 4th-order Gm-C Low-Pass Filter for Multi-Standards Receivers. In Proceedings of the 2016 IEEE Integrated Circuits and Systems Design (SBCCI), 2016, Belo Horizonte, Brazil, 29 August–3 September.
25. Gao, J.; Jiang, H.; Zhang, L.; Dong, J.; Wang, Z. A programmable low-pass filter with adaptive miller compensation for zero-IF transceiver. In Proceedings of the 2012 IEEE Circuits and Systems (MWSCAS), 2012, Boise, ID, USA, 5–8 August.
26. Jin, X.; Dai, F.F. A 6th order zero capacitor spread 1 MHz–10 MHz tunable CMOS active-RC low pass filter with fast tuning scheme. In Proceedings of the 2012 IEEE International Symposium on Circuits and Systems (ISCAS), 2012, Seoul, Korea, 20–23 May.
27. Lee, I.Y.; Im, D.; Ko, J.; Lee, S.G. A 50–450 MHz Tunable RF Biquad Filter Based on a Wideband Source Follower With >26 dBm IIP3, +12 dBm P1dB, and 15 dB Noise Figure. IEEE J. Solid State Circuits 2015, 50,
2294–2305.
29. Houfaf, F.; Egot, M.; Kaiser, A.; Cathelin, A.; Nauta, B. A 65 nm CMOS 1-to-10 GHz tunable continuous-time low-pass filter for highdata-rate communications. In Proceedings of the 2012 IEEE International Solid-State Circuits Conference, 2012, San Francisco, CA, USA, 19–23 February, pp. 362–364.
30. Cheng, Y.W.; Wu, J.W.; Lin, T.H.; Wang, C.J. A Low-Pass Filter by Using a Meandered Slot. In Proceedings of the 2014 IEEE International Workshop on Electromagnetics (iWEM), 2014, Sapporo, Japan, 4–6 August. 31. Wenxiang, X.; Xinfeng, L.; Yongzhong, H. Design of Compact Ultra Wide-Stopband Lowpass Filter. In