Experimental overview of collective flow with identified particles at RHIC and
the LHC
Panos Christakoglou1,a
1Nikhef, Science Park 105, 1098XG Amsterdam, The Netherlands
Abstract.Anisotropic flow studies play a crucial role in improving our understanding of the behaviour and the nature of matter created in collisions of heavy ions. In particular, the study of elliptic flow (v2) for identified particles can be used to constrain the initial conditions and the value of shear viscosity over entropy density ratio. It also allows to determine the role of the hadronic rescattering phase in the development of flow. In these proceedings I review the results from measurements ofv2for identified particles from the RHIC and LHC heavy-ion physics programs.
1 Introduction
One of the most remarkable predictions of the Standard Model of particle physics is that, at sufficiently high den-sities and temperatures, the protons and neutrons of or-dinary matter should melt into a plasma where the quark and gluon degrees of freedom are not anymore confined. This hot and dense primordial state of matter is called Quark Gluon Plasma (QGP) and should have existed in the expanding universe up to a few microseconds after the Big-Bang, when the phase transition to hadronic mat-ter of confined quarks and gluons took place. Tempera-tures and energy densities similar to the ones in the very early universe can be created in collisions of heavy ions at ultra–relativistic energies in particle accelerators. Quan-tum Chromo Dynamics (QCD), an integral part of the Standard Mode, is the theory that describes the physics of the strong interaction. According to QCD, the phase transition should occur at a critical temperature of about 155 MeV, corresponding to a critical energy densityof about 0.5 GeV/fm3[1, 2]. In heavy-ion collisions at the
en-ergies of the Relativistic Heavy Ion Collider (RHIC) and at the Large Hadron Collider (LHC) values of that exceed by far this critical value are attained (e.g.≈14 GeV/fm3
as reported in [3] in Pb–Pb collisions at the LHC). The aim of the heavy–ion program at both RHIC and LHC is to find convincing evidence of the existence of this new state of matter, to further study its properties and map the QCD phase diagram, usually depicted in terms of tem-perature T and baryochemical potentialμB. The studies of
anisotropic flow at high RHIC energies (i.e. in Au–Au col-lisions at √sNN =130-200 GeV), that correspond to small μBvalues [4–7] played fundamental role in revealing that
the system behaves as an almost perfect liquid. This is re-flected in the small value of the ratio of shear viscosity to
ae-mail: [email protected]
entropy density (η/s) which quantifies the friction of the created matter. In particular the value ofη/sis believed to be very close to the conjectured lower limit of/4πkB
[8]. The latest measurements at the LHC [9–14], where μB ≈ 0, indicate that the system created in Pb–Pb
colli-sions at √sNN=2.76 TeV has similar characteristics.
In non-central nuclear collisions the initial spatial anisotropy of the overlap region between the two collid-ing nuclei is transformed into an anisotropy in momentum space through interactions between partons and at a later stage between the produced particles. Anisotropic flow characterises this final state momentum anisotropy and can be used to constrain the value ofη/s. It can also provide valuable information about the initial state irregular shape of the overlap region of the colliding nuclei. These inho-mogeneities result from the initial density profile of nucle-ons participating in the collision which is different from one event to the other [15–19].
Anisotropic flow studies are based on the description of the azimuthal distribution of particles by a Fourier series dN/dϕ≈1+∞n=12vncos[n(ϕ−Ψn)] [20, 21], whereϕis the azimuthal angle of particles, andvn=cosn(ϕ−Ψn) are the different flow coefficients developing relative to the symmetry planes Ψn for each harmonic n. The second Fourier coefficient,v2, measures the azimuthal momentum
space anisotropy of particle emission relative to the second harmonic symmetry plane and is known as elliptic flow.
The study of elliptic flow of particle species pro-vides the interesting possibility to probe physics mecha-nisms usually associated to different transverse momen-tum ranges in a more differential way. The first measure-ments ofv2 at RHIC energies [4–7] were described fairly
well by ideal hydrodynamical calculations albeit up to low values of transverse momentum (i.e. forpT<1.5 GeV/c).
It was realised at a later stage that the inclusion of small viscous corrections extend the agreement with
tal measurements topT <2.5 GeV/c. Although the
devel-opment of elliptic flow at the partonic stage of the evolu-tion of the system is a well established concept, it is crucial to further understand the role and the relevant significance of the hadronic rescattering phase. This can be done by studying particles, such asφ,Ξ−+Ξ+andΩ−+Ω+, with a small hadronic cross-section which are expected to probe mainly the early, partonic stages of the collision.
In the intermediate transverse momentum region (2< pT < 8 GeV/c) an interesting scaling emerged at RHIC
[22–24]: whenv2(pT) scaled by the number of constituent
quarks,nq, (i.e. 2 for mesons and 3 for baryons) is plot-ted as a function of pT/nq, all particle species seem to be lying in one universal curve forpT/nq >1 GeV/c. This is usually referred to as number of constituent quarks (NCQ) scaling, and led naturally to the development of a picture where flow develops at the partonic level and particles are created via coalescence of constituent quarks [25–29].
At high values of transverse momentum (i.e. for pT >
8 GeV/c), particles are predominantly produced via the fragmentation of energetic partons. These partons, inter-act with the medium while traversing it and experience ra-diative and collisional energy loss [30, 31]. This mecha-nism develops an azimuthal asymmetry in the presence of an initially asymmetric system, like the one in non-central collisions: partons crossing the short axis (i.e. in plane) of the overlap region, cross smaller path in the medium and thus their energy is less attenuated compared to the ones that cross the long axis (i.e. out of plane). This leads to an anisotropy in the particle production and the develop-ment ofv2 that can now be used to probe the path length
dependence of energy loss [32, 33].
In the discussion of thev2in these different transverse
momentum ranges, the presence of the partonic stage in the evolution of the system is of fundamental importance. One interesting possibility to experimentally control the formation of the QGP is provided by moving to large val-uesμB. This can be done by lowering the collision energy
in fine steps, and thus mapping the QCD phase diagram. This is done in the Beam Energy Scan (BES) program of RHIC, where Au–Au collisions at √sNN =62.4, 39, 27, 19.5, 11.5 and 7.7 GeV are recorded. The study of elliptic flow at these lower energies can give valuable indications as to whether the hadronic instead of partonic degrees of freedom become relevant.
In this article, I review the latest experimental results on the elliptic flow for identified particles, from heavy–ion collisions at both RHIC [34, 35] and LHC [36].
2 Azimuthal anisotropy at low
μ
BIn [36] the ALICE Collaboration presented the pT
dif-ferentialv2 (i.e. v2(pT)) of mesons (π±, K±, K0S,φ) and
baryons (p,Λ,Ξ−,Ω−, and their antiparticles) measured in Pb–Pb collisions at √sNN=2.76 TeV. The results were
reported in|y| <0.5, withythe rapidity of each particle, and 0.2 < pT < 6.0 GeV/c. The values ofv2 were
ob-tained with the Scalar Product method [45, 46], using a pseudo-rapidity gap of|Δη|>0.9 to suppress correlations
0 2 4
0 0.1 0.2 0.3 0.4
= 2.76 TeV
NN s
ALICE 10-20% Pb-Pb
| > 0.9}
ηΔ
{SP,|2
v
)
c
(GeV/ T
p
±
π K
p
p+ φ
Λ + Λ Ξ-+Ξ+
+
Ω +
-Ω
Figure 1. ThepT-differentialv2 for different particle species in the 10-20% centrality interval of Pb–Pb collisions at √sNN = 2.76 TeV. The data points are extracted from [36].
not related to the common symmetry plane. The latter are known as non-flow effects and consist of correlations aris-ing from jets or resonance decays and quantum statistics correlations.
Figure 1 presents the dependence of v2 for diff
er-ent particle species on transverse momer-entum in the 10-20% centrality interval of Pb–Pb collisions at √sNN =
2.76 TeV. For pT < 2 GeV/c particles are ordered
ac-cording to their mass i.e. for a fixed value of pT
heav-ier particles exhibit lowerv2compared to lighter particles.
This ordering is induced by an interplay between radial and elliptic flow that results in a mass dependent lowerv2
value [36]. This can be understood considering that radial flow acts over the particle spectra that consist of two com-ponents i.e. the thermal part and the part that is affected by the expanding medium and is mass dependent. This mass dependent component introduces a depletion in the particle spectrum at low values ofpT, which is more
pro-nounced for heavier particles. In an azimuthally asymmet-ric system, the pressure gradient and thus the expansion velocity is larger in-plane compared to the out-of-plane di-rection. This naturally leads to a larger depletion at low values ofpTin the direction of the symmetry plane. Since
v2 quantifies the relative difference of particle yield
in-plane versus out-of-in-plane, this mechanism leads naturally to a reduction of the value ofv2. When the two effects (i.e.
radial flow acting on particle spectra and an azimuthally asymmetric system) are coupled then v2 becomes lower
with increasing mass for a given value ofpT.
Beyond the crossing point and at the intermediatepT
(i.e. for 2 < pT <6 GeV/c), particles seem to form two
(GeV/c) T
p
0 0.5 1 1.5 2
2
v
0 0.1 0.2
ALICE
±
π K
p p+ φ
Λ + Λ
+ Ξ + -Ξ
VISHNU
Phys. Rev. C89, 034919 (2014) Centrality 10-20%
Figure 2. ThepT-differentialv2for different particle species in the 10-20% centrality interval of Pb–Pb collisions at √sNN = 2.76 TeV. The experimental data points from [36] are compared with VISHNU calculations [37–39], which couples the hydrody-namical evolution of the system with a hadron cascade model.
2.1 Test of hydrodynamical picture
After the initial success of ideal hydrodynamical calcula-tions in describing the integrated and differentialv2, new
theoretical calculations emerged incorporating the effects of viscous corrections. However recently, there were at-tempts to couple the hydrodynamical evolution of the sys-tem to a hadronic cascade model. Such calculations are important to be confronted to data to unveil the importance of the hadronic rescattering phase in the development of v2. Such comparisons can also play a significant role in
tuning the input parameters (e.g. hadronic cross-sections) for the different stages.
Figure 2 presents the comparison of the experimen-tal measurements for central events with the calculations extracted from [37–39]. These calculations are based on VISHNU that couples the hydrodynamical evolution of the system to a hadronic cascade model. VISHNU provides a reasonable description of the transverse momentum de-pendence ofv2forπ±and K. However, for heavier
parti-cles one can observe significant differences. In particular, the model significantly underestimates the elliptic flow for protons, while overestimatingv2 of φ,Λ+ΛandΞ−+Ξ
+
. What is striking though, is that VISHNU expects that the mass ordering is not preserved, something which is not supported by the experimental measurements [36].
One natural question is whether this breaking of mass ordering is induced by the hadronic cascade, which fol-lows the hydrodynamical evolution of the system. In an attempt to answer this question, fig. 3 presents the com-parison between the pT-differentialv2from VISHNU and
VISH2+1 [43]. The latter is a 2+1–dimension pure hy-drodynamical calculation, with a non-zero shear viscosity over entropy density ratio. The same centrality interval as in fig. 2 is reported for three indicative particle species for each plot: π±, p+p andφin the upper and K±,Λ+Λ
(GeV/c) T
p
0 0.5 1 1.5 2
2
v
0 0.1 0.2
VISHNU
Centrality 10-20%
VISH2+1
±
π ) p p( φ
(GeV/c) T
p
0 0.5 1 1.5 2
2
v
0 0.1 0.2
VISHNU
±
K ) Λ ( Λ
) + Ξ ( -Ξ
Centrality 10-20%
VISH2+1
±
K ) Λ ( Λ
) + Ξ ( -Ξ
Figure 3. Comparison between calculations from VISHNU (solid lines) [37–39] and VISH2+1 (dashed lines) [43] for the 10-20% centrality interval of Pb–Pb collisions at √sNN=2.76 TeV. The results forπ±, p+p,φ, and K±,Λ+ΛandΞ−+Ξ+are pre-sented in the upper and lower plot, respectively.
and Ξ−+Ξ+ in the lower plot. It is seen that VISHNU, represented by the solid curves, clearly violates the mass ordering, as exhibited e.g. by the relevant lines for p+p andφ(green and red, respectively). On the other hand, the dashed lines that correspond to VISH2+1 exhibit similar mass ordering as the one observed in the measurements.
Furthermore, it is of great interest to note that while the curves for the two different calculations forπ± are quite similar, there is a significant difference observed for p+p. In particular, VISHNU expects stronger radial flow than VISH2+1, which is reflected in lowerv2 for fixed
trans-verse momentum values. Moreover, it is also worth notic-ing that the inclusion of the hadronic phase for the case of theφ-meson does not introduce any significant deviation inv2(pT) as compared to the pure hydrodynamical
0 1 2 0
0.05 0.1
= 2.76 TeV
NN s
ALICE 10-20% Pb-Pb
q
n
/
| > 0.9}
ηΔ
{SP,|2
v
) c (GeV/
q n
/
T
p
±
π K
p
p+ φ
Λ +
Λ +
Ξ +
-Ξ
+
Ω +
-Ω
0 1 2
0 0.05 0.1
= 2.76 TeV
NN s
ALICE 10-20% Pb-Pb
q
n
/
| > 0.9}
ηΔ
{SP,|2
v
)
2
c (GeV/
q n
)/
0 m
-
T m
(
±
π K
p
p+ φ
Λ + Λ Ξ-+Ξ+
+
Ω +
-Ω
Figure 4.ThepT/nq(upper plot) and (mT−m0)/nq(lower plot) dependence ofv2/nq forπ±, K, p+p,φ, Λ+Λ, andΞ−+Ξ
+
for Pb–Pb collisions in the 10-20% centrality intervals of Pb-Pb collisions at √sNN = 2.76 TeV. The data points are extracted from [36].
v2 values obtained in VISHNU are lower than the ones
from VISH2+1 for a fixed pT. On the other hand, for
Ξ−+Ξ+ there is no significant difference between these
two calculations and if there is any it works in the op-posite direction i.e. the v2 at a given pT in VISH2+1 is
smaller than VISHNU. This decrease can be attributed to the small hadronic cross-section that theΞ−+Ξ+are esti-mated to have.
In conclusion, it seems that the development of flow is affected by the inclusion of the hadronic resctattering phase. This influence seems to have a dependence on the quark flavor, with particles containing s-quarks being sig-nificantly less affected as compared to hadrons consisting of light quarks.
2.2 Test of scaling properties
At the intermediatepTrange (i.e. 2<pT <8 GeV/c),
coa-lescence is believed to be the dominant particle production mechanism. This picture was reinforced by the observa-tion that at RHIC energies particles tend to follow a sim-ple scaling law: different particle species follow, within
0 2 4 6
0 0.1 0.2 0.3 0.4
= 2.76 TeV
NN s
ALICE 10-20% Pb-Pb
| > 0.9}
ηΔ
{SP,|2
v
)
c
(GeV/ T
p
± π
p p+
φ
0 2 4 6
0 0.1 0.2 0.3 0.4
= 2.76 TeV
NN s
ALICE 40-50% Pb-Pb
| > 0.9}
ηΔ
{S
P
,|
2
v
)
c
(GeV/ T
p
± π
p p+
φ
Figure 5.ThepT-differentialv2forπ±, p+p andφ-mesons, in the 10-20% (upper plot) and he 40-50% (lower plot) centrality inter-vals of Pb–Pb collisions at√sNN=2.76 TeV. The data points are extracted from [36].
uncertainties, a universal curve when v2/nq is plotted as a function of pT/nq, for pT/nq > 1 GeV/c[22–24]. To extend this scaling to lower transverse momentum values, the PHENIX collaboration in [23, 24] proposed to use the transverse kinetic energy defined asKET =mT−m0 as a
scaling variable since it accounts for the blue shift induced by radial flow.
The upper plot of fig. 4 presents thepT/nqdependence ofv2/nq for different particle species measured in central Pb–Pb collisions at √sNN=2.76 TeV. It is seen that there are deviations from the universal scaling of around±20% for pT/nq >1 GeV/c. Similar deviations are observed in the lower plot of fig. 4, wherev2/nq is plotted as a func-tion of (mT −m0)/nq for the same centrality interval and for (mT−m0)/nq>0.6−0.8 GeV/c2. No significant diff er-ence compared to this picture is reported in [36] for other centrality intervals.
2.3 The important role of theφ-meson
experimen-tally whether the mass ordering is preserved at low val-ues of pT. In addition, due to its small hadronic
cross-section [48], it is expected to probe mainly the partonic stages of the collision and in parallel give valuable feed-back to hybrid hydrodynamical approaches that attempt to couple the hadronic cascade phase to the early, hydrody-namical evolution of the system. Finally, it provides a test-ing ground of the baryon-meson grouptest-ing at intermediate values ofpT.
Figure 5 presents the transverse momentum depen-dence ofv2 for charged pions (open black circles), p+p
(green filled squares) andφ (red filled circles) measured in Pb–Pb collisions at √sNN = 2.76 TeV. Two centrality intervals are shown: the 10-20% and the 40-50% intervals on the left and right plot, respectively. It is seen that at low values of transverse momentum thev2 of theφ-meson is
slightly smaller than the value of p+p at a given value of pT. However, the lowest transverse momentum point ofφ
for both centralities might be hinting to a reverse mass or-dering. The current statistical and systematic uncertainty extracted from the analyzed data sample does not allow to reach a solid conclusion. This can be further explored with either the analysis of the 2011 sample or with the new data set that ALICE is going to collect in run-II.
At the intermediate transverse momentum region, the φ-meson seems to be following the baryon band for cen-tral collisions, while progressively moving to the meson band in peripheral events. This indicates that at least in central events the mass and not the number of constituent quarks is still the driving force of the behavior of elliptic flow. This surprising behavior of theφ-meson can not be accommodated within the coalescence picture and seems to request for a refinement of its formalism.
2.4 Comparison between LHC and RHIC energies
One of the interesting observations of the first measure-ments at the LHC [9] was that although thepT-differential
v2for several centrality intervals was not only qualitatively
but also quantitatively in agreement with top RHIC ener-gies, the integrated values are larger by 30%. This was at-tributed to a largerpTat the LHC as compared to RHIC.
To study this reported similarity inv2(pT), and answer the
natural question of whether this was accidental or it has some further physics implications, it is instructive to look at the relevant comparison ofv2for identified particles.
Figure 6 presents the pT-differential v2 for the 10%
most central heavy-ion collisions at LHC and at RHIC, the latter for Au-Au collisions at √sNN=62.4 GeV [34, 35]. Since there are differences in thev2values between
parti-cles and antipartiparti-cles at RHIC energies, that will be dis-cussed in Section 3, the results for both are shown sepa-rately. In the low transverse momentum region (i.e. for pT <2 GeV/c), it is seen that the experimental points for
charged pions at the LHC are systematically above the rel-evant values at RHIC, albeit not significantly. On the other hand, the data points for protons indicate clear and signif-icant differences. In particular, the green squares that rep-resent the results at the LHC exhibit lowerv2 at a fixed
)
c
(GeV/ T
p
0 0.5 1 1.5 2 2.5 3
2
v
0 0.02 0.04 0.06 0.08 0.1
0.12 Centrality: 0-10%
= 2.76 TeV
NN
s Pb-Pb
± π
p p+
= 62.4 GeV
NN
s Au-Au
-π π+
p p
Figure 6. The comparison of the pT-differential v2 forπ±and p+p for the 10% most central Pb–Pb and Au-Au collisions at the LHC and RHIC, respectively. The LHC and RHIC points are extracted from [36] and [34, 35], respectively.
) c (GeV/
q
n /
T p
0 0.5 1 1.5
Fit p
)q
n
/2
v
) / (q
n
/2
v
(
0.8 1 1.2 1.4 1.6 1.8 2
ALICE
±
π K
) p p(
PHENIX
±
π
±
K ) p p(
10-20%
Figure 7.ThepT/nqdependence of the double ratio ofv2/nqfor π±, K and p+p relative to a fit tov2/n
qof p and p in Pb–Pb and Au–Au collisions at √sNN =2.76 TeV [36] and 200 GeV [47], respectively.
value of pT than the solid (protons) and dashed
(antipro-tons) green lines measured at RHIC. This is in agreement with the larger value of radial flow that is measured at √
sNN =2.76 TeV as compared to the energy ranges that RHIC covers [44].
At the intermediate transverse momentum range, to quantify and compare the deviations in the NCQ scaling between LHC and RHIC, one can calculate the double ra-tio ofv2/nq forπ±, K and p+p relative to a fit tov2/nqof p and p for both the LHC and RHIC energies. This double ratio is then plotted as a function ofpT/nqfor the 10-20% centrality interval for both Pb–Pb and Au–Au collisions at √
momen-) c (GeV/ T
p
0 2 4 6 8 10 12 14 16
2
v
0.1 0.2
0.3 h++h- (10-50%)
(10-50%)
-π
+
+
π
(10-50%) p p+ ALICE
=2.76 TeV
NN
s Pb-Pb
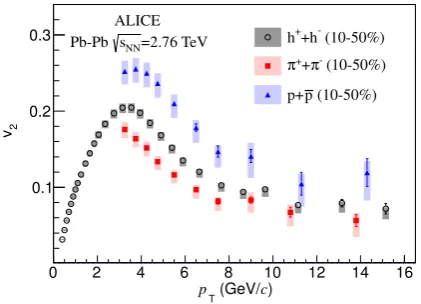
Figure 8.The transverse momentum dependence ofv2of uniden-tified charged particles, charged pions and protons for the 10-50% centrality interval, reported in Pb–Pb collisions at √sNN = 2.76 TeV. The data points are extracted from [49]
tum are qualitatively but also quantitatively similar at the two energy regimes. Finally, it is interesting to note that there are differences in thepT/nqevolution of this double ratio forπ±and K between ALICE [36] and PHENIX [47].
2.5 Fragmentation region
At high values of transverse momentum (i.e. for pT >
8 GeV/c), azimuthal anisotropy is introduced by the ge-ometry of the system in conjunction with energetic par-tons traversing along either the short (i.e. in-plane) or the long axis (i.e. out-of-plane) of the fireball. Partons moving in-plane traverse a smaller path in the medium than when moving out-of-plane and thus have smaller probability to be absorbed or have their energy attenuated. The mea-surement ofv2 can thus be used to probe the path length
dependence of energy loss.
Figure 8 presents the transverse momentum depen-dence of v2 in the 10-50% centrality interval in Pb–Pb
collisions at √sNN = 2.76 TeV for charged particles (black markers), identified pions (red markers) and pro-tons (blue markers). For 3 < pT < 8 GeV/cthe values
of v2 decrease dramatically. In this transverse
momen-tum range the markers representing the results for charged hadrons lie between the points for protons and pions. For pT>8 GeV/cthe decrease seems not to be significant. In
addition, forpT>10 GeV/cit is seen that there is no
sig-nificant difference inv2 for pions and protons within the
reported uncertainties. This is in agreement with observa-tions of no significant particle species dependence of the nuclear modification factor, as reported in [49].
3 Azimuthal anisotropy at high
μ
BBy lowering the center-of-mass energy it is expected that the system will spend less time in the partonic stage. In addition, if the energy is low enough, the system might not even form a deconfined phase. Indications about this transition to a phase where the hadronic over the partonic
stage becomes progressively dominant can be provided by studying whether the main features of v2 measurements
(e.g. mass ordering, NCQ scaling) observed at low values ofμBare also present at lower energies. The Beam Energy
Scan (BES) is performed by recording Au–Au collisions at √sNN = 62.4, 39, 27, 19.5, 11.5 and 7.7 GeV, thus mapping the QCD phase diagram at relatively high values ofμB. Currently, BES is one of the priorities of the heavy–
ion physics program at RHIC.
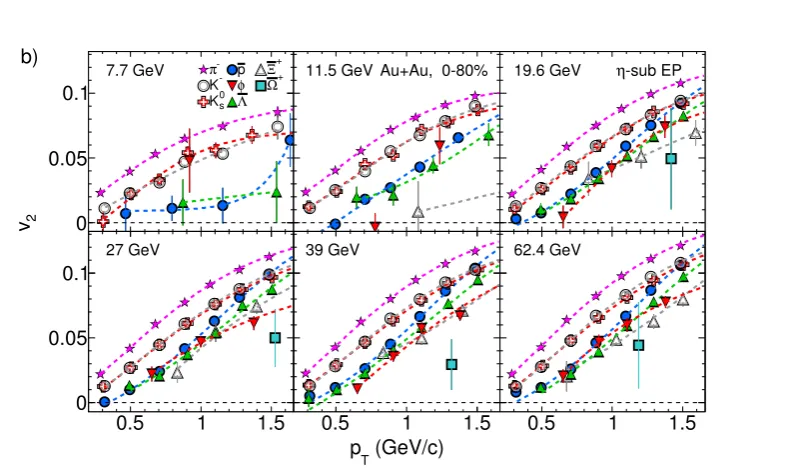
Figure 9 presents the transverse momentum depen-dence ofv2for particles at different energies for the 80%
most central Au-Au collisions [34, 35]. It is seen that particles are ordered according to their mass for all en-ergies in agreement with hydrodynamical calculations. It is interesting to note that the spread of the data points for a fixed value of pT decreases with decreasing energy.
This observation could be related to a decreased contri-bution from radial flow with decreasing energy. Among all particles, theφ-meson seems to behave differently, i.e. by not following the mass ordering trend, starting from √
sNN = 39 GeV. Considering the small hadronic cross-section that this particle is believed to have, this observa-tion could be attributed to a progressively more dominant role of the hadronic over the partonic stage with decreas-ing beam energy.
Figure 10 presents the similar picture as in fig. 9 but this time for antiparticles. Also in this case, the mass or-dering at this low transverse momentum range is visible. However, contrary to the picture that emerged for parti-cles, the spread of the data points ofv2for a givenpTdoes
not decrease with decreasing energy.
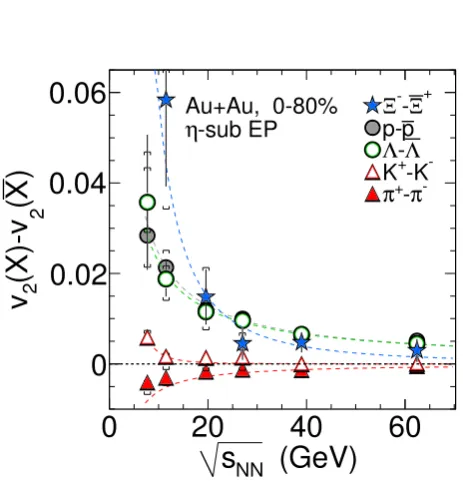
The comparison of v2 values for both particles and
antiparticles reveal an interesting, significant quantitative difference. This is illustrated in fig. 11 that presents the pTindependent difference ofv2between particles and
an-tiparticles as a function of center-of-mass energy. With the exception of pions where the effect is reversed, all other particles exhibit largerv2 values as compared to the
cor-responding antiparticles. These differences become larger with decreasing energy. Contributions to this evident en-ergy dependence ofv2(X)−v2(X) can originate from the
in-creasing baryon stopping at mid-rapidity with dein-creasing energy. However, currently it is not clear whether these ef-fects can quantitatively describe the observed differences. Further theoretical calculations can shed light to the origin of this interesting effect that emerges at high values ofμB.
4 Summary and outlook
The studies of anisotropic flow continue to play an impor-tant role in improving our understanding of the behavior of matter created in a collision of heavy ions. In these pro-ceedings results from measurements of the second Fourier coefficient v2 for identified particles from two regions of
the QCD phase diagram were discussed.
At low values of baryochemical potentialμB, the
0 0.05 0.1
2
v
a)
7.7 GeV π++
K
s 0
K p φ Λ
-Ξ
-Ω 11.5 GeV Au+Au, 0-80% 19.6 GeV η-sub EP
0.5 1 1.5
0 0.05 0.1
27 GeV
(GeV/c) T
p
0.5 1 1.5
39 GeV
0.5 1 1.5
62.4 GeV
Figure 9. The transverse momentum dependence ofv2 in the 0–80% central Au+Au collisions at √sNN = 62.4 GeV for different particles. Each plot corresponds to a different energy, recorded during the BES at RHIC. The data points are extracted from [34, 35].
0 0.05 0.1
2
v
b)
7.7 GeV π-
-K
s 0
K p φ Λ
+
Ξ+
Ω 11.5 GeV Au+Au, 0-80% 19.6 GeV η-sub EP
0.5 1 1.5
0 0.05 0.1
27 GeV
(GeV/c) T
p
0.5 1 1.5
39 GeV
0.5 1 1.5
62.4 GeV
Figure 10. The transverse momentum dependence ofv2 in the 0–80% central Au+Au collisions at √sNN =62.4 GeV for different antiparticles. Each plot corresponds to a different energy, recorded during the BES at RHIC. The data points are extracted from [34, 35].
RHIC and LHC, that originates from the interplay between radial and elliptic flow. The comparison with hydrody-namical calculations coupled to a hadron cascade model (i.e. VISHNU) revealed interesting features. According to VISHNU, radial and elliptic flow develops during the hadronic stage in a quark flavor dependent way, inducing a breaking of mass ordering. This breaking is not supported by the ALICE measurements. For 2< pT <6 GeV/cthe
number of constituent quark scaling at the LHC seems to
(GeV)
NNs
0
20
40
60
)
X(
2(X)-v
2v
0
0.02
0.04
0.06
Au+Au, 0-80%
-sub EP
η
+
Ξ
-Ξ
p
p-Λ
-Λ
--K
+K
-π
-+π
Figure 11.The difference inv2between particles and their cor-responding anti-particles, depicted asv2(X)−v2(X)) as a function of √sNN for 0–80% central Au+Au collisions. The data points are extracted from [34, 35].
v2, at least for central events. ForpT <10 GeV/c, where
one can probe the path length dependence of energy loss, non-zerov2 values are reported that exhibit no significant
particle species dependence.
At the beam energy scan program of RHIC, by in-creasing the values ofμB, one can reach conditions where
the hadronic over the partonic degrees of freedom become dominant. Although for both particles and antiparticles a mass ordering is observed for all energies, the spread of v2at a fixed value of transverse momentum decreases with
decreasing energy for particles, while for antiparticles the changes (if any) are not significant. Also at these energy ranges, theφ-meson plays a key role in the development of the picture that emerges, since it violates the mass or-dering. This observation, coupled to the small hadronic cross-section that this particle is believed to have, could be indicative of the transition to a system where the hadronic stage becomes progressively dominant.
The study of different harmonics of anisotropic flow is expected to play a significant role during the second run of the LHC data-taking, starting in 2015, but also during the continuation of the beam energy scan at RHIC. They will allow not only to constrain further the value ofη/s and the initial conditions of heavy-ion collisions, but will also assist in establishing the role of the hadronic rescat-tering phase in the development of flow. Finally, with the extension of these studies in smaller systems using multi-particle techniques, one could try to answer whether we have already observed the onset of collective effects in high multiplicity pp [50], p–Pb [51–57] and d–Au [58] collisions and try to probe their hydrodynamical nature.
Acknowledgements
I am grateful to the people listed below for the stim-ulating discussions, the contributions to the figures and for improvement on the text: Frank Geerts, Paul Kuijer, Francesco Noferini, Carlos Perez, Jurgen Schukraft, Rai-mond Snellings, Sergei Voloshin, Hui Wang, Zhongbao Yin and You Zhou.
References
[1] S. Borsanyi, G. Endrodi, Z. Fodor, A. Jakovac, S. D. Katz, S. Krieg, C. Ratti and K. K. Szabo, JHEP 1011(2010) 077 [arXiv:1007.2580 [hep-lat]].
[2] T. Bhattacharya, M. I. Buchoff, N. H. Christ, H. -T. Ding, R. Gupta, C. Jung, F. Karsch and Z. Linet al., arXiv:1402.5175 [hep-lat].
[3] S. Chatrchyanet al.[CMS Collaboration], Phys. Rev. Lett.109(2012) 152303 [arXiv:1205.2488 [nucl-ex]]. [4] I. Arsene et al. [BRAHMS Collaboration], Nucl.
Phys. A757(2005) 1 [nucl-ex/0410020].
[5] K. Adcoxet al.[PHENIX Collaboration], Nucl. Phys. A757(2005) 184, nucl-ex/0410003.
[6] B. B. Back et al. [PHOBOS Collaboration], Nucl. Phys.A757(2005) 28, nucl-ex/0410022.
[7] J. Adams et al. [STAR Collaboration], Nucl. Phys. A757(2005) 102, nucl-ex/0501009.
[8] P. Kovtun, D. T. Son and A. O. Starinets, Phys. Rev. Lett.94(2005) 111601 [hep-th/0405231].
[9] K. Aamodtet al.[ALICE Collaboration], Phys. Rev. Lett.105(2010) 252302 [arXiv:1011.3914 [nucl-ex]]. [10] G. Aadet al.[ATLAS Collaboration], Phys. Rev. C
86(2012) 014907 [arXiv:1203.3087 [hep-ex]]. [11] S. Chatrchyanet al.[CMS Collaboration], Phys. Rev.
C87(2013) 014902 [arXiv:1204.1409 [nucl-ex]]. [12] K. Aamodtet al.[ALICE Collaboration], Phys. Rev.
Lett.107(2011) 032301 [arXiv:1105.3865 [nucl-ex]]. [13] G. Aad et al. [ATLAS Collaboration], JHEP 1311
(2013) 183 [arXiv:1305.2942 [hep-ex]].
[14] S. Chatrchyanet al.[CMS Collaboration], Phys. Rev. C89(2014) 044906 [arXiv:1310.8651 [nucl-ex]]. [15] R. S. Bhalerao and J. -Y. Ollitrault, Phys. Lett. B641
(2006) 260 [nucl-th/0607009].
[16] B. Alver, B. B. Back, M. D. Baker, M. Ballintijn, D. S. Barton, R. R. Betts, R. Bindel and W. Buszaet al., Phys. Rev. C77(2008) 014906 [arXiv:0711.3724 [nucl-ex]].
[17] J. -Y. Ollitrault, A. M. Poskanzer and S. A. Voloshin, Phys. Rev. C 80 (2009) 014904 [arXiv:0904.2315 [nucl-ex]].
[18] B. Alver and G. Roland, Phys. Rev. C 81 (2010) 054905 [Erratum-ibid. C 82 (2010) 039903] [arXiv:1003.0194 [nucl-th]].
[19] Z. Qiu and U. W. Heinz, Phys. Rev. C 84 (2011) 024911 [arXiv:1104.0650 [nucl-th]].
[21] A. M. Poskanzer and S. A. Voloshin, Phys. Rev. C 58, 1671 (1998) [nucl-ex/9805001].
[22] B. Abelevet al.[STAR Collaboration], Phys. Rev. C 75(2007) 054906 [nucl-ex/0701010].
[23] S. S. Adler et al. [PHENIX Collaboration], Phys. Rev. Lett.91(2003) 182301 [nucl-ex/0305013]. [24] A. Adareet al.[PHENIX Collaboration], Phys. Rev.
Lett.98(2007) 162301 [nucl-ex/0608033].
[25] S. A. Voloshin, Nucl. Phys. A715, 379 (2003) [nucl-ex/0210014].
[26] D. Molnar and S. A. Voloshin, Phys. Rev. Lett. 91 (2003) 092301 [nucl-th/0302014].
[27] V. Greco, C. M. Ko and P. Levai, Phys. Rev. C 68 (2003) 034904 [nucl-th/0305024].
[28] R. J. Fries, B. Muller, C. Nonaka and S. A. Bass, Phys. Rev. C68(2003) 044902 [nucl-th/0306027]. [29] R. C. Hwa and C. B. Yang, Phys. Rev. C70(2004)
024904 [hep-ph/0312271].
[30] M. Gyulassy and M. Plumer, Phys. Lett. B243, 432 (1990).
[31] X. N. Wang and M. Gyulassy, Phys. Rev. Lett.68, 1480 (1992).
[32] R. J. M. Snellings, A. M. Poskanzer and S. A. Voloshin, arXiv:nucl-ex/9904003.
[33] X. N. Wang, Phys. Rev. C63, 054902 (2001). [34] L. Adamczyk et al. [STAR Collaboration], Phys.
Rev. Lett.110(2013) 142301 [arXiv:1301.2347 [nucl-ex]].
[35] L. Adamczyk et al. [STAR Collaboration], Phys. Rev. C88(2013) 014902 [arXiv:1301.2348 [nucl-ex]]. [36] B. B. Abelev et al. [ALICE Collaboration],
arXiv:1405.4632 [nucl-ex].
[37] H. Song and U. W. Heinz, Phys. Lett. B658(2008) 279 [arXiv:0709.0742 [nucl-th]].
[38] H. Song and U. W. Heinz, Phys. Rev. C 77(2008) 064901 [arXiv:0712.3715 [nucl-th]].
[39] H. Song and U. W. Heinz, Phys. Rev. C 78(2008) 024902 [arXiv:0805.1756 [nucl-th]].
[40] H. Song, S. A. Bass, U. Heinz, T. Hirano and C. Shen, Phys. Rev. Lett.106(2011) 192301
[Erratum-ibid.109(2012) 139904] [arXiv:1011.2783 [nucl-th]]. [41] H. Song, S. A. Bass, U. Heinz, T. Hirano and
C. Shen, Phys. Rev. C83(2011) 054910 [Erratum-ibid. C86(2012) 059903] [arXiv:1101.4638 [nucl-th]]. [42] H. Song, S. Bass and U. W. Heinz, arXiv:1311.0157
[nucl-th].
[43] C. Shen, U. Heinz, P. Huovinen and H. Song, Phys. Rev. C84(2011) 044903 [arXiv:1105.3226 [nucl-th]]. [44] B. Abelevet al.[ALICE Collaboration], Phys. Rev.
C88(2013) 4, 044910 [arXiv:1303.0737 [hep-ex]]. [45] C. Adleret al.[STAR Collaboration], Phys. Rev. C
66(2002) 034904 [nucl-ex/0206001].
[46] S. Voloshin, A. M. Poskanzer, and R. Snellings, in Relativistic Heavy Ion Physics, Landolt-Bornstein Vol. 1 (Springer-Verlag, Berlin, 2010), pp. 5-54.
[47] A. Adareet al.[PHENIX Collaboration], Phys. Rev. C85(2012) 064914 [arXiv:1203.2644 [nucl-ex]]. [48] A. Shor, Phys. Rev. Lett.54(1985) 1122.
[49] B. B. Abelev et al. [ALICE Collaboration], Phys. Lett. B736(2014) 196 [arXiv:1401.1250 [nucl-ex]]. [50] V. Khachatryan et al. [CMS Collaboration], JHEP
1009(2010) 091 [arXiv:1009.4122 [hep-ex]].
[51] S. Chatrchyan et al. [CMS Collaboration], Phys. Lett. B718(2013) 795 [arXiv:1210.5482 [nucl-ex]]. [52] B. Abelevet al.[ALICE Collaboration], Phys. Lett.
B719(2013) 29 [arXiv:1212.2001 [nucl-ex]].
[53] G. Aad et al. [ATLAS Collaboration], Phys. Rev. Lett. 110 (2013) 18, 182302 [arXiv:1212.5198 [hep-ex]].
[54] B. B. Abelev et al. [ALICE Collaboration], Phys. Lett. B726(2013) 164 [arXiv:1307.3237 [nucl-ex]]. [55] B. B. Abelev et al. [ALICE Collaboration], Phys.
Rev. C90 (2014) 5, 054901 [arXiv:1406.2474 [nucl-ex]].
[56] G. Aadet al.[ATLAS Collaboration], Phys. Lett. B 725(2013) 60 [arXiv:1303.2084 [hep-ex]].
[57] G. Aad et al. [ATLAS Collaboration], arXiv:1409.1792 [hep-ex].

![Figure 3.Comparison between calculations from VISHNU(solid lines) [37–39] and VISH2+1 (dashed lines) [43] for the 10-20% centrality interval of Pb–Pb collisions at √sNN = 2.76 TeV.The results for π±, p + p, φ, and K±, Λ+Λ and Ξ−+Ξ+ are pre-sented in the upper and lower plot, respectively.](https://thumb-us.123doks.com/thumbv2/123dok_us/8181769.1366408/3.595.313.539.76.426/figure-comparison-calculations-centrality-interval-collisions-results-respectively.webp)

![Figure 6. The comparison of thepLHC and RHIC, respectively. The LHC and RHIC points are pT-differential v2 for π± and+p for the 10% most central Pb–Pb and Au-Au collisions at theextracted from [36] and [34, 35], respectively.](https://thumb-us.123doks.com/thumbv2/123dok_us/8181769.1366408/5.595.317.539.76.239/figure-comparison-respectively-dierential-central-collisions-theextracted-respectively.webp)