Structural, Morphological and Electrical
Properties of NiO –GDC20 Nano composite
Anode for SOFC
M.Narsimha Reddy1, P.Vijaya Bhaskar Rao2, R.K.Sharma3, S. Rajkumar4
Asst. Professor, Department of Physics, Gurunanak Group of Institutions Technical campus, JNTU Hyderabad,
Telangana, India1
Professor, Department of Physics, College of Natural and Computational Science, Wollega University, Nekemte,
Ethiopia2
Asst. Professor, Department of Physics, Visvesvaraya College of Engineering and Technology, JNTU Hyderabad,
Telangana, India3
Research scholar, Department of Physics, National Institute of Technology, Warangal, Telangana, India4
ABSTRACT:In the present work, Nano Composite Anodeswere synthesized as X (NiO) +1-X (Ce0.8Gd0.2O2-δ)
where(X = 30& 40 wt. %) for low temperature operating solid oxide fuel cells (SOFC). The NiO synthesized by sol-gel citrate method and Thermal analysis of TG/DTG carried out up to 800 oC of the dried precursor of NiO and also calcined from 600 oC to750 oC. For anode materials, NiO and GDC20 nano powders were mechanically mixed and pelletized, sampleswere sintered at 1300oC . Systematic study of structure, purity, phase and structural parameters of as-synthesized NiO and anode samples were carried out by XRD and SEM. The A.C conductivity and their activation energies of the Anode sample (compositions X = 30& 40 wt.%)were computed from RT to 500 oC with the impedance data and the conductivities are found 1.30x10⁻³ S/cm and 2.53 x10⁻³ S/cmrespectively at 500 oC (frequency 1.33MHz) .The activation energies of A.C conductivity have observed that decrease with increase in frequencies.
KEYWORDS:SOFC, Nano composite anode, A.C conductivity, Activation energy, Sol-gel.
I. INTRODUCTION
Solid oxide fuel cells (SOFC) are energy conversion devices that directly convert chemical fuel to electrical energy via an electro chemical reaction [1]. The anodic supported SOFC’s are best candidate to operate at Low or Intermediate temperatures(LT/IT) i.e. from 773 oK to 973oK, consequently improve the performance, reliability, and long operational life[1-2]. The anode performance is depending on its composition and the resulting microstructure; hence it has great interest to investigate the proper composition of anode material [3].
For an anodic supported SOFC, anode must have the high electronic and ionic conductivity, catalytic activity for fuel oxidation, proper porosity at the microstructure in reduced environment at operating temperature [3-6]. In NiO–GDC (or CeO2) composite anode material, NiO acts as the best catalyst for oxygen activation and provides good electronic conductivity. GDC, mainly act as a matrix to support the catalyst and prohibit the Ni metal from agglomeration under operating conditions and also they are an ideal match with GDC electrolyte at Operating temperatures [4]. In the present study, NiO nano powders were prepared by sol-gel citrate method. NiO and Ce0.8Gd0.2 O2-δ (GDC 20) nano
The requirement of anode of SOFC is that, it should be electronically as well as ionically conducting. The cermet conductivity arises through two mechanisms that is ionic (through the GDC phase) and electronic (through the metal nickel Phase) [7].
II. EXPERIMENTAL
In the present work, NiO nano powder prepared by sol-gel citrate method. In NiO synthesis, nickel nitrate Ni(NO3)3.6H2O (purity: 99.8%) and Citric acid were taken in suitable molar ratio . Nickel nitrate acts as an oxidiser and
citric acid acts as a fuel to enable combustion reaction.
The Thermal gravimetric analysis (TGA) carried out on a Q50 TGA Termogravimetric Analyser, TA Instrument for the dried NiO gel-Precursor in the combustion route, Sample heated from 20°C to 800°C at the rate of 10°C/min and Values of Tmax were obtained from derivative (wt %/°C)vstemperature (°C), while Tonset values (initial and end
temperatures) were obtained from wt % vs. temperature (°C) is shown in Fig.1
The anode composites prepared by mixing as X(NiO) +(1-X)Ce0.8Gd0.2O2-δ (where x = 30, 40 wt.%) of NiO and
GDC20nano powders of crystallite size 30 nm,40nm respectively calcined at 750 oC. The mixed powders were ground in agate mortar for 3hrs with adding acetone and ethyl alcohol for homogeneous mixing. The homogenized anode composite powders were calcined at 750oC for 4hrs and these composite powders were pressed into cylindrical pellets having 10mm-diameter and 2-3mm thickness using hydraulic press machine under pressure of 60Mpa.The pellets were sintered at 1300oC for 4 hrs. in air with heating rate of 5oC/min from RTto 8000C and from 8000C to1300oC heating rate of 2oC/min .
The crystal structure, lattice parameters and crystallite size of the NiOpowderand anode samples A1 and A2 determined by means of X-ray diffraction (Phillips-3710 powder XRD) using CuKα1 radiation ( λ=1.5406Ao ) over the range 20-80o of 2θ with the scanning rate 2o/min. The relative densities of anode samples A1 and A2 are 91% and 94% respectively at sintering temperature 1300 oC calculated using Archimedes method.
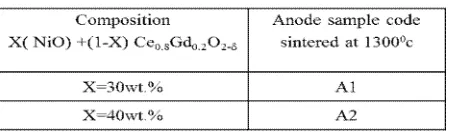
The surface morphology of the samples were studied by using SEM (ZEISS).Impedance spectroscopyisused characterizing the electrical properties ofthe samples such asAC conductivity, activation energies and impedance. Anode sample compositions code sintered at 13000C as shown in table (1)
III.EXPERIMENTAL RESULTS AND DISCUSSION
Thermal gravimetric analysis (TGA)shows the three steps of weight losses in fig.1, initial weight loss is in the temperature range between 30 and 1800C corresponds to the evaporation of the moisture and water molecules left in the gel and solvents in NiO, second set of weight loss is taking place between 200 to 3500C, it is related to the decomposition of nitrate compounds, there was a sudden mass loss at 4060C(Tmax )and an exothermic peak
corresponding to the mass loss is indicative of combustion reaction. This exothermic transition could be attributed to phase transition to NiO, after the combustion there is gain in mass as reflected in the TG pattern.
It may be noted that for taking right quantity of NiO that is single NiO Nano phase powder to get NiO-GDC20 anode composites are essential.As-synthesized NiO powder were ground in an agate mortar for 2 hours and calcined from6500C to7500C for 4 hrs and also calcined at different temperatures. The minimum calcination temperature is 7500C required for phase formation to increase the homogeneity of the powder as indicated in the XRD pattern.
The XRD patterns of the as synthesized NiO calcined powder are as shown in fig.2. The XRD pattern of NiO powders were compared indexed accordingly with the standard JCPDS file no 078-0643 for NiO .The composite GDC20 and NiO, XRD patterns were compared and indexed accordingly with JCPDS file no# 01-075-0162 for GDC20 and JCPDS file no.# 01-089-7130 for NiO shown in Fig.3.The X-ray diffraction patterns of NiO –GDC20 composites A1 and A2 in Fig.3 reveals the multiphase, GDC has fluorite structure (Fm-3m) and NiO also has cubic structure (Fm-3m group).
Peaks corresponding to NiO and metallic Ni phases are present in the XRD patterns of as –synthesized powder calcined at 6500C shown in Fig.2 (a). Initial Ni content in the as synthesized powder is converted to NiO powder leading to a mass gain in the TG-DTG graph.
Fig.1: TGA Pattern of gel precursor of NiO in Sol-Gel method
Fig.2: XRD’s of Calcined (a) NiO at 650
0
C (b) NiO at 750
0
From the XRD pattern of the calcined powder it is observed that only NiO peaks are present at 7500C. Therefore calcination at 7500C fully oxidises Ni particles that were present in the as-synthesized powder.
The avg. crystallite size calculated by Scherrer’s formula
= 0.9 − − − − (1)
WhereD is the crystallite size in nm,λis the radiation wavelength Cu Kα =0.15406nm, θ isdiffraction angle and β is the full width half maximum.
The avg. crystallite size of anode composites were calculated by using equation (1) and shown in Table 2. Lattice parameters of anode composites A1 to A2 slightly decreasing in NiO and GDC20.NiO content increasing in anode compositions, density of the samples increasing and decrease in lattice parameters has been observed from 1100 oC to 1300oC, since Ni atoms are smaller than the Gadolinium (Gd) and Cerium (Ce), it occupies interstitial positions of crystal structure. Average crystallite size of NiO has been increased more than the GDC20 with increasing sintering temperatures.
TABLE 2 : Lattice parameters & Crystallite size
IV.MORPHOLOGICALCHARACTERISTICS
The SEM micrograph of the anode samples A1, A2 shown in Fig.4. With an increasing percentage of NiO in anode compositions, grains are spherical and no agglomeration at sintering temperature 1300oC has been observed. EDAX reveals that no other elements except mixed elements in the anode compositions of A1and A2 as shown in Fig.4 (c).
The average grain sizes were directly estimated at higher magnification of SEM image (25000X) of anodes A1 and A2 are 172.6nm, 185.8nm respectively. SEM of all Nano composites shows that well connected, the two phases NiO-GDC are uniformly distributed and well connected, which is desirable for anodic reactions and electronic conduction.
Sample Lattice Parameters(Ao) Crystallite Size(nm) NiO GDC20 NiO GDC20
A1
A2
4.175 5.408 89.72 75.20
V. A.CCONDUCTIVITY
The values of AC conductivity obtained basically from complex data. The real part of the conductivity ( , ) is a function of frequency and temperature. The variation of real part of a.c conductivity( , ) with the 0K is shown in fig.5 at different frequencies. The nature of variation shows almost linear over wide range temperatures obeys the Arrhenius relation ship
,
= σ0 exp ( ) --- (2)
Where is the activation energy of conduction
The conductivities of samples A1 and A2 are obtained 1.30x10⁻³ S/cm and 2.53 x10⁻³ S/cmrespectively at 500 oC (frequency 1.33MHz).
(
a
)
(b)
(c)
Fig.5: Arrhenius plots of A.C conductivity ( a) A1 (x=30 wt.%) (b) A2 (x=40wt.%)
The activation energies (Ea)were estimated using Arrhenius plots by linear fitting from 10 Hz to 5MHz frequencies at
temperature above 3200C (which may be the intrinsic region) and the values are tabulated in table 3. At lower temperatures, the complexes formed are immobile ions and doesn’t contribute much to the conductivity. As the temperature increases, impurity-defect complexes start to dissociate there by contributing to conductivity.
The activation energy for total conduction of samples comes from three sources that is the enthalpy of migration of
oxygen ions (ΔHm),the association enthalpy of complex defects( ΔHa ) and the activation energy for the grain boundary
conduction . But in the low temperature range ( <4000c) these three sources simultaneously limit the total conductivity. With increasing temperature, the grain boundary effect and the association enthalpy of complex defects gradually disappears, as a result only the enthalpy of migration of oxygen ions (ΔHm)plays a major role in limiting the total ionic
conductivity and thus the activation energy at higher temperatures could be smaller.
For low NiO content, NiO is distinctly distributed throughout the composite and NiO, GDC connectivity is poor. Hence ionic conductivity is dominated over the electronic, but the activation energy less than 1eV implies that NiO contributed to the electronic conductivity, for further NiO additions, NiO and GDC are homogeneously distributed thereby forming three dimensional connectivity and the activation energies are decreased with increase in frequency.
A convenient formalism to investigate the frequency behaviour of conductivity in a variety of materials is based on the power relation proposed by Jonscher given by [8].
σT(ω) = σ(0) + AωS ---(3)
Where σT is the total conductivity, σ (0) the frequency independent conductivity, A is the temperature dependent
pre-factor and “s” is the frequency exponent, its value is between 0and 1 and the exponent “s” relates to the correlation of charges.
The power law dependence of ac conductivity corresponds to the short range hopping of charges through sites separated by energy barriers of different heights. In the low frequency region the conductivity increases strongly with frequency indicating that the transport phenomenon is dominated by contributions from hopping clusters. But in the high frequency region the conductivity is almost constant and here the transport take place on percolated paths.
The variation of σ as a function frequency is very much significant at lower temperatures when compared with the
results at higher temperature. This indicates the presence of space charge in the material that vanishes at higher temperatures and frequencies.
At higher frequency conductivity increases as a function of frequency with exponent “s”. From the graph it is found that the value of “s” is obtained by the slope of the variation of with frequency at different temperatures from 400C to 5000C is a function of temperature. The value of “s” is decreasing with increasing temperatures in both anode samples A1 and A2. with increase NiO in the anode cermet s value is also decreasing .The exponent “s” has been found to be 0.36 in region II (> 100khz) of anode sample A1 and 0.25 in anode sampleA2 . The smaller value of s indicates the presence of highly charged defects contributing to the hopping conductivity. This also indicates that the conduction process is a thermally activated process.
VI.CONCLUSIONS
NiO Nano powdersynthesized using sol-gel method and from TGA and XRD patterns found the NiO calcination temperature. Studied the structural, microstructure, electrical properties with respect to variation of NiO Wt.% for anode samples of NiO-GDC20 sintered at 13000C. The SEM with EDAX confirms the green composites of NiO – GDC20. The conductivities of samples A1 and A2 are obtained 1.30x10⁻³S/cm and 2.53 x10⁻³ S/cmrespectively at 500oC and activation energies of anode A1 and A2 are 0.85 and 0.68 eV at 5MHz .
At higher frequency conductivity increases as a function of frequency with exponent “s”. The value of “s” is decreasing with increasing temperatures and NiO Wt.% in anode samples A1 and A2 , indicating that the presence of highly charged defects contributing to the hopping conductivity.
VII. ACKNOWLEDGMENTS
The authors are thankful to the Department of Physics O.U and IICT Hyderabad and Department of Metallurgical Engineering and Material science, IIT Bombay for providing experimental support.
REFERENCES
[1] B.C.H Steele, Solid State Ionics 129(2000)95.
[2] A.U.Chavan,et.al,Effect of variation of NiOon properties of NiO/GDC Nanocomposite, ceremic.Int.(2012), doi:10.1016/j.ceramint.2011.12.023
[3] Shaow zha,William Rauch, Ni - Ce0.9Gd0.1O1.95 anode for GDC electrolyte based low temperature SOFCsSolid state Ionics 166(2004) 241-250.
[4] J.Chrstopher , M.P.Sridhar Kumar ,C.s Swamy Thermal studies on high temperature oxidation behavior of Ni containing Ab, type inter metallics Thermochemical Acta 161(1990)207-205.
[5] C. Ding H.linK.sato Improvement of electro chemical performance of anode supported SOFCs by NiO-Ce0.9Gd0.1O1.95 solid state Ionics
181(2010)1238-1243
[6] R.V Wandekar ,M.Ali, B.N. Wani, S.R Bharadwaj, Physiochemical studies of NiO-GDC composites, Material Chemistry and Physics 99(2006)289-294.
[7] H.A Taroco, J.A.F.santos.R.z.Domingues,T.Matencio, ceramic materials for solid oxide fuel cells ,advances inCeramics-synthesis and characterization, processing and specific applications (2011)423-446}.