LFC in hydro thermal System Using
Conventional and Fuzzy Logic Controller
Nitiksha Pancholi1, YashviParmar2, Priyanka Patel3, Unnati Mali4, Chand Thakor5
Lecturer, Department of Electrical Engineering, C.G.P.I.T, Bardoli, Gujarat, India1 Assistant Professor, Department of Electrical Engineering, C.G.P.I.T, Bardoli, Gujarat, India2 Assistant Professor, Department of Electrical Engineering, C.G.P.I.T, Bardoli, Gujarat, India3 Assistant Professor, Department of Electrical Engineering, C.G.P.I.T, Bardoli, Gujarat, India4 Assistant Professor, Department of Electrical Engineering, C.G.P.I.T, Bardoli, Gujarat, India5
ABSTRACT: In interconnected power system, small load perturbation in any of the area causes the fluctuation of the frequency of each and every area and also there is fluctuation of power in tie line. This paper deals with load frequency control of an interconnected hydrothermal system using conventional control (I, PI, PID) techniques and soft computing technique (FUZZY LOGIC) apply for LFC in three area power systems. In that hydro area is considered with electric governor and thermal area is considered with non-reheat and reheat turbine. System performance is examined considering 10% step load perturbation in non-reheat thermal plant area.
KEYWORDS: Fuzzy logic controller, Integral controller, Load frequency control (LFC), PI controller, PID controller.
I. INTRODUCTION
Interconnected power system consists of control areas which are connected to each other by tie lines. All the generators speed up and slow down together to maintain the frequency and power angles to scheduled values in static as well as dynamic conditions in a control area. Any sudden small load change in any of the interconnected areas causes the deviation of frequencies of all the areas and also of the tie line power.
In case of a hydro power plant, the power system frequency regulation can be affected due to water flow fluctuation.
This leads to imbalance between power generation and power demand and due to this frequency will deviate from its nominal value. Sometimes frequency deviations may cause under/over frequency relay operations and final disconnect some parts of system loads and generations. This paper present the LFC problems using conventional controllers and fuzzy logic controller in three area power system consist of non reheat thermal plant, reheat thermal plant and hydro plant.
II. LOAD FREQUENCY CONTROL
In India, Each region is generally interconnected. The transmission lines that connect an area to its neighboring area are called tie-lines. Power sharing between two areas occurs through these tie-lines. Load frequency control regulates the power flow between different areas while holding the frequency constant. Load frequency control (LFC) has mainly two objectives:
Hold the frequency constant (Δf = 0) against any load change.
export a pre-specified amount of power to area-2 while importing another pre-specified amount of power from area-3. So it is expected that to fulfill this requirement that area-1 absorbs its own load change, i.e. increase generation to supply extra load in the area or decrease generation when the load demand in the area has reduced. While doing this area-1 must be maintain its requirement to areas 2 and area-3 as far as importing and exporting power is concerned.
Single Area System:
Fig.1 shows block diagram of LFC after modeling all the models like speed governor, turbine and generator-load models.
Figure 1. Block diagram of LFC of single area power system
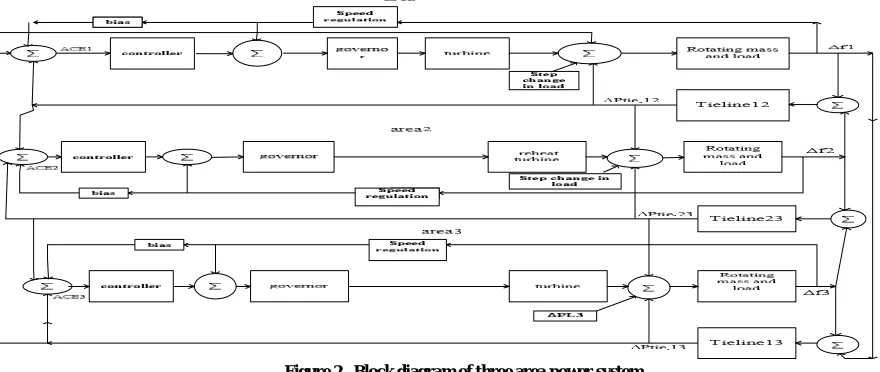
Three area interconnected power system:
Here three area power system consists of three single area systems (hydro, thermal and non reheat thermal plant), connected through a power line which is called as tie-line, is shown in the Figure 2. This tie-line sensed power and the resulting tie-line power signal is fed back into three areas. Symbol used with suffix 1 refer to area 1 with suffix 2 refer to area 2 and those with suffix 3 refer to area 3.
Figure 2. Block diagram of three area power system
Consider a load change ∆PDin area 1. In the steady state frequency will be constant and equal to the same value on both
areas.
So steady state frequency deviation,
∆f = ∆ ……….……… (1)
And tie line power deviation,
∆P = ∆ ( ) ……….……… (2)
ACE is defines as, a quantity that reflecting the deficiency or excess of power within a control area. So by controlling the ACE within the tolerance, the system automatically settles down. If ACE is zero, the dynamic parameters such as frequency deviation and tie line power deviation is also zero.
ACE = B ×∆f + ∆P ,……… (3)
PID controller:
The tuning of PID controller is used to improve the performance of the load frequency control of power system. So, a control law u = - K(s) ∆f, where K(s) has the form
K(s) = K 1 + + T s ……… (4)
In general, practically PID controller is implemented to reduce the noise effect. So, K(s) can be written for this case
K(s) = K 1 + + ………(5)
Where, N = filter constant
K(s) = K 1 + + T ………..(6)
Where, T= very small sampling rate.
KP , KI and KD are the proportional, integral and derivative controller gains respectively.
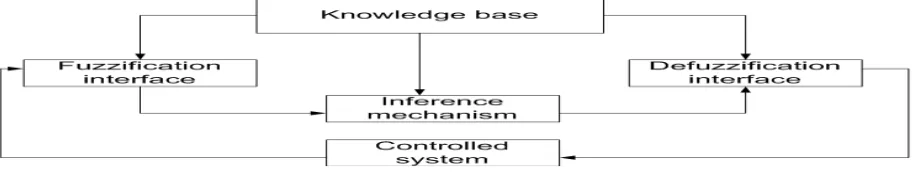
FUZZY logic controller:
The FLC involves fuzzification of input and output variables, formation of rule base, fuzzy interfacing and defuzzification. Figure 3 shows theDesign of fuzzy logic controller.
Figure 3. Design of fuzzy logic controller
output are having seven subsets, 49 rules are to be formed. The rules are formulated and given in Tab. I. The centre of gravity method is used for defuzzification.
Table. I : Fuzzy rules
Change in∆ ̇
ACE
NB NM NS Z PS PM PB
NB PS PS PS PB PS PS Z
NM PM PM PS PM PS NS NM
NS PS PM PS PS Z NS PM
Z PB PS PS Z NM NM NB
PS PB PS Z NS NM NM NM
PM PS Z NM NM NS NM NB
PM Z NM NM NS NM NS NM
III.SIMULATION AND RESULTS
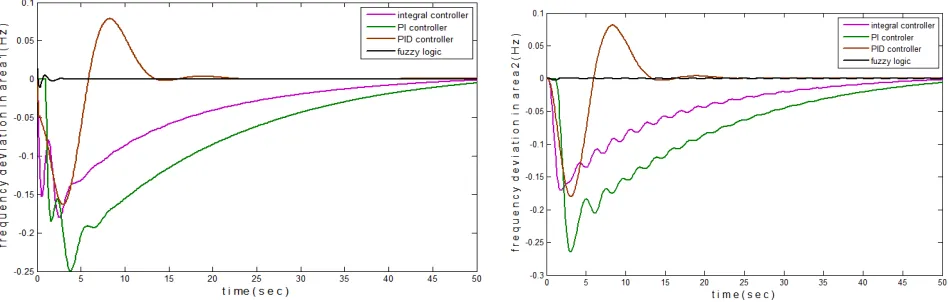
Figure 4-9 shows the comparison of integral, PI, PID and fuzzy logic controller for frequency deviation in three area
power system for 10% step load perturbation in area 1.
Figure 6. Waveform of frequency deviation in area 3Figure 7. Waveform of power deviation in tie line 12
Figure 8. Waveform of power deviation in tie line 23Figure 9. Waveform of power deviation in tie line 13
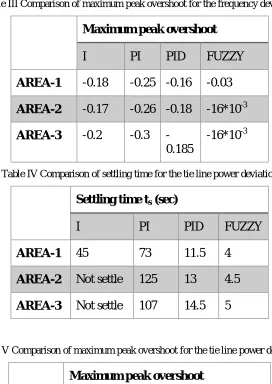
From the above responses of Figure 4-9 shows the comparison of I, PI, PID and FUZZY LOGIC Controller which gives the FUZZY LOGIC Controller less overshoot and settling time to other controllers.
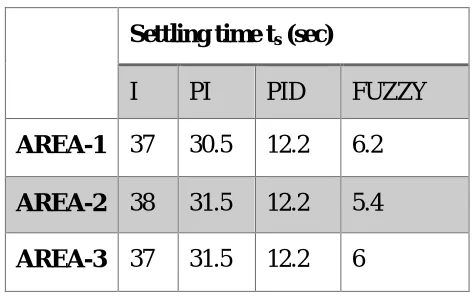
Table II Comparison of settling time for the frequency deviation
Settling time t
s(sec)
I
PI
PID
FUZZY
AREA-1
37
30.5
12.2
6.2
AREA-2
38
31.5
12.2
5.4
Table III Comparison of maximum peak overshoot for the frequency deviation
Maximum peak overshoot
I
PI
PID
FUZZY
AREA-1
-0.18
-0.25 -0.16
-0.03
AREA-2
-0.17
-0.26 -0.18
-16*10
-3AREA-3
-0.2
-0.3
-0.185
-16*10
-3Table IV Comparison of settling time for the tie line power deviation
Settling time t
s(sec)
I
PI
PID
FUZZY
AREA-1
45
73
11.5
4
AREA-2
Not settle
125
13
4.5
AREA-3
Not settle
107
14.5
5
Table V Comparison of maximum peak overshoot for the tie line power deviation
Maximum peak overshoot
I
PI
PID
FUZZY
AREA-1
-0.035
-0.048
-0.024
-0.0011
AREA-2
0.0125 0.018
0.011
-0.00014
IV. CONCLUSION
The simulation investigation has yielded the following conclusions:
Fuzzy logic controller minimizes the peak overshoot; reduce the settling time and steady state error of frequency deviation, tie line power deviation compared to conventional controllers.
FLC achieves the best controller efficiency for a single area power system. In multiple area applications, tie line power parameter is also optimized.
REFERENCES
[01] Ibraheem, Prabhat Kumar, and Dwarka P. Kothari, “Recent Philosophies of Automatic Generation Control Strategies in Power Systems,”
IEEE transection on power systems, vol.20, February 2005
[02] GhazanfarShahgholian, PegahShafaghi, HomayounMahdavi - Nasab, “A Comparative Analysis and Simulation of ALFC in Single Area
Power System for Different Turbines”, IEEE 2010.
[03] S.K.Soonee, S.R.Narasimhan, V.Pandey, “Significance of Unscheduled Interchange Mechanism in the Indian Electricity supply Industry”,
ICPSODR 2006.
[04] JirongLiu , “A Novel PID Tuning Method for Load Frequency Control of Power systems”, ICASID 2009,pp.437-442.
[05] K.P.SinghParmar, S.Majhi, D.P.Kothari, “Automatic Generation Control of an Interconnected Hydrothermal Power System”, IEEE 2010
[06] O. I. Elgerd and C. Fosha, “Optimum megawatt frequency control of multi-area electric energy systems,”IEEE Trans. Power App. Syst., vol.
PAS-89, no. 4, pp. 556–563, Apr. 1970.
[07] ShashiKant Pandey, Soumya R. Mohanty, NandKishor, “A literature survey on load–frequency control for conventional and distribution
generation power systems,” ELSEVIER Renewable and Sustainable Energy Reviews, vol.25, pp.318–334, 2013.
[08] V.Shanmugasundaram, Dr. T. Jayabarathi, ‘Load Frequency Control Using PID Tuned ANN Controller in Power System,” in IEEE
International Conference on Electrical Energy Systems, pp. 269-274, 2011