ISSN: 2319-8753
I
nternational
J
ournal of
I
nnovative
R
esearch in
S
cience,
E
ngineering and
T
echnology
(An ISO 3297: 2007 Certified Organization)
Vol. 3, Issue 9, September 2014
Application of Response Surface Methodology
in the Development of Barnyard Millet Bran
Incorporated Bread
Nazni. P
1, Gracia.J
21Associate professor, Department of Food Science and Nutrition, Periyar University, Salem, Tamilnadu, India,
2
Research scholar, Department of Food Science and Nutrition, Periyar University, Salem, Tamilnadu, India.
ABSTRACT: The barnyard millet is the fastest growing of all millet produces a crop in six weeks. The bran also known as miller’s bran is the hard outer layer of cereal grain. Bread is an important staple food in both developed and developing countries. Response Surface Methodology (RSM) was used to investigate the effects of Refined Wheat Flour (RWF) and Barnyard Millet Bran (BMB) on the bread. In this study, RSM was employed to optimize the ingredient formulation and processing parameters of BMB incorporated bread such as nutrient and sensory score responses. A rotatable central-composite design consisting of RWF and BMB, with 13 formulations for the nutrient and sensory score of the BMB incorporated bread. The result of the optimized acceptability of the BMB incorporated bread containing RWF 87.95g, BMB 7.06g, carbohydrate 93.36g, protein 9.75g, fat 7g, fiber 2.25 and overall acceptability of 6. Hence it is concluded that RSM was used successfully to optimize the level of RWF and BMB for the development of bread.
KEYWORDS: barnyard, optimize, response, nutrient, sensory.
1. INTRODUCTION
Millets are small seeded annual coarse cereals grown around the world [1, 2]. Millets have been food commodities since ancient times due to the important nutritional quality; there is a need to revive their usage in daily diet. Millets can substitute as a major cereal for better health benefits [3]. Millets and legumes form staple food for the population of low income groups in the worldwide [4, 5]. Barnyard is the fastest growing millet grown in India, Japan and China when the paddy fails and used as a substitute for rice. The length of the grain is 2-3 mm and 1-2 mm wide [6]. It is also called as Japanese barnyard millet [7]. In developing countries, millets are consumed by people from the low economic status [8]. The barnyard millet average yield is around 18-20 q/ha [9]. The barnyard millet is a nature’s gift for the modern mankind who is engaged in sedentary activities [10]. Millet bran is a byproduct of millet based food manufacturing [11].
Bread is an important staple food for several countries. Wheat flour is one of the most popular than other cereal grains for bread making [12]. The bread is a fast and convenient food based on wheat products of baked foods and is consumed worldwide [13]. The bread is an ideal product that can serve as a functional food daily used by a large population throughout the world [14]. Bread products are worldwide accepted because of the low cost, easily prepared, versatility, sensory attributes and nutritional properties [15].
ISSN: 2319-8753
I
nternational
J
ournal of
I
nnovative
R
esearch in
S
cience,
E
ngineering and
T
echnology
(An ISO 3297: 2007 Certified Organization)
Vol. 3, Issue 9, September 2014
optimization, RSM will reduce the number of trials and provide multiple regression approach. The optimized ingredients level achieved after the numerical and Graphical optimization for maximum colour, flavor and taste score [21].
The objective of the study is to develop an optimized formulation of the bread containing RWF and BMB using RSM and to determine optimal levels for the responses of BMB incorporated bread.
II. MATERIALS AND METHODS
The refined wheat flour, sugar, salt, yeast, butter and barnyard millet were purchased from the local market in Salem, Tamil Nadu, India. The barnyard millet was cleaned and the foreign particles were removed, shade dried and grinded manually, sieved and collected the bran. Then the Barnyard Millet Bran (BMB) was uniformly mixed and treated with 20% (w/w) solution of 1% calcium hydroxide and stored in sealed containers.
Preparation of bread
The ingredients such as RWF, BMB, sugar and salt were mixed for 1-2min. Then, yeast dissolved in 30ºC water, which is the optimum temperature for the yeast cells to be activated, and melted margarine was added to the dry ingredients. All the ingredients were again mixed for 2min and during mixing, water was added to the mixture. After mixing, the dough was kept for fermentation. After that, the dough was divided into 250 g pieces, placed in aluminium baking pan for proofed at an incubation chamber at 35◦C and 80% relative humidity for 30 min in order to maintain the proofing step, which is defined as the last fermentation. Then, the samples were ready for baking. Baking for each sample was conducted in a laboratory oven with air circulation at 210◦C for 40 min. The loaves were removed from the pans and cooled at room temperature
Nutritional analysis of bread
The samples were also evaluated for proximate compositions by using standard methods of analyses according to AOAC in terms of carbohydrate, protein, fat and fiber. All the measurements were carried out in triplicates and mean values were calculated [22, 23].
Quantitative descriptive analysis of bread
Sensory evaluation refers to the evaluation of recipes by sense organs. All the sense organs are used in the appraisal of food [24]. Organoleptic evaluation is generally the final guide to the quality of a food product from the consumer’s point of view [25]. Sensory evaluation on the produced bread was conducted among 10-trained panellists in the Department of Food Science, Periyar University, Salem, Tamilnadu. The trained panellists evaluated all samples and also served with a glass of water to neutralize the taste before analyzing the next sample. The bread were evaluated using 9-point hedonic scale (1= dislike extremely; 9= like extremely) for various characteristics such as appearance, colour, flavour, taste, texture and overall acceptability [26, 27, 28].
Experimental design and statistical analysis
Response surface methodology (RSM) was used to study the simultaneous effects of RWF and BMB addition on bread. In designing this experiment by response surface methodology (RSM), a central composite design was employed. Central composite design (CCD) was used to study the interaction of process variables by applying RSM [29]. The design matrix of CCD and also experimental results for the responses such as nutrient and sensory parameters of bread are shown in Table 1.
Table-1
Real and coded values of independent variables used for experimental design
Independent variables Coded value
-1 0 +1
Real value
Refined wheat flour 70 85 100
ISSN: 2319-8753
I
nternational
J
ournal of
I
nnovative
R
esearch in
S
cience,
E
ngineering and
T
echnology
(An ISO 3297: 2007 Certified Organization)
Vol. 3, Issue 9, September 2014
After preliminary baking tests, the upper and lower limits for these variables were established [30]. Two quantitative controllable factors (independent variables) were level of RWF (X1) and level of BMB (X2). The dependent variables
were selected as responses for representing the main parameters of bread quality: carbohydrate (Y1), protein (Y2), fat
(Y3), fiber (Y4), appearance (Y5), colour (Y6), flavour (Y7), taste (Y8), texture (Y9) and overall acceptability (Y10). After
preliminary experiment, the upper and lower limits for the independent variables were established. RWF levels were from 70-100g and BMB level from 5-30g.The experimental data for each response variable were fitted to the quadratic model.
Y= β+ X1 +X2 +X12 +X22 + X1X2 ... (1)
where, Y=responses; β=constant; X1, X2=linear regression; X1 2
, X2 2
=quadratic regression X1X2=interaction regression;
X1, X2= independent variables.
The adequacy of the model was evaluated by coefficient of determination, R2, F-value and model p-value at the 0.1 significance. The statistical analysis RSM for bread was performed by using Design Expert with (2000, V 6.0.8; Stat- Ease Inc., Minneapolis, MN, USA) software. Both the manipulated variables and responses were fitted to the quadratic model by performing the analysis of variance (ANOVA). The experimental results were analyzed to determine the lack of fit and the significance of the quadratic model and the effect of interaction between the manipulated variables and responses.
III. RESULTS AND DISCUSSION
Experimental design results and response surface analysis
Results of the experimental design to carbohydrate, protein, fat, fiber, appearance, colour, flavour, taste, texture and overall acceptability of the bread with different concentration RWF and BMB are shown in Table 2.
Table – 2
Experimental design and obtained results for nutrient and sensory properties of the BMB incorporated bread Run Manipulated
variables
Responses
X1 X2 Y1 Y2 Y3 Y4 Y5 Y6 Y7 Y8 Y9 Y10
S 100 0 98.75 11.02 6.97 0.3 8 8 7 7 8 8
V1 70 5 78.83 7.98 6.81 1.6 7 6 6 6 7 6
V2 100 5 101 11.28 7.08 1.69 7 7 7 7 7 7
V3 70 30 91.67 9.3 7.34 8.54 5 5 5 4 5 5
V4 100 30 113.84 12.6 7.61 8.63 5 5 5 4 5 5
V5 63.79 17.50 80.8 7.96 7.01 5.05 5 4 5 5 6 5
V6 106.2 17.50 112.15 12.62 7.39 5.18 6 5 5 5 6 6
V7 85 0.18 87.75 9.38 6.83 0.3 7 7 7 7 7 7
V8 85 35.18 105.37 27.87 7.58 10.01 5 5 4 4 5 4
V9 85 17.50 96.47 10.29 7.2 5.11 5 5 5 4 5 5
V10 85 17.50 96.47 10.29 7.2 5.11 5 5 4 5 5 5
V11 85 17.50 96.47 10.29 7.2 5.11 5 5 5 4 5 5
V12 85 17.50 96.47 10.29 7.2 5.11 6 5 5 5 5 6
V13 85 17.50 96.47 10.29 7.2 5.11 5 5 5 5 5 5
(X1) = Refined wheat flour, (X2) = barnyard millet bran
(Y1) = Carbohydrate, (Y2) = Protein, (Y3) = Fat, (Y4) = Fiber, (Y5) = Appearance,
(Y6) = Colour, (Y7) =Flavour, (Y8) = Taste, (Y9) = Texture, (Y10) = Overall acceptability
These responses ranged from 78.83 to 113.84g carbohydrate, 7.96 to 27.87g protein, 6.81g to 7.61 fat, 0.3 to 10.01gm fiber, 5 to 8 appearance, 4 to 8 colour, 4 to 7 flavour, 4 to 7 taste, 5 to 8 texture and 4 to 8 overall acceptability.
Regression coefficients for independent variables of the BMB incorporated bread
ISSN: 2319-8753
I
nternational
J
ournal of
I
nnovative
R
esearch in
S
cience,
E
ngineering and
T
echnology
(An ISO 3297: 2007 Certified Organization)
Vol. 3, Issue 9, September 2014
Table - 3
Regression coefficients for response variables of the BMB incorporated bread
Factor Regression Coefficient
Y1 Y2 Y3 Y4 Y5 Y6 Y7 Y8 Y9 Y10
Model 96.47 10.29 7.20 5.11 5.20 5.00 4.80 4.60 5.00 5.20
X1 11.08 1.65 0.13 0.045 0.18 0.30 0.12 0.12 0.00 0.30
X2 6.32 3.60 0.27 3.45 -0.85 -0.73 -0.91 -1.16 -0.85 -0.91
X1 2
-0.04 -1.04 1.87 -2.50 0.21 -0.12 0.23 0.20 0.50 0.21
X2 2
-6.25 3.13 4.37 0.02 0.46 0.63 0.48 0.45 0.50 0.21
X1X2 0.00 0.00 0.00 0.00 0.00 -0.25 -0.25 -0.25 0.00 -0.25
X1 and X2 =Linear, X12 and X22 = Interactive X1X2 = Interactive terms
Vatsala et al., [31] suggested that appearance, colour, flavour, taste, texture and overall acceptability are the main criteria to assess product quality. The nutrient and sensory analysis helps defining the product characteristics which are important with respect to acceptability.
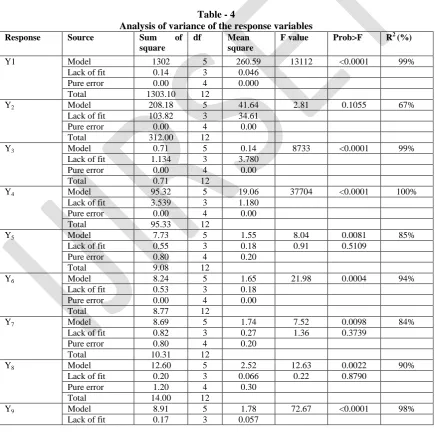
Table - 4
Analysis of variance of the response variables
Response Source Sum of
square
df Mean
square
F value Prob>F R2 (%)
Y1 Model 1302 5 260.59 13112 <0.0001 99% Lack of fit 0.14 3 0.046
Pure error 0.00 4 0.000 Total 1303.10 12
Y2 Model 208.18 5 41.64 2.81 0.1055 67%
Lack of fit 103.82 3 34.61 Pure error 0.00 4 0.00 Total 312.00 12
Y3 Model 0.71 5 0.14 8733 <0.0001 99%
Lack of fit 1.134 3 3.780 Pure error 0.00 4 0.00 Total 0.71 12
Y4 Model 95.32 5 19.06 37704 <0.0001 100%
Lack of fit 3.539 3 1.180 Pure error 0.00 4 0.00 Total 95.33 12
Y5 Model 7.73 5 1.55 8.04 0.0081 85%
Lack of fit 0.55 3 0.18 0.91 0.5109 Pure error 0.80 4 0.20
Total 9.08 12
Y6 Model 8.24 5 1.65 21.98 0.0004 94%
Lack of fit 0.53 3 0.18 Pure error 0.00 4 0.00 Total 8.77 12
Y7 Model 8.69 5 1.74 7.52 0.0098 84%
Lack of fit 0.82 3 0.27 1.36 0.3739 Pure error 0.80 4 0.20
Total 10.31 12
Y8 Model 12.60 5 2.52 12.63 0.0022 90%
Lack of fit 0.20 3 0.066 0.22 0.8790 Pure error 1.20 4 0.30
Total 14.00 12
Y9 Model 8.91 5 1.78 72.67 <0.0001 98%
ISSN: 2319-8753
I
nternational
J
ournal of
I
nnovative
R
esearch in
S
cience,
E
ngineering and
T
echnology
(An ISO 3297: 2007 Certified Organization)
Vol. 3, Issue 9, September 2014
Pure error 0.00 4 0.00 Total 9.08 12
Y10 Model 8.09 5 1.62 9.94 0.0044 88%
Lack of fit 0.34 3 0.11 0.57 0.6661 Pure error 0.80 4 0.20
Total 9.23 12
df- Degree of freedom
Analysis of variance for each response showed that a significant effect was found for nutrient content and sensory properties with regard to RWF and BMB. To establish predictive models for the bread properties from various level of the RWF and BMB the experimental data for each response variable shown in equation 1-10.
(Y1) Carbohydrate = 96.47+11.08X1+6.32X2-0.04X12-6.25X22+0.00X1X2 ……. (1)
(Y2) Protein = 10.29+1.65X1+3.60X2-1.04X1 2 +3.13X2 2 +0.00X1X2 ……. (2)
(Y3) Fat = 7.20+0.13X1+0.27X2+1.87X12+4.37X22+0.00X1X2 ……. (3)
(Y4) Fiber = 5.11+0.04X1+3.45X2-2.50X12+0.02X22+0.00X1X2 ……. (4)
(Y5) Appearance =5.20+0.18X1-0.85X2+0.21X12 +0.46X22+0.00X1X2 ……. (5)
(Y6) Colour =5.00+0.30X1-0.73X2-0.12X1 2 +0.63X2 2 -0.25X1X2 ……. (6)
(Y7) Flavour = 4.80+0.12X1-0.91X2+0.23X12+0.48X22-0.25X1X2 ……. (7)
(Y8) Taste = 4.60+0.12X1-1.16X2+0.20X12+0.45X22-0.25X1X2 ……. (8)
(Y9) Texture = 5.00+0.00X1-0.85X2+0.50X12+0.50X22+0.00X1X2 ……. (9)
(Y10) Overall acceptability = 5.20+0.30X1-0.91X2+0.21X1 2 +0.21X2 2 -0.25X1X2 …… (10)
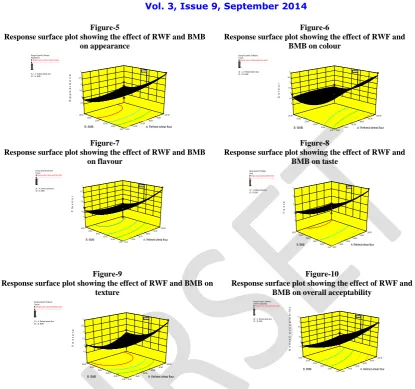
All the independent variables have positive effect of RWF whereas the BMB shows positive effect for nutrient content and negative effect in the sensory properties. The quadratic terms of RWF in carbohydrate, protein, fiber, colour and BMB in carbohydrate shows negative effect on the responses. The interactive terms of colour, flavour, taste and overall acceptability shows negative effect in RWF and BMB respectively. The sensory parameters such as appearance, flavour, taste and overall acceptability shows that the lack of fit is not significant.
Figure-1
Response surface plot showing the effect of RWF and BMB on carbohydrate
Design-Expert® Software Carbohydrate
Design points above predicted value
Design points below predicted value
113.84
78.83
X1 = A: Refined wheat flour X2 = B: BMB
70.00 76.00 82.00 88.00 94.00 100.00 5.00 10.00 15.00 20.00 25.00 30.00 70 80 90 100 110 120 C a r b o h y d r a t e
A: Refined wheat flour B: BMB
93.3643 93.3643
Figure-2
Response surface plot showing the effect of RWF and BMB on protein
Design-Expert® Software Protein
Design points above predicted value
Design points below predicted value
27.87
7.96
X1 = A: Refined wheat flour X2 = B: BMB
70.00 76.00 82.00 88.00 94.00 100.00 5.00 10.00 15.00 20.00 25.00 30.00 6 8 10 12 14 16 18 P r o t e i n
A: Refined wheat flour B: BMB
9.74806 9.74806
Figure-3
Response surface plot showing the effect of RWF and BMB on fat
Design-Expert® Software Fat
Design points above predicted value 7.61
6.81
X1 = A: Refined wheat flour X2 = B: BMB
70.00 76.00 82.00 88.00 94.00 100.00 5.00 10.00 15.00 20.00 25.00 30.00 6.8 7 7.2 7.4 7.6 7.8 F a t
A: Refined wheat flour B: BMB
7.00824 7.00824
Figure-4
Response surface plot showing the effect of RWF and BMB on fiber
Design-Expert® Software Fiber
Design points above predicted value
Design points below predicted value
10.01
0.3
X1 = A: Refined wheat flour X2 = B: BMB
70.00 76.00 82.00 88.00 94.00 100.00 5.00 10.00 15.00 20.00 25.00 30.00 0 2 4 6 8 10 F i b e r
A: Refined wheat flour B: BMB
ISSN: 2319-8753
I
nternational
J
ournal of
I
nnovative
R
esearch in
S
cience,
E
ngineering and
T
echnology
(An ISO 3297: 2007 Certified Organization)
Vol. 3, Issue 9, September 2014
Figure-5
Response surface plot showing the effect of RWF and BMB on appearance
Design-Expert® Software Appearance
Design points above predicted value
Design points below predicted value
7
5
X1 = A: Refined wheat flour X2 = B: BMB
70.00 76.00 82.00 88.00 94.00 100.00 5.00 10.00 15.00 20.00 25.00 30.00 4.5 5 5.5 6 6.5 7 A p p e a r a n c e
A: Refined wheat flour B: BMB
6.27806 6.27806
Figure-6
Response surface plot showing the effect of RWF and BMB on colour
Design-Expert® Software Colour
Design points above predicted value 7
4
X1 = A: Refined wheat flour X2 = B: BMB
70.00 76.00 82.00 88.00 94.00 100.00 5.00 10.00 15.00 20.00 25.00 30.00 4 4.5 5 5.5 6 6.5 7 C o lo u r
A: Refined wheat flour B: BMB
6.13951 6.13951
Figure-7
Response surface plot showing the effect of RWF and BMB on flavour
Design-Expert® Software Flavour
Design points above predicted value
Design points below predicted value
7
4 X1 = A: Refined wheat flour X2 = B: BMB
70.00 76.00 82.00 88.00 94.00 100.00 5.00 10.00 15.00 20.00 25.00 30.00 4 4.5 5 5.5 6 6.5 7 F l a v o u r
A: Refined wheat flour B: BMB
5.96132 5.96132
Figure-8
Response surface plot showing the effect of RWF and BMB on taste
Design-Expert® Software Taste
Design points above predicted value
Design points below predicted value
7
4
X1 = A: Refined wheat flour X2 = B: BMB
70.00 76.00 82.00 88.00 94.00 100.00 5.00 10.00 15.00 20.00 25.00 30.00 3 4 5 6 7 T a s t e
A: Refined wheat flour B: BMB
5.95167 5.95167
Figure-9
Response surface plot showing the effect of RWF and BMB on texture
Design-Expert® Software Texture
Design points above predicted value
Design points below predicted value
7
5
X1 = A: Refined wheat flour X2 = B: BMB
70.00 76.00 82.00 88.00 94.00 100.00 5.00 10.00 15.00 20.00 25.00 30.00 4.5 5 5.5 6 6.5 7 T e x t u r e
A: Refined wheat flour B: BMB
6.08057 6.08057
Figure-10
Response surface plot showing the effect of RWF and BMB on overall acceptability
Design-Expert® Software Overall acceptability
Design points above predicted value
Design points below predicted value
7
4 X1 = A: Refined wheat flour X2 = B: BMB
70.00 76.00 82.00 88.00 94.00 100.00 5.00 10.00 15.00 20.00 25.00 30.00 4.5 5 5.5 6 6.5 7 7.5 O v e r a l l a c c e p t a b il i t y
A: Refined wheat flour B: BMB
6.21256 6.21256
Process optimization through the desirability function
In Table 5, conditions of the optimization process to minimum carbohydrate, fat, maximize protein, fiber, appearance, colour, flavour, taste, texture and overall acceptability in the bread are displayed. The selection of bread quality attributes (responses) in the optimization process and their relative importance was based on the literature data and consumer preference [32].
Table - 5
Optimization process to BMB incorporated bread
Factors (F) and
Responses (R)
Goal Lower
limit
Upper limit
Importance Optimum
Refined wheat flour (F) Minimum 70 100 3 87.95g Barnyard millet bran (F) Maximum 5 30 3 7.06g Carbohydrate (R) Minimum 78.83 113.84 3 93.36g Protein (R) Maximum 7.96 27.87 3 9.75g Fat (R) Minimum 6.81 7.61 3 7.00g Fiber (R) Maximum 0.3 10.01 3 2.25g
Appearance (R) Maximum 5 7 3 6
Colour (R) Maximum 4 7 3 6
Flavour (R) Maximum 4 7 3 6
Taste (R) Maximum 4 7 3 6
Texture (R) Maximum 5 7 3 6
ISSN: 2319-8753
I
nternational
J
ournal of
I
nnovative
R
esearch in
S
cience,
E
ngineering and
T
echnology
(An ISO 3297: 2007 Certified Organization)
Vol. 3, Issue 9, September 2014
Optimization was performed on the basis of a multiple response method called desirability. By applying the desirability function, the best optimum concentrations were attained for RWF 87.95g and BMB 7.06g. The calculated desirability for the formulation was 0.41. At these concentrations minimum carbohydrate 93.36g, fat 7g, maximum protein 9.75g, fiber 2.25g and overall acceptability of 6. Thus considering the above mentioned approach, the objective was to maximize the responses for protein, fiber and sensory score.
IV. CONCLUSION
Response surface methodology was successfully applied to optimize RWF and BMB to improve the quality of bread seems to be justified. The two variables employed in the study had a great effect on the quality of bread. Up to a certain limit of RWF addition, the carbohydrate and fat decreases while the protein, fiber, appearance, colour, flavour, taste, texture and overall acceptability increased. Modeling of experimental data allowed the generation of useful equations for general use, to predict the behavior of the system under different factor combinations. The final result of optimization suggested that the optimal ingredient doses to achieve with 87.95g RWF and 7.06g BMB for the bread
REFERENCE
1. Karuppasamy.P, Malathi.D, Banumathi.P, Varadharaju.N and K. Seetharaman, 2013. “Evaluation of Quality Characteristics of Bread from Kodo, Little and Foxtail Millets”, International Journal of Food and Nutritional Sciences, vol 2, Issue 2, p35-39.
2. Kavita Kotagi, Bharati Chimmad, Rama Naik and M.Y. Kamatar, 2013. “Nutrient Enrichment of Little Millet (Panicum Miliare) Flakes with Garden Cress Seeds”, International Journal of Food and Nutritional Sciences, Vol.2, Iss.3, p36-39.
3. Surekha N, Rohini Devi and Ravikumar S Naik, 2013. “Development of Value Added Low Glycemic Index Barnyard Millet (Echinochloa
frumentacea Link) Noodles”, International Journal of Food and Nutritional Sciences, Vol.2, Iss.4, p20-25.
4. Naveena.N and K.Bhaskarachary, 2013. “Effects of Soaking And Germination of Total and Individual Polyphenols Content in The Commonly Consumed Millets and Legumes in India”, International Journal of Food and Nutritional Sciences, Vol.2, Iss.3,p12-19.
5. Pradeep .S.R., Malleshi, N.G and Guha.M, 2011. “Germinated Millets and Legumes as Source of Gamma - Aminobutyric Acid”. World Appl. Sci. J., 14(1), 108-113.
6. Gomez M, Ronda F, Blano C.A, Caballero P.A, “Apesteguia A., Effect of Dietary Fiber on Dough Rheology and Bread Quality”. European Food Res Technol, 216: 51-56, 2003.
7. Veena.S, Bharati V. Chimmad, Rama K. Naik and G. Shanthakumar, “Physico-Chemical and Nutritional Studies In Barnyard Millet”, Karnataka J. Agric. Sci., 18(1): 101-105, 2005.
8. Baker RD, “Millet Production”. Available on htpp://Lubbock.tamu. edu/ othercrops/docs /nmsumilletprod.htm [Accessed 20 Feburary, 2010], 2003.
9. Anonymous, “Annual Report of All India Coordinated Research Project”, ICAR, New Delhi, 2009.
10. Roopashree ugare, “Health Benefits, Storage Quality and Value Addition of Barnyard Millet (Echinochloa Frumentacaea link) In Partial Fulfillment of the Requirement for the Degree of Master of Home Science”, Food Science and Nutrition, Department of Food Science and Nutrition College of Rural Home Science, University of Agricultural Sciences, Dharwad, 2008.
11. Hemery Y, Rouau X, Lullien-Pellerin V, Barron C, Abecassis J, “Dry Processes to Develop Wheat Fractions and Products with Enhanced Nutritional Quality”. J. Cereal Sci., 46: 327–347, 2007.
12. Abdelghafor O.R.F, A.I. Mustafa, A.M.H. Ibrahim and P.G. Krishnan, “Quality of Bread from Composite Flour of Sorghum and Hard White Winter Wheat”, Advance Journal of Food Science and Technology, vol, 3, no. 1, pp.9-15, 2011.
13. Bakke and Vickers, “Bread Diets Containing Several Sources of Hulls or Bran”, Department of Food Science and Nutrition, College of Food Sciences and Agriculture King Saud University, P.O. Box 2460, Riyadh, 11451, Saudi Arabia . J Food Sic 48: 1151, 2007.
14. Sluimer P, “Principles of Bread Making: Functionality of Raw Materials and Process Steps”. American Association of Cereal Chemists, St. Paul, 2005.
15. Shemi George and Nazni P, “Formulation and Optimization of Functional Bread by Employing Response Surface Methodology”, International Journal of Current Research, Vol 4, Issue 06, pp008-014, 2012.
16. Gallagher, E., Gormley, T. R., Arendt, E. K, “Crust and Crumb Characteristics of Gluten Free Breads”. Journal of Food Engineering, 56 (2), 153–163, 2003a.
17. Murphy, S. C., Gilroy, D., Kerry, J. F., “Evaluation of Surimi, Fat and Water Content in a low/no added Pork Sausage Formulation Using Response Surface Methodology”. Meat Science, 66, 689–701, 2004.
18. Crowley, P., Grau, H., O’Connor, P., Fitzgerald, R. J., Arendt, E. K, “Effect of Glutamin Peptide on Baking Characteristics of Bread Using Experi-Mental Design”, European Journal Food Research Technology, 212 (2)192-197, 2001.
19. Josephine Selvi.N, Aruna Singh and Baskar.G, 2014. “Osmotic Dehydration of Fruits – An Integrated Approach”, International Journal of Food And Nutritional Sciences, Vol.3, Iss.3, P18-23.
20. Gan H, Karim R, Muhammad SK, Bakar J, Hashim D, Rahman R, “Optimization of the Basic Formulation of a Traditional Baked Cassava Cake Using Response Surface Methodology”. LWT-Food Sci. Technol. 40: 611-618, 2007.
21. Pritam G. Bafna, 2013. “Process Development of Kokum Rts Beverage Using Response Surface Methodology (RSM)”, International Journal of Food and Nutritional Sciences, Vol.2, Iss.2, p1-6.
ISSN: 2319-8753
I
nternational
J
ournal of
I
nnovative
R
esearch in
S
cience,
E
ngineering and
T
echnology
(An ISO 3297: 2007 Certified Organization)
Vol. 3, Issue 9, September 2014
23. Bhagyashree Solanki, 2013. “Oats Soy Moghlai”, International Journal of Food and Nutritional Sciences, vol 2, Issue 2, p103-105. 24. Preeti Rathi1 and Renu Mogra, 2013. “Development and Sensory Evaluation of Superior Products with Flaxseed”, International Journal of
Food And Nutritional Sciences,Vol.2, Iss.1, p12-15
25. Ahmed H. El-Ghorab, Fouad Osman, Magda A. Abd El Mageed, Mohamed S. Shaheen, Ahmed M. S. Hussein, Amr F. Mansour, Hamdy A. Shaaban, Khaled F. El-Massrey and Takayuki Shibamoto, 2014. “Effects of Fermentation and Cooking on the Quality of Sausages and Burgers”, International Journal of Food and Nutritional Sciences, Vol.3, Iss.3, p145-154.
26. Tanmay Hazra, B.M.Meheta and K.D.Aparnathi, 2014. “Effect of Two Varieties of Tomato Skin Addition on Oxidative Stability of Ghee: A Comparative Study”, International Journal of Food and Nutritional Sciences, Vol.3, Iss.3, p24-27.
27. Nazni P and K.Komathi, 2014. “Quality Characteristics and Acceptability of Papaya Pulp Incorporated Yoghurt”, International Journal of Food and Nutritional Sciences, Vol.3, Iss.3, p158-162.
28. Sabharwal.Prabhjot and Dahiya. Saroj, 2014. “Effect of Processing on Amylase Rich Fieldpea Porridge (Dalia)”,International Journal of Food and Nutritional Sciences, Vol 3, Issue 1, p21-25.
29. Bezerra M, Santelli R, Oliveira E, Villar L, Escaleira L, “Response Surface Methodology (RSM) as a Tool for Optimization in Analytical Chemistry”. Talanta 76: 965-977, 2008.
30. Filipcev B, “Sugar Beet Molasses: an Ingredient to Enhance Micronutrients and Functionality in Bread”, Food & Feed Research 38(2), 95-100, 2011.
31. Vatsala C, Saxena C, Rao P, “Optimization of Ingredients and Process Conditions for the Preparation of Puri using Response Surface Methodology”. Int. J. Food. Sci. Tech. 36: 407-414, 2001.