DOI: 10.1534/genetics.104.037507
African Sequence Variation Accounts for Most of the Sequence
Polymorphism in Non-African
Drosophila melanogaster
Gerhard Scho
¨fl, Francesco Catania, Viola Nolte and Christian Schlo
¨tterer
1Institut fu¨r Tierzucht und Genetik, Veterina¨rmedizinische Universita¨t, A-1210 Vienna, Austria Manuscript received October 12, 2004
Accepted for publication April 22, 2005
ABSTRACT
We compared the sequence polymorphism of 12 genomic fragments in six geographically dispersed African populations to one EuropeanDrosophila melanogasterpopulation. On the basis of one African and one European population half of these fragments have strongly reduced levels of variability outside of Africa. Despite this striking difference in European variation, we detected no significant difference in African variation between the two fragment classes. The joint analysis of all African populations indicated that all high-frequency European alleles are of African origin. We observed a negative Tajima’sD in all African populations, with three populations deviating significantly from neutral equilibrium. Low, but statistically significant, population differentiation was observed among the African populations. Our results imply that the popula-tion structure and demographic past of AfricanD. melanogasterpopulations need to be considered for the inference of footprints of selection in non-African populations.
I
N the wake of a steadily growing number of sequenced novel environments outside the ancestral species range probably imposed new selection pressure such as novel genomes, hitchhiking mapping has become apopu-lar approach for the identification of genomic regions, climatic conditions or food resources. Thus, it is likely that a burst of adaptations associated with the out-which were recently subjected to positive directional
of-Africa habitat expansion occurred in the derived selection (Schlo¨ tterer2003). The underlying idea is
populations. Hence, the comparison of African and that the spread of a beneficial mutation is not limited
non-AfricanD. melanogaster populations is a promising to the target of selection alone, but also neutral flanking
approach to gain insight into the genetic changes re-variation is affected [(hitchhiking)Kaplanet al.1989;
quired for a habitat expansion from Africa to the rest Maynard SmithandHaigh1974]. Thus, any neutral
of the world. genetic marker linked to a beneficial mutation could
Consistent with previous microsatellite surveys (Kauer be used to identify the genomic region affected by such
et al. 2003a), a genomic scan based on 105 X-linked a selective sweep. Different approaches to the
identifi-intergenic and intronic fragments (Glinkaet al.2003) cation of nonneutral evolution in hitchhiking mapping
identified a large number of genomic regions deviating studies have been suggested, such as the reduction in
from neutral expectations. While microsatellite-based variability, increased level of linkage disequilibrium, and
surveys focus mainly on the reduction of variability, the a skewed allele frequency spectrum (Kohnet al.2000;
analysis of DNA sequences also provides information on Kimand Stephan2002;Payseuret al. 2002;Schlo¨
t-the frequency spectrum of ancestral and derived sequence terer2002, 2003). Apart from humans,Drosophila
mela-variants.Glinka et al.(2003) observed a pronounced nogasteris probably the organism for which most in-depth
difference between genomic regions putatively affected hitchhiking studies have been performed (Schlo¨ tterer
by a recent selective sweep and genomic regions, which et al.1997;Harret al.2002;Glinkaet al.2003;Kauer
showed no deviation from neutral expectations. Com-et al.2003a;OrengoandAguade´2004).
pared to neutrally evolving fragments, those with low Biogeographical and genetic data suggest thatD.
mela-levels of sequence polymorphism in a European popula-nogaster evolved in tropical Africa and colonized the
tion (i.e., putatively selected ones) displayed a pro-rest of the world only recently (DavidandCapy1988;
nounced excess of derived sites fixed in Europe but Lachaise et al. 1988). Estimates for the colonization
absent or rare in the African sample. A very similar time range fromⵑ15,000 to 10,000 years ago for Europe
pattern was described in a fine scale analysis of selective and Asia, to some 100 years ago for the Americas and
sweeps in non-AfricanD. melanogaster, which combined Australia (DavidandCapy1988). The colonization of
microsatellite and DNA sequence polymorphism analy-sis. Two genes cramped and syntaxin4 were identified as putative targets of selection and both genes carried
1Corresponding author: Institut fu¨ r Tierzucht und Genetik,
Veteri-amino acid replacements that were fixed between
Afri-na¨rmedizinische Universita¨t Wien, Josef Baumann Gasse 1, A-1210
Vienna, Austria. E-mail: [email protected] can and non-African populations (Harret al.2002).
ClustalX (Thompsonet al.1997) and adjusted manually using Given that fixed differences between African and
non-the BioEdit sequence alignment editor (Hall1999). African populations could be of central importance for
Statistical analysis: Basic population genetic parameters the identification of the targets of selection, it is ex- were calculated using the DnaSP 4.00 software (Rozaset al. tremely important to gain more insight into how stand- 2003). To assess whether the observed allele frequency spec-trum for the African sample was in accordance with the expec-ing African variation is reflected in derived populations
tations from the neutral model we calculated Tajima’sD(
Taj-in genomic regions subjected to a recent selective sweep.
ima1989). To test the significance of the average Tajima’sD Here we analyzed six X-linked noncoding fragments,
across loci, we applied a multilocus version of Tajima’sD-test identified as candidate regions affected by selection using the HKA software provided byJ.Hey (http://www.lifesci. (Glinkaet al.2003), and six putatively neutrally evolving rutgers.edu/ⵑheylab/). This method evaluates whether the average observed value of Tajima’s D is consistent with the fragments selected from the same study in five
addi-equilibrium model by comparing it to its simulated equilib-tional sub-Saharan African populations. We detected
rium distribution (Klimanet al.2000). We performed 10,000 considerable population structure among African
popu-independent standard coalescent simulations for each locus lations and significant deviations from neutrality in and population, conditioned on the observed number of seg-three out of six African populations, strongly implying regating sites (S). We assumed no intragenic recombination, but free recombination between fragments. For each simula-past demographic events in AfricanD. melanogaster
pop-tion, we noted whether it produced a D-value smaller or ulations. Furthermore, all sites previously described to
greater than the observed one. be fixed between African and non-AfricanD.
melanogas-Genetic differentiation among the African populations was terwere found to be segregating in our African samples. analyzed by means of the haplotype statisticH
ST(Hudsonet
al.1992) and the nearest-neighbor statisticSnn(Hudson2000).
HSTis based on the haplotype frequencies in the sample alone
MATERIALS AND METHODS and does not utilize the information on the number of differ-ences between haplotypes.Snnis a measure of how often the Fly stocks:Sequence data previously published byGlinka
nearest neighbors of sequences in sequence space are from et al.(2003) were acquired from the EMBL database (http://
the same locality. This method has been shown to combine the www.ebi.ac.uk) for 12 African lines originating from Lake
Kar-advantages of haplotype-based and sequence-based methods iba, Zimbabwe (ZLK), 12 European lines originating from
over a wide range of sample sizes and haplotype diversities Leiden, The Netherlands (NL), and oneD. simulansline (Davis,
(Hudson2000). We calculated global and pairwiseHSTand
CA). Additional sequences were collected for 46 isofemale
Snn values for each fragment separately. To assess levels of
AfricanD. melanogasterlines: 7D. melanogasterlines were
col-significance, we permuted genotypes among populations lected in Kampala, Uganda (KAM), 10 in Kisoro, Uganda
10,000 times. In cases where the sample size differed among (KIS), 10 lines in Kenya (KEN), 9 in Mali (MA), and 10 lines
populations the weighting factors recommended inHudson
in the Sengwa Wildlife Reserve, Zimbabwe (ZS). Furthermore,
et al.(1992) were used. Populations were tested for all pairwise oneD. simulansfrom Kampala, Uganda, was included.
combinations (including the ZLK population fromGlinkaet
Loci sequenced:A subset of 12 fragments was selected from
al. 2003). The differentiation probabilities Pfrom pairwise 105 noncoding DNA fragments from both intronic and
in-population comparisons for all fragments were combined to tergenic regions on the X chromosome (Glinkaet al.2003).
the2-distributed quantity⫺2兺lnPwith 2kd.f. (kbeing the
When compared to an African sample, 6 of these fragments
number of fragments). This method of combining probabili-were previously shown to contain no or little variation in a
ties allows us to create an overall test for significance from a European sample of 12 lines, whereas the other 6 fragments
series of separate significance tests on different sets of data exhibited “normal” levels of polymorphism (Glinka et al.
(Sokaland Rohlf1995). The validity of this test depends 2003). Primers were designed on the basis of release 3.2 of the
on the assumption of free recombination for all fragments. completeD. melanogastergenome sequence. For two fragments
In Drosophila, linkage disequilibrium dissipates within a few (NV120 and LV375), our sequences were only partially
over-kilobases (Miyashita and Langley 1988; Langley et al. lapping with the published sequences. These fragments were
2000). As the minimum physical distance between fragments also sequenced in one European population from Neumarkt
analyzed was 91 kb (averageⵑ1.1 Mb, Table 1), we do not (Germany) to obtain a European reference. The average length
consider nonindependence of the fragments to be of major of the fragments wasⵑ400 bp (see Table 1 for details). Each
effect for our analyses. fragment was sequenced in both directions. Sequence data have
We determined the time to the most recent common ances-been submitted to GenBank under accession nos. AJ889255–
tor of the European fragments, by estimating the number of AJ889565, AJ889618–AJ889823, and AJ889869–AJ889914. Primer
putatively new mutations in the derived populations that arose sequences and amplification conditions are given in
supplemen-after the split from the ancestral populations: first, we identi-tary Table S1 (http://www.genetics.org/supplemental/).
fied all alleles that were present only in the European sample.
DNA preparation and sequencing:DNA was extracted from
Second, we excluded those variants that were found in the a single male fly from each strain using a high-salt extraction
same individual, reasoning that they more likely represent a protocol (Milleret al.1988). DNA amplification was carried
rare haplotype rather than two novel mutations occurring on out in a 20-l reaction volume. A typical cycling profile
con-the same chromosome. Third, we dated con-the colonization event sisted of 3 min denaturation at 94⬚ followed by 35 cycles of
on the basis of a silent mutation rate of 15.4⫻10⫺9
substitu-94⬚for 40 sec, annealing temperature for 50 sec, and extension
tions/year/bp (Li1997). Finally, we used thegenetreesoftware at 72⬚ for 1 min. PCR products were sequenced for both
(BahloandGriffiths2000) to determine the distribution strands using BigDye Terminators v1.1 cycle sequencing
chem-of the time to the most recent common ancestor (TMRCA) istry. The extension products were purified with Sephadex
of the European population scaled in Ne generations. We
G-50 fine (Amersham Biosciences, Sweden) and separated on
circumvented the potential problem of ancestral African varia-a Megvaria-aBACE 500 varia-automvaria-ated cvaria-apillvaria-ary sequencer. Forwvaria-ard varia-and
tion segregating in the European population by using only reverse strands were assembled using the Autoassembler 2.1
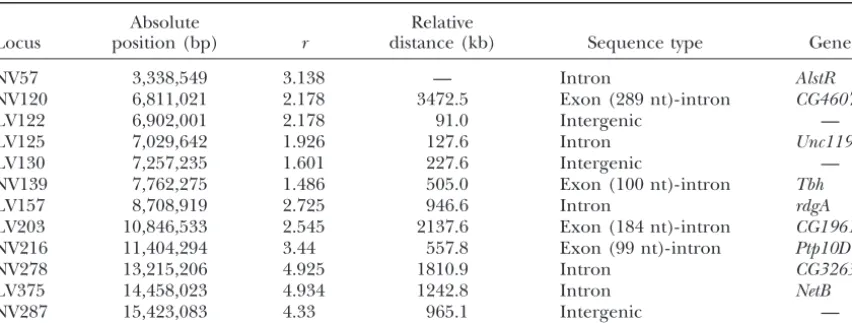
TABLE 1
List of loci analyzed
Absolute Relative
Locus position (bp) r distance (kb) Sequence type Gene
NV57 3,338,549 3.138 — Intron AlstR
NV120 6,811,021 2.178 3472.5 Exon(289 nt)-intron CG4607
LV122 6,902,001 2.178 91.0 Intergenic —
LV125 7,029,642 1.926 127.6 Intron Unc119
LV130 7,257,235 1.601 227.6 Intergenic —
NV139 7,762,275 1.486 505.0 Exon(100 nt)-intron Tbh
LV157 8,708,919 2.725 946.6 Intron rdgA
LV203 10,846,533 2.545 2137.6 Exon(184 nt)-intron CG1961
NV216 11,404,294 3.44 557.8 Exon(99 nt)-intron Ptp10D
NV278 13,215,206 4.925 1810.9 Intron CG32635
LV375 14,458,023 4.934 1242.8 Intron NetB
NV287 15,423,083 4.33 965.1 Intergenic —
For each locus we provide absolute position on the X chromosome in base pairs (based on theD. melanogaster genome release 3.2); recombination rate (r) expressed as recombination events per site per generation⫻ 10⫺8(Glinkaet al.2003); relative distance between consecutive loci in kilobases; sequence type (for each locus
partly covering an exonic region, the number of coding nucleotides is provided on the basis of release 3.2 of theD. melanogaster genome); and genes where the intronic loci are located. NV, normal variability; LV, low variability.
The coalescent simulations implemented ingenetreeassumed www.genetics.org/supplemental/). In our sample of Af-a constAf-ant populAf-ation size Af-andvalues identical to the esti- rican populations no significant difference in variability mates for the African population [meanfor low variability
(silent heterozygosity-to-divergence ratios) was detected (LV) fragments⫽0.0142; meanfor normal variability (NV)
between LV (0.21⫾ 0.08) and NV (0.26⫾ 0.09) frag-fragments⫽0.0191].
ments (Mann-WhitneyU-test,P⫽0.31).
Deviation from mutation-drift equilibrium: We did
RESULTS not observe an excess of high-frequency-derived sites.
Of 70 population-locus pairs, only 5 had a significantly
DNA sequence variation:We sequenced 12
noncod-negativeH-value (FayandWu2000). After a Bonferroni ing fragments from predominantly intronic and
in-correction, no population-locus pair was found to be tergenic regions on the X chromosome in five African
significant. populations from Uganda (Kampala and Kisoro), Kenya,
We used Tajimas’sDto test if the analyzed sub-Saharan Mali, and Zimbabwe (ZS) (see Table 1 for details). The
D. melanogasterpopulations were in mutation-drift equi-number of segregating sites, haplotype diversity,
nucleo-librium. In the absence of selection, populations in mu-tide diversity, levels of divergence, Tajima’sD, and Fay
tation-drift equilibrium will have Tajima’sD-values close and Wu’sHfor the combined African sample are given
to zero. However, demographic events, such as popula-in Table 2 (see supplementary Table S2 at http://
tion expansion, bottlenecks, and admixture, will result www.genetics.org/supplemental/ for a breakdown for
in a genome-wide deviation from zero. We used a multi-each locus by population). To account for different
locus test based on coalescent simulations to compare mutation rates in the genomic regions sequenced, we
the observed Tajima’sD-values at all loci jointly against followed an approach previously suggested (e.g.,
the neutral expectation for mutation-drift equilibrium SchlenkeandBegun2003) and standardized the
popu-(Klimanet al.2000). For three populations (Kampala, lation variation estimators by the divergence betweenD.
Mali, ZS) no significant deviation from neutrality was ob-simulansandD. melanogaster. Similar levels of variability
served across fragments, while for the three remaining were detected in all African populations, with average
ones (Kenya, Kisoro, ZLK), a significantly negative Taji-silent heterozygosity-to-divergence ratios ranging from
ma’sDwas observed (Table 3). 0.18 to 0.26. Silent heterozygosity-to-divergence ratios
Could this overall pattern have been generated by one (averaged across populations) differed among loci and
or two loci strongly deviating from neutral expectations ranged from 0.13 to 0.37. Our set of fragments
con-rather than reflect a genome-wide deviation from neu-tained six regions, which were previously shown to have
trality? Upon visual inspection we found that the signifi-low levels of polymorphism in a European population
cantly negative overall Tajima’sD-values in three popu-(LV fragments), while the remaining six fragments
har-lations were due to a moderately negative Tajima’sDof bored normal levels of variability (NV fragments)
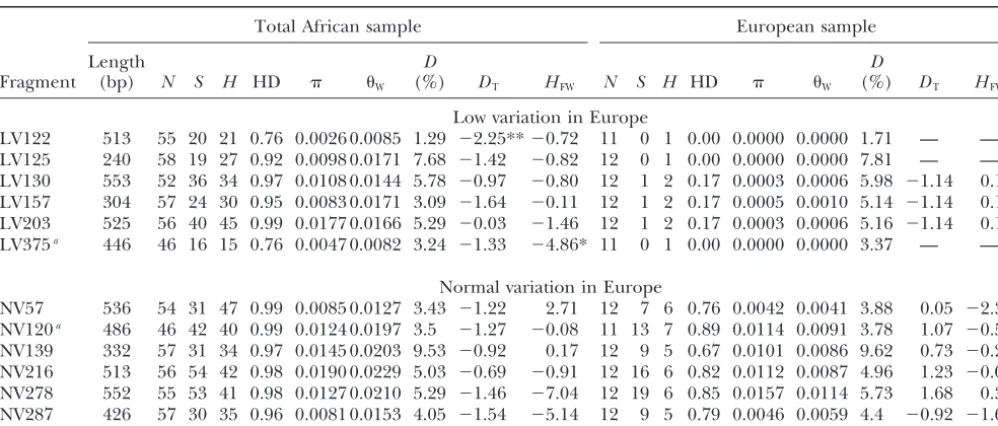
TABLE 2
Summary statistics for 12 X-chromosomal fragments in African and European population samples
Total African sample European sample
Length D D
Fragment (bp) N S H HD W (%) DT HFW N S H HD W (%) DT HFW
Low variation in Europe
LV122 513 55 20 21 0.76 0.0026 0.0085 1.29 ⫺2.25**⫺0.72 11 0 1 0.00 0.0000 0.0000 1.71 — — LV125 240 58 19 27 0.92 0.0098 0.0171 7.68 ⫺1.42 ⫺0.82 12 0 1 0.00 0.0000 0.0000 7.81 — — LV130 553 52 36 34 0.97 0.0108 0.0144 5.78 ⫺0.97 ⫺0.80 12 1 2 0.17 0.0003 0.0006 5.98 ⫺1.14 0.15 LV157 304 57 24 30 0.95 0.0083 0.0171 3.09 ⫺1.64 ⫺0.11 12 1 2 0.17 0.0005 0.0010 5.14 ⫺1.14 0.15 LV203 525 56 40 45 0.99 0.0177 0.0166 5.29 ⫺0.03 ⫺1.46 12 1 2 0.17 0.0003 0.0006 5.16 ⫺1.14 0.15 LV375a 446 46 16 15 0.76 0.0047 0.0082 3.24 ⫺1.33 ⫺4.86* 11 0 1 0.00 0.0000 0.0000 3.37 — —
Normal variation in Europe
NV57 536 54 31 47 0.99 0.0085 0.0127 3.43 ⫺1.22 2.71 12 7 6 0.76 0.0042 0.0041 3.88 0.05 ⫺2.39 NV120a 486 46 42 40 0.99 0.0124 0.0197 3.5 ⫺1.27 ⫺0.08 11 13 7 0.89 0.0114 0.0091 3.78 1.07 ⫺0.55 NV139 332 57 31 34 0.97 0.0145 0.0203 9.53 ⫺0.92 0.17 12 9 5 0.67 0.0101 0.0086 9.62 0.73 ⫺0.27 NV216 513 56 54 42 0.98 0.0190 0.0229 5.03 ⫺0.69 ⫺0.91 12 16 6 0.82 0.0112 0.0087 4.96 1.23 ⫺0.03 NV278 552 55 53 41 0.98 0.0127 0.0210 5.29 ⫺1.46 ⫺7.04 12 19 6 0.85 0.0157 0.0114 5.73 1.68 0.39 NV287 426 57 30 35 0.96 0.0081 0.0153 4.05 ⫺1.54 ⫺5.14 12 9 5 0.79 0.0046 0.0059 4.4 ⫺0.92 ⫺1.64
Length, excluding sites with gaps/missing data;N, number of lines;S, number of segregating sites;H, number of haplotypes; HD, haplotype diversity;, nucleotide diversity;, the neutral parameter ⫽4Neestimated from the number of segregating
sites;D, divergence betweenD. simulansandD. melanogaster;DT, Tajima’sD; HFW, Fay and Wu’sH. Significance levels forHFW
were estimated from 1000 standard coalescent simulations assuming no recombination.*0.01⬍Pⱕ0.05;**Pⱕ0.01. aEuropean sample from Neumarkt, Germany; Lake Kariba, Zimbabwe, is missing from the African sample.
genetics.org/supplemental/). Only one population-locus tests). This confirms that the overall significant devia-tion from neutrality for three populadevia-tions is likely to pair had a significantly negative Tajima’sD, indicating
that multiple loci contributed to the significant devia- result from the joint effect of all loci rather than a few outliers.
tion from neutral expectations across all loci. We further
substantiated this observation by performing a sign test The three populations that report significant negative overall Tajima’sD have on average the largest sample for each population to evaluate if more loci with a
nega-tive Tajima’sDwere observed than expected by chance. sizes. To rule out that the difference among the popula-tions reflects different statistical power rather than a Significant deviations from expectations (P⬍0.05, paired
sign tests) were found for each of the three populations biologically significant result, we repeated the multilo-cus analysis with equal sample sizes for all populations that showed significantly negative Tajima’sD, whereas
no significant trend in Tajima’sD-values was detected (N ⫽ 7) after randomly discarding individuals from the larger populations. Two populations (Kenya and for the other three populations (P⬎0.39, paired sign
TABLE 3
Tajima’sDacross 12 unlinked loci [10 loci for Zimbabwe (Lake Kariba)]
Population Na D
obsb Dsimc Dsim⬍Dobs(%)d P
Zimbabwe (Lake Kariba) 11.7 ⫺0.668 ⫺0.069 1.86 *
Zimbabwe (Sengwa) 9.4 ⫺0.381 ⫺0.068 11.55 NS
Uganda (Kampala) 6.9 ⫺0.173 ⫺0.047 32.32 NS
Uganda (Kisoro) 9.6 ⫺0.740 ⫺0.063 0.35 **
Kenya 9.8 ⫺0.581 ⫺0.070 2.40 *
Mali 8.7 ⫺0.176 ⫺0.058 33.39 NS
NS, not significant;*0.01⬍Pⱕ0.05;**Pⱕ0.01. aMean number of lines for each population across 12 loci. bObserved mean value of Tajima’sDacross 12 loci. cSimulated mean value of Tajima’sDacross 12 loci.
TABLE 4
Pairwise genetic differentiation for six African populations
Kampala Kisoro Kenya Mali ZS ZLK
A
Kampala 77.99 77.04 57.32 69.81 91.21
Kisoro ⬍0.0001** 27.71 26.47 47.25 39.24
Kenya ⬍0.0001** 0.27 33.53 19.24 25.38
Mali 0.0002** 0.33 0.093 28.17 56.54
ZS ⬍0.0001** 0.0031* 0.74 0.25 33.10
ZLK ⬍0.0001** 0.0062* 0.19 ⬍0.0001** 0.033 (NS)
B
Kampala 77.95 72.32 64.51 78.35 89.32
Kisoro ⬍0.0001** 22.03 39.43 31.81 24.22
Kenya ⬍0.0001** 0.58 31.67 18.05 17.42
Mali ⬍0.0001** 0.027 (NS) 0.15 37.06 41.49
ZS ⬍0.0001** 0.15 0.80 0.04 (NS) 34.21
ZLK ⬍0.0001** 0.24 0.65 0.0037* 0.026 (NS)
The values above the diagonal give the combined probabilities (⫺2兺lnP) from the significance tests of pairwise differentiation at 12 unlinked loci [10 loci in comparisons involving Zimbabwe (Lake Kariba)] for (A) Snnand (B)HST. The values below the diagonal give the significance levels in the meta-analysis (seematerials
and methods for details). NS, not significant; *0.01 ⬍ Pⱕ 0.05; **P ⱕ 0.01 after sequential Bonferroni correction.
Kisoro) remained significant, whereas ZLK increased African origin of European variation:Fragments with low variability in a non-African population were pre-only marginally beyond the threshold with 5.97%Dsim⬍
Dobs. Hence, the observed heterogeneity among the sub- viously found to harbor a disproportionately high
num-ber of fixed or high-frequency-derived mutations in SaharanD. melanogasterpopulations is explained better
by biological differences among the populations than non-AfricanD. melanogaster(Glinkaet al.2003). Given the evidence for population substructure in African by differences in statistical power.
Genetic differentiation among populations: To test D. melanogaster, we were interested in using a large set of AfricanD. melanogasterpopulations to determine the whether our African population samples were drawn
from a single panmictic population, we estimated genetic proportion of European variation that was already seg-regating in Africa. In particular, we tested whether the differentiation among populations using the haplotype
statisticHST(Hudsonet al.1992) and the nearest-neigh- proportion of mutations absent in our Africa sample
differed between LV fragments and NV fragments. As bor statistic (Snn) (Hudson2000). A separate analysis of
all 12 loci indicated a statistically significant differen- outlined byGlinkaet al.(2003), we used theD. simulans sequence to distinguish between ancestral and derived tiation (after applying a sequential Bonferroni
correc-tion) among the African populations for 6 loci (NV57, variants.
On the basis of the original comparison between one NV120, NV139, NV216, NV278, and LV203) usingHST
and for 5 loci (NV57, NV139, NV216, NV278, and LV203) European and one African population (Glinka et al. 2003) we identified a total of 15 fixed differences (Euro-usingSnn(supplementary Table S4 at http://www.genetics.
org/supplemental/). A meta-analysis combining the prob- pean alleles) in the six LV fragments. Twelve of these alleles were derived and 3 were ancestral with respect abilities over all 12 loci (SokalandRohlf1995) indicated
a highly significant differentiation of AfricanD. melanogas- to the D. simulans sequence. No fixed difference was identified for the six NV fragments. The joint analysis terpopulations. The meta-analysis of population pairs
showed a highly significant differentiation among some of all African populations indicated that all 15 sites identified as fixed differences between one African and pairs, but no significant differentiation among others.
Most important, the pattern of differentiation did not one European D. melanogasterpopulation could be de-tected in the extended African sample (Table 5). The follow a geographic pattern;i.e., more distantly located
population pairs were not always highly differentiated mean frequency of those alleles that were misclassified as European was 0.16⫾0.10 (n⫽15) in the extended and vice versa (Table 4). In general, for population pairs
showing a highly significant differentiation, both measures African sample. For most sites the misclassified alleles were present at a low frequency (0.05–0.18). At three of differentiation provided congruent results, and among
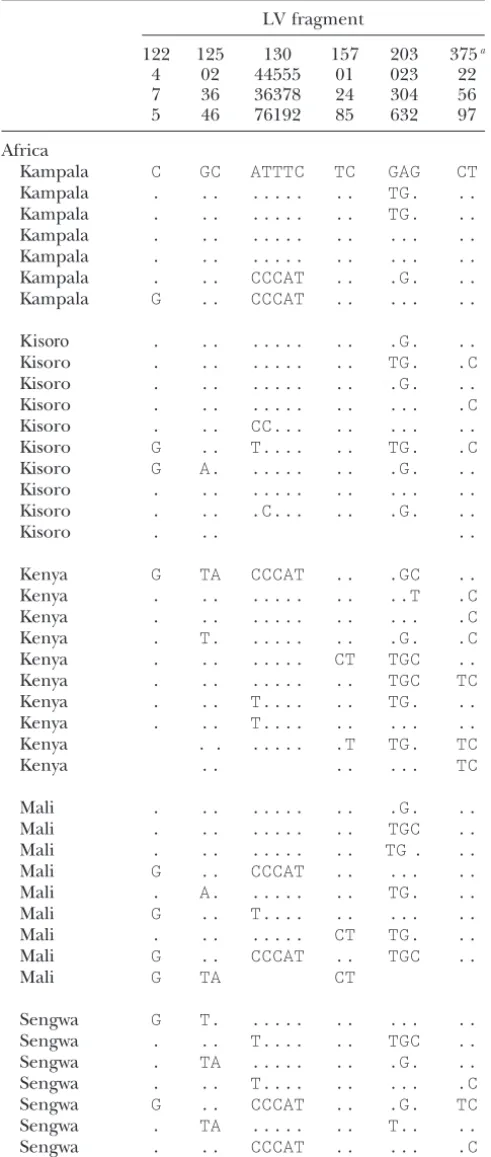
TABLE 5 TABLE 5
Polymorphism for those sites that were identified as (Continued)
fixed differences between one African (Lake Kariba)
and one EuropeanD. melanogasterpopulation for LV fragment
six “low variability” fragments
122 125 130 157 203 375a
4 02 44555 01 023 22
LV fragment 7 36 36378 24 304 56
5 46 76192 85 632 97
122 125 130 157 203 375a
4 02 44555 01 023 22 Sengwa . .. .. ... ..
7 36 36378 24 304 56
Sengwa .. .. .G. .C
5 46 76192 85 632 97
Lake Kariba . .. ... .. ...
Africa
Lake Kariba . A. ... .. ...
Kampala C GC ATTTC TC GAG CT
Lake Kariba . .. ... .. ...
Kampala . .. ... .. TG. ..
Lake Kariba . A. ... .. ...
Kampala . .. ... .. TG. ..
Lake Kariba . .. ... .. ...
Kampala . .. ... .. ... ..
Lake Kariba . .. T.... .. ...
Kampala . .. ... .. ... ..
Lake Kariba . .. ... .. ...
Kampala . .. CCCAT .. .G. ..
Lake Kariba . .. ... .. ...
Kampala G .. CCCAT .. ... ..
Lake Kariba . .. ... .. ...
Lake Kariba . .. ... .. ...
Kisoro . .. ... .. .G. ..
Lake Kariba . .. ... .. ...
Kisoro . .. ... .. TG. .C
Lake Kariba . .. T.... ...
Kisoro . .. ... .. .G. ..
Kisoro . .. ... .. ... .C
Europe
Kisoro . .. CC... .. ... ..
Leiden G TA CCCAT CT TGC TC
Kisoro G .. T.... .. TG. .C
Leiden G TA CCCAT CT TGC TC
Kisoro G A. ... .. .G. ..
Leiden G TA CCCAT CT TGC TC
Kisoro . .. ... .. ... ..
Leiden G TA CCCAT CT TGC TC
Kisoro . .. .C... .. .G. ..
Leiden G TA CCCAT CT TGC TC
Kisoro . .. ..
Leiden G TA CCCAT CT TGC TC
Leiden G TA CCCAT CT TGC TC
Kenya G TA CCCAT .. .GC ..
Leiden G TA CCCAT CT TGC TC
Kenya . .. ... .. ..T .C
Leiden G TA CCCAT CT TGC TC
Kenya . .. ... .. ... .C
Leiden G TA CCCAT CT TGC TC
Kenya . T. ... .. .G. .C
Leiden G TA CCCAT CT TGC TC
Kenya . .. ... CT TGC ..
Leiden TA CCCAT CT TGC
Kenya . .. ... .. TGC TC
Kenya . .. T.... .. TG. ..
D. simulans . .. .A.A. .. .G. .C
Kenya . .. T.... .. ... ..
Kenya . . ... .T TG. TC
The data for the Leiden and Lake Kariba populations were
Kenya .. .. ... TC
taken fromGlinkaet al.(2003).
aThe European sample for fragment 375 derives from Mali . .. ... .. .G. .. Neumarkt, Germany.
Mali . .. ... .. TGC ..
Mali . .. ... .. TG . ..
Mali G .. CCCAT .. ... .. at least some African populations. Interestingly, two of
Mali . A. ... .. TG. .. these high-frequency sites were categorized as a derived
Mali G .. T.... .. ... ..
site in Europe in the data set ofGlinkaet al.(2003). Mali . .. ... CT TG. ..
Given the significant population structure in African Mali G .. CCCAT .. TGC ..
D. melanogaster, we were interested in the number of
Mali G TA CT
African populations that need to be sampled to correctly Sengwa G T. ... .. ... .. identify ancestral African variants. To do so, we selected
Sengwa . .. T.... .. TGC .. sites for which the European allele was absent in at
Sengwa . TA ... .. .G. .. least one African population. As such sites could be
Sengwa . .. T.... .. ... .C
erroneously scored as novel European variants if only
Sengwa G .. CCCAT .. .G. TC
one of the African populations is taken for comparison,
Sengwa . TA ... .. T.. ..
we used them to determine the probability of
misclassi-Sengwa . .. CCCAT .. ... .C
fication for a given number of African populations
(Fig-Sengwa . .. .T ... ..
ure 1). If only a single African population was consid-(Continued)
can populations was due to neither individual outlier loci nor an artifact of sample size differences. The com-bined evidence from our study and the previous reports strongly suggests that at least some AfricanD. melanogas-terpopulations are not in equilibrium and their allele frequencies are strongly influenced by past demo-graphic events. While it is generally assumed that nega-tive Tajima’sD-values indicate a population expansion, it needs to be stressed that other demographic events, such as admixture from a diverged population, could also result in a similar pattern. Interestingly, a recent microsatellite analysis of different AfricanD. melanogas-ter populations also indicated a significant deviation from stable equilibrium populations (Dieringeret al. 2005).
Population structure and inference of fixed derived differences:Consistent with previous reports (Baudry
Figure1.—The probability of misclassifying an African
al-et al. 2004; Dieringeret al. 2005), our analysis of 12 lele detected in a European population as Europe specific
(and thus of outside-African origin). We considered only those DNA fragments indicated significant population differ-African alleles that were not detected in at least one differ-African entiation among African D. melanogaster populations. population. The probability was calculated as While microsatellite data indicated that temporal
heter-ogeneity may be at least as important as geographic 1
r
兺
ri⫽1
兿
k
j⫽1
ni⫺(j⫺1)
m⫺(j⫺1), location (Dieringeret al.2005), our study included too few populations to address this question systematically. whereris the number of sites analyzed,niis the number of
Nevertheless, it is interesting that the two populations African populations lacking allelei,mis the total number of
from Zimbabwe (Sengwa and Lake Kariba) were signifi-populations, andkis the number of populations considered.
Note that this equation assumes independence among sites cantly differentiated, while more distantly located popu-and does not account for sampling heterogeneity. Low vari- lations (e.g., Sengwa and Mali) were not.
ability fragments (䊏) comprise six fragments that show very
The significant differences among African popula-little (one segregating singleton at most) or no variation in
tions considerably complicate the inference of fixed Europe. Normal variability fragments (䊐) comprise six
frag-differences among African and non-AfricanD. melano-ments that are not markedly reduced in variability in the
European population. gasterpopulations. Some alleles may be scored as absent
in Africa (and thus of putative non-African origin) while other African population samples may contain this al-probability to falsely classify variants to be of European lele. Our analysis, therefore, strongly suggests that multi-origin was higher than that for LV fragments (Figure 1). ple African populations need to be analyzed before firm When more than a single African population was consid- conclusions can be drawn about their origin. As our ered, the probability of misclassification decreased with population sample was rather small, we were not able an increasing number of African populations. However, to test to what extent larger population samples could for NV fragments even after sampling four African popu- compensate for the analysis of multiple populations. lations almost 10% (8.3%) of the alleles were missed in Back migration:Our analysis indicated that all high-the African populations and consequently incorrectly frequency alleles of a European population were also classified as Europe specific (Figure 1). detected in at least one African population. Two alterna-tive explanations can be put forward for this observa-tion. Either the alleles are of African origin or they DISCUSSION
originated in Europe and were brought to Africa by back migration. Back migration of European alleles has
Demography:Given thatD. melanogasteroriginated in
sub-Saharan Africa, it has been widely assumed that previously been suggested for several AfricanD. melano-gasterpopulations (Be´nassiandVeuille1995;Capyet AfricanD. melanogasterpopulations are close to
equilib-rium. Nevertheless, recent multilocus sequence poly- al.2000;Kaueret al.2003b). If recent back migration to Africa were responsible for shared variation between morphism analyses reported a negative Tajima’sD-value
in African populations (Harret al. 2002;Glinkaet al. African and European populations, the European hap-lotype should be conserved in Africa. To test this hypoth-2003;Baudryet al.2004). Consistent with these results,
we also found negative mean Tajima’s D-values for all esis we focused on those sites that were at a high fre-quency (fixed) in the European population, but at a populations. However, for only three of the populations
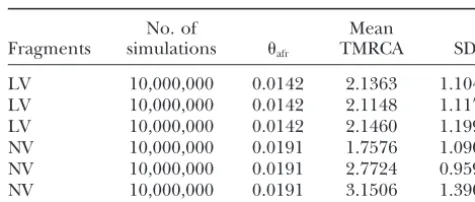
Afri-TABLE 6
least three different haplotypes in the African sample
(haplotype diversityh ⱖ0.54). Given that we analyzed Estimates of the time to the most recent common ancestor only short fragments (⬍600 bp), sufficient time was (TMRCA) of putative novel (postsweep and postbottleneck) required to generate the high haplotype diversity in mutations scaled in coalescent units
African flies carrying the putative European allele. Thus,
No. of Mean
we propose that either these alleles are of African origin
Fragments simulations afr TMRCA SD
and reached a high frequency in the European
popula-tion or they are derived from an old admixture event. LV 10,000,000 0.0142 2.1363 1.1040 Due to the low number of putative European mutations LV 10,000,000 0.0142 2.1148 1.1175 we do not have enough power to distinguish between LV 10,000,000 0.0142 2.1460 1.1992
NV 10,000,000 0.0191 1.7576 1.0908
these two scenarios. Considering that two additional
NV 10,000,000 0.0191 2.7724 0.9590
putative European alleles had a high frequency in most
NV 10,000,000 0.0191 3.1506 1.3901
African populations, we favor the ancestral African
varia-tion hypothesis. Simulations were conditioned on the mean-estimates of the African sample for the two classes of fragments (LV, NV),
Selective sweeps coincide with the out-of-Africa habitat
respectively. Three replicates were performed assuming a
con-expansion: A recent series of publications found strong
stant population size. evidence for a significant number of selective sweeps in
non-AfricanD. melanogasterpopulations (Harret al.2002;
Glinkaet al.2003;Kaueret al.2003a;Sa´ezet al.2003; for the two classes of fragments (Table 6). When we OrengoandAguade´2004). The timing of the selective conditioned the simulations on mean African of all sweeps is, however, not clear. One possibility would be fragments the estimates were similar (results not shown). that beneficial mutations occurred sequentially afterD. Thus, our data do not show a significant difference for melanogasterexpanded its habitat. Alternatively, benefi- the minimum age estimate of the colonization event cial mutations may have all occurred within a very nar- and the sweeps putatively associated with it. Neverthe-row time interval and only the presence of the majority less, due to the small number of mutations our test does of the mutations made the successful colonization possi- not have enough power to determine the age of the ble. Finally, most of the mutations may already have beneficial mutations, in particular, if some heterogene-been segregating in Africa, but became beneficial only ity among the LV fragments is assumed. A larger set of in the European context (OrrandBetancourt2001; fragments may provide more insight into this question. Catania and Schlo¨ tterer 2005). In an attempt to Implications for polymorphism analysis in non-Afri-shed some light on this important question, we com- can populations:Our analysis indicated that almost all pared LV and NV fragments. We estimated the number variation detected in non-AfricanD. melanogasterflies is of new mutations that have putatively arisen in the de- most likely of African origin. This result is consistent rived populations after the habitat expansion and after with a previous comparison of African and non-African the selective sweeps, respectively (see materials and D. melanogaster populations (Schlo¨ tterer and Harr methods). All identified mutations were singletons and 2002). The implication of this observation is that all derived with respect toD. simulans. In total, we identified estimates ofor the population recombination parame-three mutations in the LV fragments and five mutations ter in non-African populations are heavily influenced in the NV fragments. Using the approximate calculation by ancestral African variation. Thus, African variation proposed by Baudry et al. (2004) and a mean silent and the past demographic history of non-African popu-mutation rate of 15.4⫻10⫺9substitutions/year/bp (Li
lations are pertinent to the interpretation of neutrality 1997), we obtained an estimated age of 6102 years for tests based on allele frequency data.
the LV fragments, and 8678 years for the NV fragments.
We thank the members of the C.S. lab for constructive suggestions
Both estimates are very similar, and the value for the and critical discussion.B.Charlesworth provided helpful comments LV fragments is almost identical to the 6415 years ob- on an earlier version of the article. Two anonymous reviewers provided tained byBaudryet al.(2004). We inferred confidence helpful criticism. This work was supported by Fonds zur Fo¨rderung
der Wissenschaftlichen Forschung grants to C.S.
intervals for these estimates using thegenetree software (BahloandGriffiths2000) to calculate the TMRCA for the putative novel mutations of the LV and NV
LITERATURE CITED fragments. The genetree analysis was based on the
in-ferred European alleles only to avoid the confounding Bahlo, M., andR. C. Griffiths, 2000 Inference from gene trees in a subdivided population. Theor. Popul. Biol.57:79–95.
effect of ancestral African variation. We ran three
repli-Baudry, E., B. ViginierandM. Veuille, 2004 Non-African
popula-cas of a set of 10,000,000 coalescent simulations condi- tions ofD. melanogasterhave a unique origin. Mol. Biol. Evol.21:
1482–1491.
tioned on -estimates for the African samples for the
Be´nassi, V., andM. Veuille, 1995 Comparative population
structur-two classes of fragments, respectively (mean for LV
ing of molecular and allozyme variation ofDrosophila melanogaster fragments, 0.0142; mean for NV fragments, 0.0191). Adhbetween Europe, West Africa and East Africa. Genet. Res.
65:95–103.
Capy, P., M. Veuille, M. Paillette, J. M. Jallon, J. Vouidibioet Braverman, 2000 Linkage disequilibria and the site frequency spectra in the su(s) and su(w(a)) regions of theDrosophila melano-al., 2000 Sexual isolation of genetically differentiated sympatric
gasterX chromosome. Genetics156:1837–1852. populations ofDrosophila melanogasterin Brazzaville, Congo: The
Li, W. H., 1997 Molecular Evolution. Sinauer Associates, Sunderland, first step towards speciation? Heredity84:468–475.
MA.
Catania, F., andC. Schlo¨ tterer, 2005 Non-African origin of a
Maynard Smith, J., andJ. Haigh, 1974 The hitch-hiking effect of local beneficial mutation inD. melanogaster.Mol. Biol. Evol.22:
a favourable gene. Genet. Res.23:23–56. 265–272.
Miller, S. A., D. D. DykesandH. F. Polesky, 1988 A simple salting
David, J. R., andP. Capy, 1988 Genetic variation ofDrosophila
melano-out procedure for extracting DNA from human nucleated cells.
gasternatural populations. Trends Genet.4:106–111.
Nucleic Acids Res.16:1215.
Dieringer, D., V. NolteandC. Schlo¨ tterer, 2005 Population
Miyashita, N., andC. H. Langley, 1988 Molecular and phenotypic structure in AfricanDrosophila melanogasterrevealed by
microsatel-variation of the white locus region inDrosophila melanogaster. Ge-lite analysis. Mol. Ecol.14:563–573.
netics120:199–212.
Fay, J. C., andC.-I Wu, 2000 Hitchhiking under positive Darwinian
Orengo, D. J., and M. Aguade´, 2004 Detecting the footprint of selection. Genetics155:1405–1413.
positive selection in a European population ofDrosophila
melano-Glinka, S., L. Ometto, S. Mousset, W. StephanandD. DeLorenzo,
gaster: multilocus pattern of variation and distance to coding 2003 Demography and natural selection have shaped genetic
regions. Genetics167:1759–1766.
variation inDrosophila melanogaster: a multilocus approach. Genet- Orr, H. A., andA. J. Betancourt, 2001 Haldane’s sieve and adapta-ics165:1269–1278. tion from the standing genetic variation. Genetics157:875–884.
Hall, T. A., 1999 BioEdit: a user-friendly biological sequence align- Payseur, B. A., A. D. CutterandM. W. Nachman, 2002 Searching ment editor and analysis program for Windows 95/98/NT. Nu- for evidence of positive selection in the human genome using cleic Acids Symp. Ser.41:95–98. patterns of microsatellite variability. Mol. Biol. Evol.19:1143–
Harr, B., M. KauerandC. Schlo¨ tterer, 2002 Hitchhiking map- 1153.
ping: a population-based fine-mapping strategy for adaptive muta- Rozas, J., J. C. Sa´nchez-DelBarrio, X. MesseguerandR. Rozas, tions in Drosophila melanogaster.Proc. Natl. Acad. Sci. USA 99: 2003 DnaSP, DNA polymorphism analyses by the coalescent
12949–12954. and other methods. Bioinformatics19:2496–2497.
Hudson, R. R., 2000 A new statistic for detecting genetic differentia- Sa´ez, A. G., A. Tatarenkov, E. Barrio, N. H. BecerraandF. J.
tion. Genetics155:2011–2014. Ayala, 2003 Patterns of DNA sequence polymorphism atSod
Hudson, R. R., D. D. BoosandN. L. Kaplan, 1992 A statistical test vicinities inDrosophila melanogaster: unraveling the footprint of a for detecting geographic subdivision. Mol. Biol. Evol.9:138–151. recent selective sweep. Proc. Natl. Acad. Sci. USA100:1793–1798.
Kaplan, N. L., R. R. HudsonandC. H. Langley, 1989 The “hitch- Schlenke, T. A., andD. J. Begun, 2003 Natural selection drives Drosophila immune system evolution. Genetics164:1471–1480. hiking effect” revisited. Genetics123:887–899.
Schlo¨ tterer, C., 2002 A microsatellite-based multilocus screen for
Kauer, M. O., D. DieringerandC. Schlo¨ tterer, 2003a A
microsa-the identification of local selective sweeps. Genetics160:753–763. tellite variability screen for positive selection associated with the
Schlo¨ tterer, C., 2003 Hitchhiking mapping—functional geno-“out of Africa” habitat expansion ofDrosophila melanogaster.
Genet-mics from the population genetics perspective. Trends Genet. ics165:1137–1148.
19:32–38.
Kauer, M. O., D. DieringerandC. Schlo¨ tterer, 2003b
Nonneu-Schlo¨ tterer, C., andB. Harr, 2002 Single nucleotide polymor-tral admixture of immigrant genotypes in AfricanDrosophila
mela-phisms derived from ancestral populations show no evidence for
nogasterpopulations from Zimbabwe. Mol. Biol. Evol.20:1329–
biased diversity estimates inDrosophila melanogaster.Mol. Ecol.11:
1337.
947–950.
Kim, Y., andW. Stephan, 2002 Detecting a local signature of genetic
Schlo¨ tterer, C., C. VoglandD. Tautz, 1997 Polymorphism and hitchhiking along a recombining chromosome. Genetics 160:
locus-specific effects on polymorphism at microsatellite loci in 765–777.
natural Drosophila melanogasterpopulations. Genetics146:309–
Kliman, R. M., P. Andolfatto, J. A. Coyne, F. Depaulis, M.
Kreit-320.
man et al., 2000 The population genetics of the origin and
Sokal, R. R., andF. J. Rohlf, 1995 Biometry: The Principles and Practice
divergence of theDrosophila simulanscomplex species. Genetics
of Statistics in Biological Research. W. H. Freeman, New York.
156:1913–1931. Tajima, F., 1989 Statistical method for testing the neutral mutation
Kohn, M. H., H. J. PelzandR. K. Wayne, 2000 Natural selection hypothesis by DNA polymorphism. Genetics123:585–595. mapping of the warfarin-resistance gene. Proc. Natl. Acad. Sci. Thompson, J. D., T. J. Gibson, F. PlewniakandF. Jeanmougin, 1997 USA97:7911–7915. The CLUSTAL_X windows interface: flexible strategies for
multi-Lachaise, D., M.-L. Cariou, J. R. David, F. Lemeunier, L. Tsacas ple sequence alignment aided by quality analysis tools. Nucleic
et al., 1988 Historical biogeography of theDrosophila melanogaster Acids Res.25:4876–4882.
species subgroup. Evol. Biol.22:159–225.