Order Parameter Studies by Image Analysis
L.N.V.H..Soma Sundar
1, K. Mallika
1, K.B. Mahalakshmi
2, Ha Sie Tiong
3, S. Sreehari Sastry
,1Department of Physics, Acharya Nagarjuna University, Nagarjunanagar, India1
Department of Geology, Acharya Nagarjuna University, Nagarjunanagar, India2
Department of Chemical Science, Faculty of Science, Universiti Tunku Abdul Rahman, Jalan Universiti, Bandar Barat,
Kampar, Perak., Malaysia. 3
ABSTRACT: In this paper, Thermo optical properties of two azomethine liquid crystals: 3-hydroxy-4-{[(4-iodophenyl)imino]methyl}phenyl alkanoates (Cn-1H2n-1COO-, n = 8,18) comprising terminal iodo substituent are
investigated using image analysis technique in conjunction with Optical Polarizing Microscope. This investigation purely based on intensities of the liquid crystal textures as a function of temperature. Thermo optical properties: Optical transmittance, Absorption coefficient, Birefringence, Phase retardation and Order parameter of the liquid crystals are computed by analyzing the textures of liquid crystals using MATLAB software. The obtained results show that, the length of terminal chain length influences the thermo optical properties of the compounds. The lowest member of the azomethine liquid crystals: nABIA (n = 8), with respect to temperature exhibited the tunable birefringence by showing more variations in the birefringence values of each wavelength with linearity compared to the highest member nABIA (n= 18) and the azomethine liquid crystal where n = 8 is more suitable for applications than the compound (n = 18).
KEYWORDS: Mesogens, image analysis, optical properties, birefringence, order parameter
1. INTRODUCTION
image objects by means of applying some computational algorithms on image data or intensity values. The investigated thermo optical parameters are Optical transmission, Absorption coefficient, Birefringence, Phase retardation, and order parameter. Phase transition temperatures of different thermotropic liquid crystals are also identified using image analysis technique [ 21-24 is first betchold paper].
II. EXPERIMENTAL
The liquid crystals of Schiff base esters:3-hydroxy-4-{[(4-iodophenyl)imino]methyl}phenyl alkanoates: nABIA , (Cn-1H2n-1COO-, n = 8,18) where n = 8 and 18 possessing different alkyl chain lengths are synthesized [25]
and used. The ITO coated homogeneous cell having area of 5mm X 5mm with 5m spacing (tolerance is ± 0.2 µm) are obtained from Instec Inc., USA, is used to prepare liquid crystal sample for investigation. The Schiff base esters mesogens are injected into liquid crystal cells through capillary action on heating the sample to the isotropic state. Temperature dependent textural investigations are carried out by Meopta polarizing optical microscope attached to hot stage as described by Gray [26] and high resolution Canon color camera. The color image detected by the camera has a resolution of 3888 x 2592 pixels which represents the 24bit true color pixel tone that ranges from 0 to 255 in R, G, and B colors under crossed and parallel polarizer’s with the digital camera of canon made model (EOS Digital REBEL XS/ EOS1000D) of 10.10 mega pixel image sensor. To compute thermo optical properties, Textures of the sample from isotropic to solid phase are recorded in three monochromatic image planes at the wavelengths of 635 nm (red), 530 nm (green) and 470 nm (blue) as a function of temperature [ 19,20,27,28]. Measurements of thermo-optical properties are made on a three monochromatic image planes show the greatest variations in intensity. The program was coded in MATLAB (implemented on P5 1.6GHz with 2GB RAM computer) for computational analysis of textures. The behavior of light with respect to temperature and material is defined in terms of thermo optical properties and are measured using optical parameters like optical transmission, Absorption coefficient, Birefringence and Phase retardation. Thermo optical properties of liquid crystals are defined in terms of image intensity values in [29 - 31 ].
III. RESULTS AND DISCUSSIONS
(a) (b)
(c) (d)
Figure 1.Optical textures (Smectic A phase) of Liquid crystal: 3-hydroxy-4-{[(4 iodophenyl) imino]
methyl}phenyl alkanoates (Cn-1H2n-1COO-,) for n-8 observed between crossed polarizers (a) for RGB colour
(a) (b)
(c) (d)
Figure 2: optical textures of Liquid crystal: 3-hydroxy-4-{[(4-iodophenyl)imino]methyl}phenyl alkanoates (Cn-1H2n-1COO-,) for n-18 (a) I - Smectic A phase, (b) Smectic B phase of n =18; (c) Smectic B –
Crystal phase, (d) Crystal phase.
Table 1. Phases and Phase transition temperatures of .
Compound Phases Phase transition temperatures (oC)
(nABIA) DSC POM
8ABIA I – Sm A - Cr 107.8 - 36.4 107.5 – 46.0 18ABIA I – Sm A – sm B - Cr 107.4 – 104.6 – 79.5 106.0 – 102.5 – 78.0
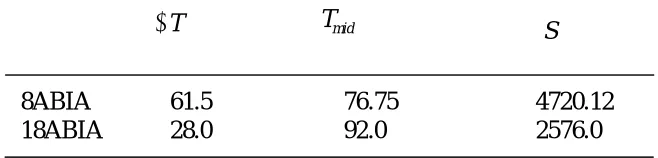
The azomethine liquid crystal ( nABIA) where n = 8, exhibits the transition from isotropic to smectic A phase at temperature 107.50C and second transition from smectic A to solid phase at temperature 46.00C. The azomethine liquid crystal n = 18 exhibits the transition from isotropic to smectic A phase at temperature 106.00C and second transition from smectic A to smectic B phase at temperature 102.50C and third transition from Smectic B to solid phase at temperature at 78.00C. The mesophase range for the compound n = 8 (61.50C) is more compared to the compound n =18 (28.00C). This is due to the fact that, the increase of alkyl chain length from n = 8 to 18, leads to the dilution of mesogenic core [ book ref 32].
Liquid crystals with terminal halogen groups can also controls the Phase stability of the compounds. It is an important parameter that governs the utility of the mesogen and stability of present or occurred phase. It is also known as Thermal stability factor S [33,34] and is given by
S
T
mid*
T
(1)where
T
mid is the middle of phase temperature and
T
is the temperature range of phase. In this way thermal stability of the liquid crystals nABIA are calculated using Equation (1) and are tabulated in Table 2 .Table 2: Thermal stability factor obtained for Smectic phase of azomethine liquid crystals
Liquid crystal phase of the lower member compound is dominant one compared to the higher members of the compound. The increase in chain length increases the dispersion forces and shielding of terminal dipolar attractions of terminal groups that elevates the mesogenic range. This can be observed clearly from Table 2 (Column of
T
).Introducing terminal halogen substituent’s with the side ofthe aromatic core structure through metal complex formation either improves or suppress the mesogenic properties based on the polarity and structural property relationships. The nature of the terminal substituents or end groups in the molecule of the mesogen has profound influence on the liquid crystal properties. Optical behaviors of such liquid crystals are considerable properties for practical applications. Here, thermo optical properties (including phase transition behavior) are investigated using image analysis technique in conjunction with POM on MATLAB platform. In this technique to compute the optical properties as a function of temperature, textures of the compounds are recorded from the isotropic phase of the sample to the solid phase through POM with hot stage and camera attachment. For small decrement of temperature, there is no change in the textures are remains same. As the temperature is increased, changes in textural features occurred reveals the phase transition. While passing a phase from initial phase (isotropic phase) to other liquid crystal phase or liquid crystal phase to solid phase, orientation of the molecules with respect to the temperature affects the transmitted intensity values of the textures in terms of textural feature changes. It gives the information for understanding the thermo optic characteristics of liquid crystals.This can be observed from Figures 1 as a representative case. Computed
T
T
midS
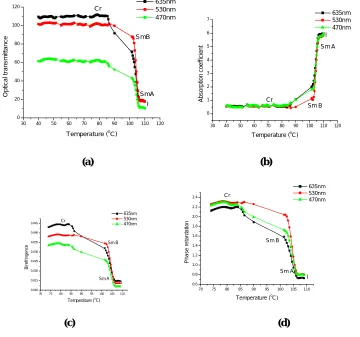
Depending on wavelengths, for different phases, there are changes in the textural features as function of temperature. This can be useful to investigate the optical behavior of the samples.Figures: 3(a) and 4(a) show the variations in the values of optical transmittance at the transitions I – Smectic and Smectic - Cr. On cooling, the value of optical transmittance increases near the isotropic phase to Smectic transition and is maximum at the SmA – solid phase temperature interval. Temperature decrement of the sample is inversely proportional to the optical transmittance in crossed polarizer condition. Figures 3 (b) and 4 (b) show, the value of AC is maximum in isotropic state. In this phase the molecular orientation is random and there is no transmission of light. On cooling of the sample, there is a sudden decrement of absorption coefficient values takes place in the liquid crystal region of I - Smectic phase temperature interval. This is due to the fact that, the transmission of light takes place in smectic phase alignment of molecules. Sharp texture transformations of I - Smectic - Cr gives the jump like changes in the values of AC. Optical transmittance of the sample is inversely proportional to the Absorption coefficient (AC) .
Figures 3(c), 4(c) clearly indicates that the birefringence values at three wavelengths are plotted against the temperature. Here, computation of birefringence relies on observing an intensity change in the textures of liquid crystals. In all, a general trend is observed as temperature is either increased or decreased for each liquid crystal sample, there are major changes appear in the textures of samples depending on wavelengths. At the lowest or highest temperatures the texture remains same like solid phase (shown in Figures 1 and 2) or isotropic phase (dark colour). However, as temperature increased or decreased, the texture became smoother depending on alignment of molecules in sample. In isotropic phase, the destruction of molecular alignment from their respective phases causes the disappearance of birefringence property and it leads to the decrement of Birefringence value to zero. On cooling of the sample from its isotropic phase,
30 40 50 60 70 80 90 100 110 120 0 20 40 60 80 100 120 SmA SmA - Cr
I - SmA Cr I O p ti ca l T ra n sm it ta n ce
Temperature (0
C)
635nm 530nm 470nm
(a) (b)
20 40 60 80 100 120
0 1 2 3 4 5 6 I
I - SmA SmA
SmA - Cr
Cr 635nm 530nm 470nm A b s o rp ti o n C o e ff ic ie n t
Temperature (0
C)
40 60 80 100 120
0.010 0.015 0.020 0.025 0.030 0.035 0.040 0.045 0.050 Cr
SmA - Cr SmA
I - SmA I 8ABIA cooling B ir e fr in g e n c e
Temperature (0
C)
635nm 530nm 470nm
30 40 50 60 70 80 90 100 110 120 0.6 0.8 1.0 1.2 1.4 1.6 1.8 2.0 2.2 2.4 Cr SmA SmA - Cr
I I - SmA
635nm 530nm 470nm P h a s e r e ta rd a ti o n
Temperature (0
(e)
Figure 3: Optical properties of 8ABIA (a) Optical transmittance; (b) Absorption coefficient; (c) Birefringence; (d) Phase retardation; (e) Order parameter.
( Cr:Crystal;SmA: Smectic A; I:Isotropic).
(a) (b)
40 50 60 70 80 90 100 110 120 0.40 0.45 0.50 0.55 0.60 0.65 0.70 0.75 0.80 0.85 0.90 I SmA 8ABIA cooling 635nm 530nm 470nm O rde r par ameter
Temperature (0C)
30 40 50 60 70 80 90 100 110 120 0 20 40 60 80 100
120 635nm
530nm 470nm Cr SmB SmA I Opt ic al trans m it tanc e
Temperature (0C)
30 40 50 60 70 80 90 100 110 120 0 1 2 3 4 5 6 7 Sm B Sm A I Cr A b s o rp ti o n c o e ff ic ie n t
Temperature (0
(e)
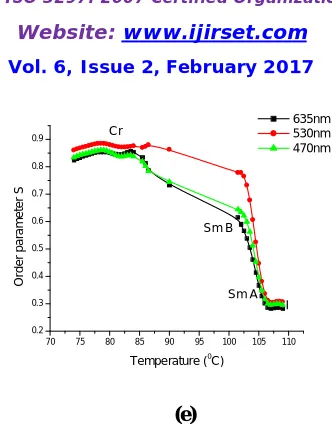
Figure 4: Optical properties of 18ABIA (a) Optical transmittance; (b) Absorption coefficient; (c) Birefringence; (d) Phase retardation; (e) Order parameter.
( Cr:Crystal;SmA: Smectic A; I:Isotropic).
the value of birefringence increases abruptly in the biphasic region of I – Smectic temperature interval and there are small fluctuation in the value of birefringence at Smectic - Cr phases on further/ cooling. Liquid crystal coexistence regions (I - LC, LC - Cr) are commonly marked by an abrupt change in birefringence due to an immediate loss of all birefringence in a particular region of the sample. The small variations in the optical parameter curves other than transitions are due to change in the refractive index of the samples which results the continuous color changes as a function of temperature. However, birefringence of liquid crystal complexes shows uniform and continuous loss of birefringence in its coexistence region, which is quantitatively depicted through the curvature of Figures 3(c) ,4(c). Figure 3(d),4(d) shows the temperature dependent phase retardation of azomethine liquid crystals.
As a function of temperature, phase change occurs due to disturbance in directions of the molecules. Changes in phase retardation values are function of single variable
n
. In solid phase liquid crystal molecule directors remain undisturbed and no phase change occurs. While passing the phase, orientation of molecular directions results small changes in the phase retardation values. In this regime the value of phase retardation is inversely proportional to temperature. This can be clearly observed for two samples from Figure Figure 3(d),4(d) at three wavelengths. Thelarger Δn is, the larger the phase shift obtained.
A simple procedure is used for the determination of the order parameter (S) from the birefringence measurements. Order parameter of the liquid crystals is determined from the Kuczynski equation by using the direct measurement of birefringence values. The temperature dependent birefringence values of the samples obtained are used to compute the temperature dependent order parameter of the azomethine liquid crystals: nABIA where n = 8 and 18. These measurements are made in the phase transition regions of I – liquid crystal - Cr phase of the sample and the measured order parameter values are plotted against the temperature. The order parameter (S) shown in Figure 3(e),4(e) is maximum in Cr – Liquid crystal transition state and it goes on decreasing as the temperature is incremented towards the isotropic phase of the sample which has the lowest order parameter of the order of 0.2. The values of order parameter during the transition from the I – Smectic – Cr phases are in the range of 0.85 to 0.2. Here the parameters are computed purely based on gray level intensity vales of the image textures [29-31], where as in the other case the parameters are obtained based on the light transmitted intensity, molecular polarizabilities, refractive indices
70 75 80 85 90 95 100 105 110 0.2
0.3 0.4 0.5 0.6 0.7 0.8
0.9 Cr
I Sm A Sm B
635nm 530nm 470nm
O
rd
e
r
p
a
ra
m
e
te
r
S
Temperature (0
Now a days, longer spacer groups of the liquid crystal compounds, play a key role in determining the global thermo optical properties as far as the stability of the and order of the mesophases are concerned. But, In case of azomethine liquid crystals with lesser spacer groups n = 8 has more thermal stability compared to compound with higher spacer groups n = 18 (Table 2). The compound with higher spacer groups n = 18 destroys the liquid crystalline by diluting the ordering effect of rigid core and eventually the compound is not able to maintain the liquid crystal ordering. The variations in birefringence for the compound n = 18 are small and linear in all the three wavelengths when compared for the compound n = 8. It means the birefringence is same for all the wavelengths at a given temperature. But the compound n = 8 exhibited the tunable birefringence by showing more variations in the birefringence values of each wavelength with linearity. The tunable birefringence is the variation of birefringence that should be large and linear with respect to temperature [38,39]. So, the compound with n = 8 is more suitable for applications than the compound with n = 18.
IV. CONCLUSION
Textural features of the samples in relation to temperature provided the information approximately suitable to determine the optical properties of the samples. The computed thermo optical parameters all plotted against temperature well established the different transitions and their corresponding transition temperatures in azomethine mesogens under investigation. The azomethine liquid crystal where n = 8 is more suitable for applications than the compound (n = 18) by exhibiting the tunable birefringence with respect to temperature.
ACKNOWLEDGEMENT
The authors gratefully acknowledge University Grants Commission Departmental Special Assistance at Level I program No. F.530/1/DSA- 1/2015 (SAP-1), dated 12 May 2015, and Department of Science and Technology-Fund for Improving Science and Technology program No.DST/FIST/ PSI–002/2011 dated 20-12-2011, New Delhi, to the Department of Physics, Acharya Nagarjuna University for providing financial assistance. Further,S.T. Ha wishes to thank Universiti Tunku Abdul Rahman for a grant from the UTAR Research Fund (6200H10).
REFERENCES
[1]. Martin Stalder, Oberwil, Martin Schadt, Seltisberg, Nematic liquid crstal electro- optical element and device, U.S. Patent A1 0147033, 2003. [2]. Ernst Lueder, Liquid crystal displays – Addressing schemes and electro optic Effects, John Wiley & Sons, United Kingdom, 2005.
[3]. J.W. Scott, D.J. Gregory, P.C. Gregory, Liquid Crystals : Frontiers in Biomedical Applications, World Scientific Publishing Co.Pte.Ltd, Singapore, 2007.
[4]. M.J. Ford, Penny Hale, J.G. Shapter, N.H. Voelcker, E.R. Waclawik , Liquid crystal displays: Fabrication and measurement of a twisted nematics liquid crystal cell, Journal of Chemical Education, Vol.81, 854-858, 2004.
[5]. Liquid crystals and advanced organic materials, Department of chemistry, University of York. Heslington:York; Available from: http://www.york.ac.uk/chemistry/staff/academic/d-g/jgoodby/.
[6]. S.M.Kelly, Hand book of Advanced Electronic and Photonic Materials and Devices, Academic Press, U.S.A, 2000. [7]. Quan Li, Liquid Crystals Beyond Displays – Chemistry, Physics and Applications, John Wiley & sons, New Jersey, 2012. [8]. P.J. Collings, M. Hird, Introduction to Liquid Crystals: Chemistry and Physics, Taylor & Francis Ltd., UK, 1998.
[9]. H. Kelker, B. Scheurle, Eine flüssig-kristalline (nematische) Phase mit besonders niedrigem Erstarrungspunkt, Angewantde Chemie, Vol: 81, 903 – 904, 1969.
[10]. G.N. Taylor, F.J. Kahn, Materials Aspects of Thermally Addressed Smectic and Cholesteric Liquid Crystal Storage displays, Journal of Applied Physics, Vol: 45, 4330-4338, 1974.
[11]. A. K. Prajapati and M. C. Varia, “Azomesogens with polar chloro, nitro and phenolic -OH substituents,” Liquid Crystals, vol. 35, no. 11, pp. 1271–1277, 2008.
[16]. W. Kuczynski, B.Zywucki, J.Malecki, Determination of Orientational order parameter in various Liquid-Crystalline phases, Mol. Cryst. Liq. Cryst. Vol. 381, 1-9, 2002.
[17]. P.V.Datta Prasad,V.G.K.M. Pisipati, Simple, accurate and low cost optical
techniques for the measurement of birefringence of liquid crystal and variation of angle of the small angled prism with temperature, Mol. Cryst. Liq. Cryst. Vol. 511, 102- 111, 2009.
[18]. Ivan Haller, H. A. Huggins, M.J. Freiser, On the measurement of indices of refraction of nematics liquid crystals, Journal of Molecular Crystals and Liquid Crystals, Vol. 16, 53-59, 1972.
[19]. Rafel C. Gonzalez, Richard E. Woods, Steven L. Eddins, Digital Image Processing Using MATLAB (Gatesmark, Natick, 2009), Vol.2. p.1. [20]. Solomon C.J, Breckon T.P, Fundamentals of Digital Image Processing: A Practical Approach with Examples in Matlab, Wiley-Blackwell, Chichester, UK, 2011.
[21]. S.Sreehari Sastry, K. Mallika, B. Gowri Sankararao, Ha Sie Tiong, S. Lakshminarayana,Identification of phase transition temperatures by statistical image analysis, Liquid Crystal, Vol : 39(6), 695 – 700, 2012.
[22]. S.Sreehari Sastry, K.Mallika, B. Gowri Sankararao, Ha Sie Tiong, S. Lakshminarayana,Novel Approach to study Liquid Crystal Phase Transitions Using Legendre Moments, Phase Transition, Vol: 85(8), 735 – 749, 2012.
[23]. S. Sreehari Sastry,B. Gowri Sankara Rao,K. B. Mahalakshmi, K. Mallika , Image Analysis Studies for Phase Transitions of Ferroelectric Liquid Crystals,ISRN Materials Science, 1-8, 2012.
[24]. J.Eccher , A.R.Sampaio, R.C.Viscovin, G.Conte, E. Westphal, H.Gallardo,I.H.
Bechtold, Image processing as a tool for phase transitions identification, Journal of Molecular Liquids, Vol.153, 162-166, 2010. [25]. S.T. Ha, T.L. Lee, G.Y.Yeap, M.M.Ito, Ayumu Saito, Masaaki Watanabe,
Mesomorphic behavior of new azomethine liquid crystals having terminal iodo group,Chinese Chemical Letters, Vol: 22, 260-263, 2011. [26]. G.W.Gray, Molecular Structure and the properties of Liquid Crystals, Academic
press, New York, 1962.
[27]. J.Piper, RGB-Splitting and multi shot techniques in digital photomicrography –Utilization of astronomic RGB filters in true colour imaging, Microscopy Today, Vol. 17(1), 48-51, 2009.
[28]. R.N. Clark, Implications of Digital Photography Technology, Clarkvision Articles, 2010.
[29]. S. Sreehari Sastry, S. T. Ha , B. Gowri Sankara Rao , K. Mallika and T. Vindhya Kumari, Optical properties of a mesogen by image analysis, Liquid Crystals, Vol: 39(11), 1414-1419, 2012.
[30]. S. Sreehari Sastry, Sandeep Kumarb , T. Vindhya Kumaria , K. Mallika , B. Gowri Sankara Rao and Ha Sie Tiong, Liquid crystal parameters through image analysis, Liquid Crystals, Vol: 39(12), 1527-1537, 2012.
[31]. S. Sreehari Sastry , K.Mallika, T.Vishwam,S. Lakshminarayana, Ha Sie Tiong, Image analysis method to study electro-optic parameters of nematogens,Liquid Crystals, Vol: 41(4), 558-571, 2014.
[32]. D.Coates, Liquid crystal polymers: Synthesis , properties and applications, Rapra Technology Ltd, Vol :10, UK, 2000.
[33]. A.J. Gopunath A.J, T. Chitravel , C. Kavitha C, N. Pongali Sathya Prabu, M.L.N. Madhu Mohan, Thermal, Optical, and Dielectric Analysis of Hydrogen-Bonded Liquid Crystals Formed by Adipic and Alkyloxy Benzoic Acids, Molecular Crystals and Liquid Crystals, 592: 63-81, 2014. [34]. G.W. Smith, Z.G.Gardlund, Liquid crystalline phases in a doubly homologous series
of benzylideneanilines‐textures and scanning calorimetry, Journal of Chemical Physics, Vol: 59, 3214 - 3228 , 1973.
[35]. I.H.Ibrahim, W.Haase, On the molecular polarizability of nematic liquid crystals, Mol. Cryst. Liq. Cryst., 66, 189–198, 1981.
[36]. C. Southern and H F Gleeson, Using the full Raman Depolarization in the determination of order parameters in liquid crystal systems. European Physical Journal E. Vol. 24, 119-127 2007
[37]. N.V.S.Rao,V.G.K.M. Pisipati,P.V.Datta Prasad, D.Saran, ESR Study of Molecular Ordering in PEBAB and PMBAB Z. Naturforsch. Vol. 39c: 700-701, 1984.
[38]. A.K. Greg, J.D. Michael, A.Graham, Liquid crystal tunable birefringent filters. Proceedings of SPIE, optical spectroscopic techniques and instrumentation for atmospheric and space research II, Vol. 2830. Bellingham (WA): SPIE; 1996.
![Figure 1.Optical textures (Smectic A phase) of Liquid crystal: 3-hydroxy-4-{[(4 iodophenyl) imino]](https://thumb-us.123doks.com/thumbv2/123dok_us/1617820.1200874/3.595.118.483.185.584/figure-optical-textures-smectic-liquid-crystal-hydroxy-iodophenyl.webp)