ABSTRACT
WHERLEY, BENJAMIN GEORGE. Nitrogen Relations in Bermudagrass During Growth and Dormancy Cycles. (Under the direction of Drs. Thomas W. Rufty, Jr. and Daniel C. Bowman).
Use of recycled water for turfgrass irrigation is increasing in the southeastern U.S. because of population growth and interest in protecting water quality. Turfgrass systems are perceived to be well suited for effluent dispersal due to their proximity to waste treatment facilities, in-ground irrigation systems, and ability to efficiently absorb (i.e. filter) nutrient contaminants when actively growing. However, effluent generation is continuous and bermudagrass growth is seasonal in the southeastern U.S. Clearly, there is a need to more thoroughly understand the capacity of bermudagrass, the turfgrass most often involved with effluent dispersal, for receiving effluent irrigation.
This series of experiments was designed with the overall intent of examining the capacity of a bermudagrass turf/soil system for handling effluent applications.
Experiments involved 1) characterizing seasonal changes in nitrate assimilation
efficiency of the system, 2) determining the effects of prolonged soil saturation on nitrate uptake efficiency, and 3) characterizing internal nitrogen relations during the spring emergence period.
Nitrogen Relations in Bermudagrass During Growth and Dormancy Cycles
by
Benjamin George Wherley
A dissertation submitted to the Graduate Faculty of North Carolina State University
In partial fulfillment of the requirements for the Degree of
Doctor of Philosophy
Crop Science
Raleigh, NC 2007
APPROVED BY:
_________________________ ____________________________ Dr. Wei Shi Dr. Fred H. Yelverton
_________________________ ____________________________ Dr. Daniel C. Bowman Dr. Arthur H. Bruneau Co-chair of Advisory Committee
BIOGRAPHY
Benjamin George Wherley was born in Dover, OH in 1975, to Benjamin and Suzanne Wherley. The youngest of five children, Benjamin graduated from New Philadelphia High School in 1994. He attended Otterbein College in Westerville, OH, where he majored in Life Sciences. During both his high school and college years, Benjamin worked on the greens staffs at a number of golf courses, developing a strong interest and appreciation for the agronomic challenges involved with turfgrass
management. After 2 ½ years at Otterbein, Benjamin transferred to The Ohio State University, where he enrolled in the turfgrass science program. In 1998, Benjamin married his high school sweetheart, Amy (McCluggage) Wherley. A year later, Benjamin graduated from Ohio State with a B.S. in Agronomy, and was employed by Wedgewood Golf and Country Club as an assistant golf course superintendent.
Benjamin began his graduate school career in the Department of Horticulture and Crop Science at The Ohio State University in January 2001 under the direction of Dr. David Gardner, with significant guidance from Dr. Karl Danneberger and Dr. James Metzger. Benjamin’s Masters project concentrated on the influence of light intensity and the spectral composition on turfgrass development. After completing his Masters degree in June 2003, he attended North Carolina State University, where he pursued a Ph.D. in Environmental Turfgrass Physiology under the direction of Dr. Thomas Rufty.
iii
ACKNOWLEDGEMENTS
I wish to sincerely thank my advisors, Drs. Thomas Rufty Jr., Daniel Bowman, Wei Shi, Fred Yelverton, and Arthur Bruneau for their guidance and support throughout the past four years. Their commitment to both my scholarly activity and professional development is greatly appreciated.
I am also thankful to Mike Jennette, William Blount, Anna Pardo, and Roxanne Fagan, who contributed substantially to the success of my research projects.
Furthermore, I am thankful for the relationships I have developed with fellow graduate students during this time, including Adam Hixson, Gerald Henry, James Kerns, and David Goodman.
I am most grateful for my loving and supportive wife, Amy, and son, Grant. Without their sacrifice and support, none of this would have been possible. Most
v
TABLE OF CONTENTS
Page
LIST OF TABLES... vii
LIST OF FIGURES ... viii
CHAPTER I. NITROGEN RELATIONS IN BERMUDAGRASS DURING EMERGENCE FROM WINTER DORMANCY ...1
ABSTRACT...1
INTRODUCTION ...2
MATERIALS AND METHODS...3
RESULTS AND DISCUSSION ...5
CONCLUSIONS...11
REFERENCES CITED...13
CHAPTER II. SEASONAL CHANGES IN NITRATE ASSIMILATION EFFICIENCY OF A BERMUDAGRASS SYSTEM...29
ABSTRACT...29
INTRODUCTION ...31
MATERIALS AND METHODS...33
RESULTS ...36
DISCUSSION ...41
CHAPTER III. EFFECTS OF SOIL SATURATION ON
DEVELOPMENT AND 15N-NITRATE UPTAKE EFFICIENCY OF TWO WARM SEASON GRASSES EMERGING
FROM DORMANCY ...62
ABSTRACT...62
INTRODUCTION ...63
MATERIALS AND METHODS...64
RESULTS ...69
DISCUSSION ...72
CONCLUSIONS...76
vii
LIST OF TABLES
CHAPTER I
Table 1. Dry Mass, percent N, and total N of dormant bermudagrass
phytomers analyzed prior to the beginning of the experiment ...15
Table 2. Summary model of changes in tissue N content in response to externally supplied and internally supplied nitrogen from dormancy through day 14 of spring transition ...16
CHAPTER II Table 1. Growth chamber conditions within each growth and dormancy cycle phase ...51
Table 2. Dry mass of plant tissues and N content of the organic fraction averaged across harvests for each 15N experiment ...52
Table 3. August recovery and mass balance of 15N ...53
Table 4. January recovery and mass balance of 15N ...54
Table 5. May recovery and mass balance of 15N ...55
Table 6. October recovery and mass balance of 15N...56
CHAPTER III Table 1. Distribution and mass balance of 15N recovered from centipedegrass cores supplied with 15NO3- ...86
LIST OF FIGURES
CHAPTER I
Figure 1. Illustration of bermudagrass phytomer treatments maintained
through the experiment ...17
Figure 2. Shoot dry weight, total N, 15N pool N, and 14N pool N for shoots of intact phytomers ...18
Figure 3. Percent of N supply remaining in existing tissues which could potentially support new shoot and root development ...19
Figure 4. Percent N, total N, 15N pool N, and 14N pool N in node tissues of control plants...20
Figure 5. Percent N, total N, 15N pool N, and 14N pool N in internode tissues of control plants ...21
Figure 6. Percent N, total N, 15N pool N, and 14N pool N in old root tissues of control plants...22
Figure 7. Mass, %N, and total N of nodes and internodes for the combined treatments over the 14-day experiment...23
Figure 8. Total uptake from 15N pool by phytomers having complete root system, new root system only, or old root system only ...24
Figure 9. 15N–nitrate uptake efficiency of bermudagrass phytomer tissues maintained through the experiment with old, mixed, or new root systems ...25
Figure 10. Shoot dry matter production in treatments lacking roots ...26
Figure 11. Shoot N accumulation in treatments lacking root systems...27
ix LIST OF FIGURES (continued)
CHAPTER II
Figure 1. Fractions of the bermudagrass turf/soil system analyzed for 15N
fate and mass balance...57 Figure 2. 10 cm soil temperature and shoot growth pattern of ‘Tifway 419’ bermudagrass field plot over the course of the experiment ...58 Figure 3. Leachate NO3- collected from cores following day 0 application
of nitrate-N...59 Figure 4. Partitioning of whole plant 15N in the shoot...60 Figure 5. Total microbial biomass N and apparent microbial activity ...61
CHAPTER III
Figure 1. Percent green canopy development on grass/soil cores of
centipedegrass and bermudagrass ...80 Figure 2. Cumulative clipping dry mass for centipedegrass and
bermudagrass ...81 Figure 3. New root development in centipedegrass and bermudagrass through
the experiment...82 Figure 4. Percentage of new roots at the surface relative to total new root mass ...83 Figure 5. 24-hr 15N uptake efficiency of centipedegrass and bermudagrass ...84 Figure 6. Microbial biomass 15N uptake efficiency following 24-hr uptake
CHAPTER I
NITROGEN RELATIONS IN BERMUDAGRASS DURING EMERGENCE FROM WITNER DORMANCY
ABSTRACT
In temperate regions, bermudagrass (Cynodon dactylon (L.) Pers.) has a distinct
winter dormancy period when growth ceases, followed by re-growth in the spring. In this
experiment, we investigate N relations during the initial days of re-growth as new shoots are
developing from existing nodes. Single-node fragments (phytomers) of dormant
bermudagrass were obtained from field plots and placed in nutrient solution culture in a
controlled environment chamber. Nitrogen dynamics were determined using 15 NO3- labeling
and tissue analysis. Shoots emerged on most plants within 2-3 days, and new adventitious
roots emerged alongside existing roots within 5-6 days. Developing shoots were supplied N
from internal and external sources, with internal N originating from nodes, internodes, and
old roots. Total %N in the tissues remained relatively stable, indicating that mobilized N
from internal pools was replaced by N acquired from the external media. Both old and new
roots absorbed N from the solution, with uptake by new roots timed with their development.
While internal N in isolated nodes and internodes were major contributors of N for shoot
2
INTRODUCTION
The bermudagrasses (Cynodon ssp.) are popular species in the southern U.S. for
pastures, lawns, and recreational areas. They typically undergo a cycle of growth and
dormancy in temperate regions, growing most rapidly during the heat of summer and
transitioning to a state of winter dormancy as shoot growth stops and existing leaves senesce
(Lee et al. 2003). The dormancy phase occurs when soil temperatures remain consistently
below ~10˚ C and is characterized by near complete inactivity in meristematic regions of
roots, rhizomes and stolons (Horowitz 1972; DiPaola 1982; Satorre et al., 1996). Following
dormancy, a spring regrowth period signals the start of a new cycle.
DiPaola et al. (1982) characterized the seasonal growth and dormancy of
bermudagrass turf. During dormancy, shoot growth stopped but much of the root system
appeared to remain alive. Soon after shoot growth resumed in the spring, existing roots
turned brown and died, and were replaced by completely new root systems within a period of
2-3 weeks. Shoot re-growth appeared to be driven by internal pools of carbon from old roots.
This would imply that nitrogen remobilized from old roots may have contributed to growth
of developing shoots.
Within many species (Chapin et al. 1980; Bausenwein et al. 2001b) including the
grasses (Gloser 2002; Bausenwein et al. 2001a), remobilization of nitrogen from internal
storage structures into new shoots and roots is essential for re-growth in early spring. In the
rhizomatous grass Calamagrostis epigeios, the content of amino acids (which have a primary
rapidly in early spring (Gloser 2002), reflecting their remobilization into new tissues. The
extent to which remobilized N from existing roots, stems, and nodes is used to support new
shoot and root growth in bermudagrass has not been examined in detail.
In this study, we characterize N relations of bermudagrass during emergence from
winter dormancy. Of particular interest were internal N pools and external N as each
contributed to new shoot development. The experiment involved supplying plants 15
N-labelled NO3- throughout the green-up process and monitoring changes in N pools in
different plant parts as growth occurred. The experiments included an evaluation of the role
of new and old roots during the recovery period.
MATERIALS AND METHODS
Stolons (~25 to 50 cm in length) were harvested in late January and early February
2006 from plots of dormant common bermudagrass (Cynodon dactylon (L.) Pers.). The
bermudagrass had previously been maintained at ~2 cm and received granular fertilizer N
(from a complete fertilizer) annually at a rate of 147 kg N ha-1 divided into three equal
applications at six week intervals from mid-May through early September. Soil was
carefully removed from stolons and subtending adventitious roots by gently rinsing. Stolons
were then cut with a razor blade halfway between nodal sections to create single-node stolon
fragments referred to as phytomers. Phytomers were selected for uniformity based on
primary roots between 3 and 8 cm in length and grouped into subsets based on treatments
4
treatment 1) phytomers remained intact with old and new roots; 2) new roots were excised
daily during the experiments, so phytomers developed with only old roots; 3) old roots were
excised, so phytomers were dependent on new roots only; 4) all old roots and new roots were
excised, so shoot growth occurred without contributions from roots; and 5) all tissues were
excised from the node, so the new shoot developed without subtending tissues.
Dormant bermudagrass phytomers were placed into plastic culture containers (2.5 cm
diameter x 2.5 depth) with plastic mesh bottoms that were held at the surface of culture
solutions. A small opening was created in the mesh that allowed careful extension of old
roots downward. These cups were randomly assigned to openings in the tops of five 12 L
continuous-flow hydroponics units, each having a flow rate of ~ 2.5 L per minute and
temperature/ pH control. Throughout the duration of experiments, solution temperature was
maintained at 26˚C and pH at 6.5 +/- 0.2. Solution volume was maintained by adding
distilled water daily to offset loss by evaporation.
The solution culture units were located in a controlled environment chamber
programmed for a 10/14h light/dark period and aerial temperature of 30/22˚C. A
photosynthetic photon flux of 1000 μmol m-2 sec-1 was maintained by a combination of metal
halide and incandescent lamps (Phillips Halogena, Maddox Supply). The complete nutrient
solution contained (in μmol L-1): 800 CaSO4, 300 MgSO4, 600 KNO3 (20 atom % 15N), 75
KH2PO4, 0.055 ZnSO4, 0.06 MnCl2, 0.3 B(OH)3, 0.065 CuSO4, and 25 FeSO4. The NO3
concentration in the hydroponics was monitored and never declined more than 15% in any
Tissues were harvested after 1, 3, 6, 10, or 14 days of growth on the 15N solutions.
Phytomers were removed from hydroponics solution and thoroughly rinsed in 1.0 mM
CaSO4 to completely remove external nitrate. The tissues were then dissected into shoot,
node, internode, old root, and new root fractions. A separate set of phytomers had been
harvested prior to the start of the experiment, dissected similarly, and tissues frozen. All
harvested tissues were oven dried at 65˚C for 72 hours, weighed, and pulverized to a fine
powder with an oscillating ball mill (2000 Geno/Grinder, SPEX Certiprep Inc., Metuchen,
NJ.). Dried samples were analyzed for total N and atom % 15N using a Thermo Finningan
DeltaPlus continuous-flow isotope ratio mass-spectrometer (CF-IRMSA, Bremen, Germany).
The treatments were arranged in a completely randomized design with four
replications per treatment. The experiment was run three consecutive times. Data were
subjected to analysis of variance procedures in SAS (ANOVA, SAS Institute, 2007). No
experiment, experiment by harvest, or experiment by treatment interactions were detected at
the P= 0.05 level, with regard to any of the parameters of interest, so a single analysis was
carried out using the pooled data from the three experiments (ANOVA, SAS).
RESULTS AND DISCUSSION
This experiment examined howbermudagrass phytomers develop as growth resumes
following dormancy, and specifically focuses on the sources of N (internal and extermal) that
support new shoot growth. Remobilized N has been shown to provide 70% and 82% of the
6
(Bausenwein et al. 2001a), and 58% to the total above-ground early spring growth of Rumex
acetosa (Bausenwein et al. 2001b). Little is known, however, about bermudagrass
development and its dependence on internal or external pools of N.
The initial signs of shoot development were seen within 2-3 days of transfer to the
growth chamber (Fig. 2a). Thereafter, shoot dry matter increased exponentially through the
remainder of the study to a maximum of ~17 mg per node on day 14. Overall biomass
production occurred primarily in shoots, as ~88% of the whole plant mass accumulated by
the end of the study was in the shoot (data not shown).
Total N accumulation in new shoots showed a similar exponential increase, as shoots
acquired ~630 µg total N by the end of the study (Fig. 2b). Remobilization of internal N
(14N) was fairly constant and supplied the majority of the N driving shoot growth during the
initial 10 days. By contrast, 15N absorbed from solution increased exponentially and by day
14 was the dominant source of shoot N.
The results generally agree with previous reports that new leaf tissue of grasses is the
primary sink for remobilized N during the re-growth period (Ourry et al. 1988; 1990;
Thornton et al. 1993). Shoot tissues also are the primary sink for carbohydrates and mineral
reserves (Clement et al. 1978; Satorre et al., 1996). Because bermudagrass depends so
heavily on internal N supplies during the initial 10 days of greenup, spring re-growth may be
affected by environmental and/or management factors of the previous year (Gloser 2005).
Another method to assess the potential of internal N pools to supply new growth is to
calculate the amount of N incorporated into new shoot and root growth over 14 days and
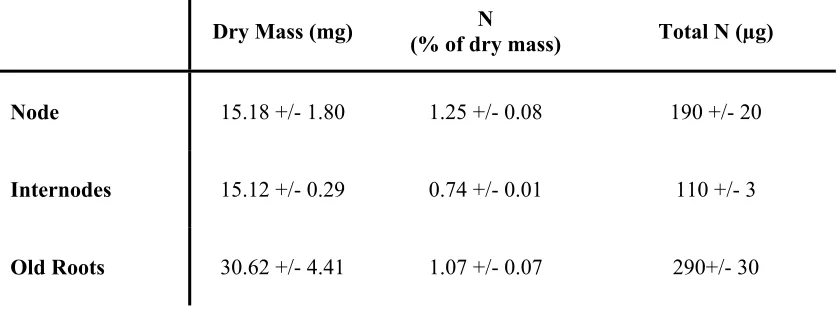
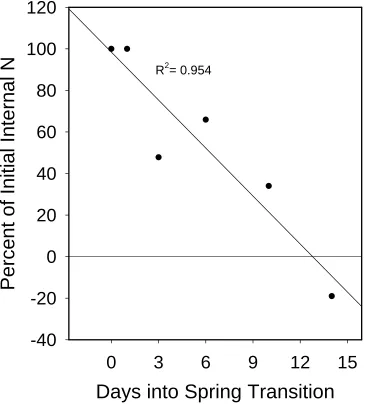
Dormant phytomers harvested at the beginning of the experiment contained ~590 μg N
(Table 1). The incorporation of N into new tissues was obtained from periodic harvest data.
The hypothetical drop in internal N reserves (Fig. 3) indicates that internal N would be
capable of supplying growth for a maximum of ~13 days. This assumes that all pre-existing
tissue N is mobile, which is obviously unlikely. Further, although growth would likely be
reduced in the absence of external N, the calculations shed light on the relative capacity of
internal pools to support growth through the transition period. Clearly, external N must be
acquired early in the green up period if a rapid growth rate is to be sustained.
Given the significance of remobilized N for new growth, it is important to consider
the extent to which various tissues supply N. Previous research with other grasses indicates
that old roots are the primary source of N for new growth, although all tissues provide some
N (Gloser 2002; Bausenwein et al. 2001b). To address this question for bermudagrass, we
analyzed individually the old roots, nodes, and internodes. Changes in %N, total N, total
15N, and total 14N of each of the tissues were determined from day 0 (dormancy) through the
end of the experiment. Due to experimental variability, it was difficult to detect clear changes
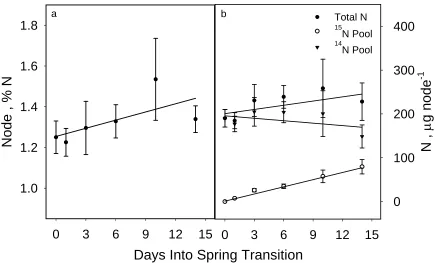
in %N of the tissues. Nonetheless, several trends were evident. With node tissue, %N and
total N increased slightly over time (Fig. 4). Concurrently, the content of internal 14N was
decreasing slowly, likely due to translocation to the young shoot.
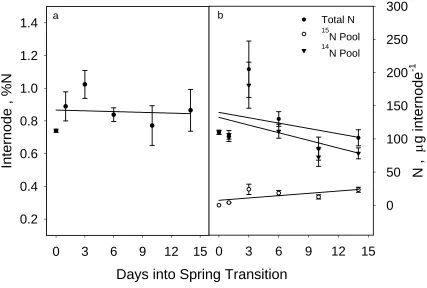
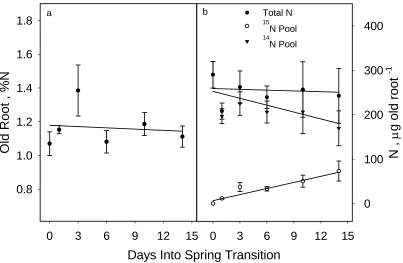
The N dynamics with internodes and old roots were somewhat different (Figs. 5 and
6). In both cases, %N and total N remained stable or decreased slightly, with internal 14N
being mobilized and replaced by 15N from the external media. Thus, the accumulation of N in
8
These data clearly show that there is substantial mixing of N in bermudagrass tissues
during green up. Nitrogen within the dormant tissue is mobilized, even while newly absorbed
N is being incorporated. From these analyses, we cannot know the types of N molecules
being mobilized internally and those being formed with accumulation of external N, nor can
we know if the same rate of mobilization of internal N would occur without an external N
source present. There are no obvious precedents for these types of results in the published
literature. Mixing of N from internal and external sources evidently occurred with roots
during shoot re-growth of Panicum maximum, while roots of Poa trivialis tended to act as a
net sink for mobilized N, irrespective of whether an external N supply was present (Santos et
al. 2002).
The relative roles of new vs. old roots in N absorption is crucial to understanding N
dynamics, since bermudagrass may lose the old root system during spring transition (Stuckey
1941; DiPaola 1982). To address this question, we evaluated NO3- uptake by phytomers
possessing only old roots, only new roots, or both old and new roots (intact phytomer).
Nitrogen uptake by intact phytomers amounted to ~ 550 µg N by the end of the study (Fig.
8). Surprisingly, phytomers with old roots alone absorbed similar amounts of N. Uptake was
lower (~ 40%) by phytomers with only new roots, probably reflecting the time required for
new root initiation and growth. However, once they were growing, new roots had higher
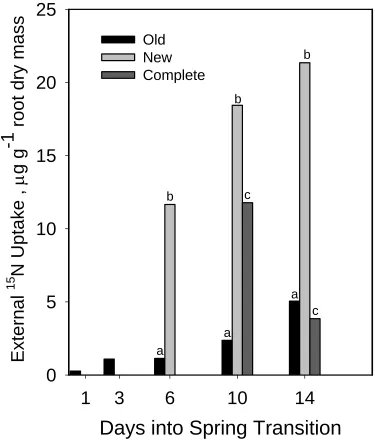
uptake efficiencies compared to old roots (Fig. 9). When 15N uptake was expressed per root
dry wt, values for new roots were ~ 5 to 10 times greater than those for old roots. The most
logical explanation is that old roots possessed senescent cell areas or tissues that were
much shoot mass as old roots (data not shown), which might suggest that feedback controls
coordinating uptake with shoot sink demand were released.
Interestingly, uptake efficiency of old roots began to increase around day 10 (Fig. 9),
coincident with root growth from the previously quiescent apical meristems of old roots.
These new roots were white and possessed much finer texture than the old roots from which
they developed (refer to Fig. 12d). More importantly, their development indicates that the
over-wintering root system of bermudagrass, although initially low in uptake efficiency, is
capable of resuming growth and function following dormancy despite its brown, weathered
appearance.
One assumption throughout this work is that there are two sources of N, the internal
tissue pool and the external soil solution. But it should be considered that the external pool
may be extremely limited for some rhizomes perched within the upper thatch layer. What,
then, might shoot growth be like if it were dependent only on internal N pools? In comparing
the intact phytomers and those with no roots (treatments 4 and 5), it is clear that lack of a root
system leads to considerable reductions in shoot growth (Fig. 10). Although little difference
could be detected both in the timing of shoot emergence, or in shoot mass through day 6, by
day 14, intact phytomers produced ~ 4 times more shoot mass than those lacking roots.
Similarities in shoot growth through day 6 between the treatments were likely the result of
both treatments relying primarily on internal supplies of N early on, but as roots developed,
10
Summary Model
Based on our tissue analyses, it is possible to assemble a general model quantifying
the contributions of N to growing shoot tissues, in effect an N budget. When tissues from all
treatments are considered, allowing for greater replication, the mass and %N of nodal tissues
was found to be stable over time. Therefore, for modeling purposes, masses and %N were
normalized across treatments for each date (refer to Fig. 7). The mean node mass was 14.83
mg and %N was 1.37 %; thus, total N was 203 μg (Table 2). With greater replication,
internode mass slightly decreased from 14 mg to 12 mg, %N from 0.95 to 0.80, and total N
from 130μg to 96μg (Fig. 7). Normalized internode data were calculated from regression
equations across harvest dates. When old roots existing at the beginning of the experiments
are plotted in a similar manner, a mass of 21 mg, %N of 1.15, and total N 242 μg can be
estimated (data not shown; refer to Table 2).
With the inclusion of shoot mass and A% 15N enrichment data, net changes in total N,
14N, and 15N of various plant tissues from day 0 through 14 can be calculated, describing the
flow of remobilized N (14N pool) and absorbed N (15N pool) that accumulate in shoot tissues.
Whole plant N increased by an estimated 643 μg N from day 0 to day 14. By comparison,
the total plant 15N content accounts for an increase of 551 μg N, due to absorption. Thus, the
model appears to be relatively accurate in predicting N flow into the tissues (~86%).
This model shows that substantial amounts of N are allocated to growth of new shoots
and roots during the initial two weeks of spring emergence (refer to Table 2), as also
indicated by the primary data. Over the 14-day period, shoots received ~570 μg N while new
throughout the study, supplied 73 μg internal 14N to other tissues and accumulated the same
amount of N from uptake. Internodes lost ~62 μg of internal 14N, while gaining ~29 μg 15N,
for a net decrease of ~33 μg of N. Old roots remained stable at 242 μg total N, providing 70
μg internal N to growing tissues and gaining 70 μg of N through uptake. In addition to the
internal N coming from these tissues, a substantial amount (320 μg) of 15 N from external
solution beyond that used to supply other tissues accumulated in the new shoots. The model
shows that each tissue lost a similar amount of N with remobilization (~ 70 µg N) to the
newly developing roots and shoots over the 14-day study. However, as a percentage of the
internal N present, internodes sacrificed relatively more N (48%) than nodes (36%) and old
roots (29%).
CONCLUSIONS
Bermudagrass turf grown in temperate climates is subjected to seasonal cycles of
growth and dormancy. As rising spring temperatures trigger previously dormant nodes to
gradually activate growth processes, the turf canopy slowly re-greens as new shoots begin to
develop. Even in the presence of an external N source, bermudagrass plants remobilized
considerable amounts of stored N from existing tissues to support growing shoots, and to a
lesser extent new roots, during the early transition from dormancy. Thereafter, growth relies
primarily on external N. These relationships imply that very early spring re-growth can be
strongly influenced by management and environment conditions in the previous season prior
to dormancy. Old roots, nodes, and internode tissues all served as sources of N transferred to
12
up only small amounts of external N. Formation of new roots (both new adventitious and
extensions to old roots) is associated with, and presumably responsible for, a noticeable
REFERENCES CITED
Bausenwein, U., Millard, P., and J.A. Raven. 2001a. Remobilized old-leaf nitrogen
predominates for spring growth in two temperate grasses. New Phytol. 152: 283-290.
Bausenwein, U., Millard, P., Thornton, B., and J.A. Raven. 2001b. Seasonal nitrogen storage and remobilization in the forb Rumex acetosa. Funct. Ecol. 15: 370-377.
Chapin, F.S., Johnson, D.A., and J.D. McKendrick. 1980. Seasonal movement of nutrients in plants of differing growth form in an Alaskan tundra ecosystem: implications for herbivory. J. Ecol. 68: 189-209.
Clement, C.R., Hopper, M.J., Jones, L.H.P., and E.L. Leafe. 1978. The uptake of nitrate by
Lolium perenne from flowing nutrient solution. II. Effect of light, defoliation, and
relationship to CO2 flux. J. Exp. Bot. 29: 1173-1183.
DiPaola, J.M., Beard, J.B., and H. Brawand. 1982. Key events in the seasonal root growth of bermudagrass and St. Augustinegrass. Hort. Sci. 17(5): 829-831.
Gloser, V. 2002. Seasonal changes of nitrogen storage compounds in a rhizomatous grass
Calamagrostis epigeios. Biol. Plant. 45(4): 563-568.
Gloser, V. 2005. The consequences of lower nitrogen availability in autumn for internal nitrogen reserves and spring growth of Calamagrostis epigejos. Plant Ecol. 179:
119-126.
Horowitz, M. 1972. Development of Cynodon dactylon (L.) Pers. Weed Res. 12: 207-220.
Lee, D.J., Bowman, D.C., Cassell, D.K., Peacock, C.H., and T.W. Rufty. 2003. Soil inorganic nitrogen under fertilized bermudagrass turf. Crop Sci. 43(1): 247-257.
Ourry, A., Boucaud, J., and J. Salette. 1988. Nitrogen mobilization from stubble and roots during re-growth of defoliated perennial ryegrass. J. Exp. Bot. 39(6): 803-809.
Ourry, A., J. Boucoud, and J. Salette. 1990. Partitioning and remobilization of nitrogen during re-growth in nitrogen-deficient ryegrass. Crop Sci. 30: 1251-1254.
Santos, P.M., Thornton, B., and M. Corsi. 2002. Nitrogen dynamics in the intact grasses
Poa trivialis and Panicum maximum receiving contrasting supplies of nitrogen. J.
14
Satorre, E.H., F.A. Rizzo, and S.P. Arias. 1996. The effect of temperature on sprouting and early establishment of Cynodon dactylon. Weed Res. 36: 431-440.
Stuckey, I. 1941. Seasonal growth of grass roots. Am. J. Bot. 28: 486-491.
Table 1. Dry mass, percent N, and total N of dormant bermudagrass phytomers analyzed prior to the beginning of the experiment. Values are means +/- standard errors.
Dry Mass (mg) (% of dry mass) N Total N (µg)
Node 15.18 +/- 1.80 1.25 +/- 0.08 190 +/- 20
Internodes 15.12 +/- 0.29 0.74 +/- 0.01 110 +/- 3
16
Table 2. A summary model of changes in tissue N content in response to externally supplied (15N pool) and internally supplied (14N pool) nitrogen from dormancy (day 0) through day 14 of spring transition. Values were calculated from changes in tissue A%15N enrichment of intact bermudagrass phytomers, and using tissue mass and %N values from all treatments (see text). Model accounts for 86% (551 μg) of the net 643 μg
increase in plant 15N.
Tissue Dormant N Supply, μg
Net Gain/ Loss of Total
N, μg
External 15N
Gain, μg (% of total
uptake)
Internal
14N
Gain/ Loss,
μg
Internal N Delivered to New
Shoots & Roots (% of dormant
supply)
Shoot 0 +567 320 (58%) +247 ---
Node 203 stable 73 (13%) -73 73 (36%)
Internode 129 -33 29 (5%) -62 62 (48%)
Old Roots 242 stable 70 (13%) -70 70 (29%)
1 (control)
2
3
4
5
Old roots New roots
internode node shoot
0 3 6 9 12 15
Shoot N ,
μ
g phyt
om
er
-1
0 200 400 600 800 Total N
15
N Pool
14
N Pool
a b
Days into Spring Transition
0 3 6 9 12 15
Shoot Dry Weight , mg phytomer
-1
0 5 10 15 20 25
a
Figure 2. a) Shoot dry weight and b) total N, 15N pool N, and 14N pool N for shoots of intact phytomers. Error bars denote one standard error of the mean.
R
2= 0.954
Days into Spring Transition
0
3
6
9
12
15
Percent of Initial Internal N
-40
-20
0
20
40
60
80
100
120
R2= 0.954
0 3 6 9 12 15
N ,
μ
g node
-1
0 100 200 300 400 Total N
15
N Pool
14
N Pool
Days Into Spring Transition
0 3 6 9 12 15
Node , % N
1.0 1.2 1.4 1.6 1.8
a b
Figure 4. a) Percent N and b) total N, 15N pool N, and 14N pool N in node tissues of control plants. Error bars denote one standard error of the mean.
Days into Spring Transition
0 3 6 9 12 15
N ,
μ
g internode
-1
0 50 100 150 200 250 300 Total N
15
N Pool
14
N Pool
0 3 6 9 12 15
Internode , %N
0.2 0.4 0.6 0.8 1.0 1.2
1.4 a b
Figure 5. a) Percent N and b) total N, 15N pool N, and 14N pool N in internode tissues of
0 3 6 9 12 15
N ,
μ
g old root
-1
0 100 200 300 400
Total N
15
N Pool
14
N Pool
Days Into Spring Transition
0 3 6 9 12 15
Old Root , %N
0.8 1.0 1.2 1.4 1.6
1.8 a b
Figure 6. a) Percent N and b) total N, 15N pool N, and 14N pool N in old root tissues of control plants. Error bars denote one standard error of the mean.
Nodes
Mass , mg node -1 10 12 14 16 18 20Internodes
Mass , mg internode
-1 8 10 12 14 16 18 20 % N 0.6 0.8 1.0 1.2
0 2 4 6 8 10 12 14
T o ta l N , μ g int e rnode -1 60 80 100 120 140 160 y= -0.172x + 14.18
y= -0.010x + 0.935
y= -2.48x + 128.88
%N
1.0 1.2 1.4 1.6
Days into Spring Transition
0 2 4 6 8 10 12 14
Total N , μ g node -1 140 160 180 200 220 240 260
y= -0.012x + 14.831
y= 0.003x + 1.341
y= -0.047x + 204.9
Days Into Spring Transition
0
3
6
9
12
15
External N Uptake ,
μ
g
0
100
200
300
400
500
600
Control
Old Roots
New Roots
Figure 8. Total uptake from 15N pool by phytomers having complete root system (dotted line), new root system only (hollow circles), or old root system only (solid circles). Error bars denote one standard error of the mean.
Days into Spring Transition
1
3
6
10
14
External
15
N Uptake ,
μ
g g
-1
root dry mass
0
5
10
15
20
25
Old
New
Complete
a b
a b
c
a b
c
Control
Days into Spring Transition
0
3
6
9
12
15
Shoot Dry Weight , mg phytomer
-1
0
2
4
6
8
10
12
14
16
18
Control
node+ internode
node only
Figure 10. a.) Shoot dry matter production in treatments lacking roots. Treatment 5 (node only) represented by solid circles, and treatment 4 (node and internode) represented by hollow circles. Error bars represent one standard error of the mean.
0 3 6 9 12 15
Shoot N ,
μ
g
ph
y
tomer
-1
0 50 100 150 200 250 300
Total N
14N Pool
15N Pool
Days into Spring Transition
0 3 6 9 12 15
Shoot N
,
μ
g phytom
er
-1
0 20 40 60 80 100 120 140 160 180
Total N
14N Pool
15N Pool
a b
a b
c d e
Figure 12a-e. a.) Surface view of experimental hydroponics unit containing
bermudagrass tissue treatments. b.) View from underneath experimental hydroponic unit with old and new roots extending through mesh bottoms of containers. c,d,e.) Treatment 3, treatment 2, and treatment 1, respectively.
CHAPTER II
SEASONAL CHANGES IN NITRATE ASSIMILATION EFFICIENCY OF A BERMUDAGRASS SYSTEM
ABSTRACT
Pressures to protect water quality and water shortages are leading to increased
applications of effluent water on turfgrass systems. In the southeastern U.S., there is a
need to more thoroughly understand nitrogen use efficiency by bermudagrass, the
turfgrass most often involved with effluent dispersal. The purpose of this series of
experiments was to investigate changes in NO3-assimilation efficiency in ‘Tifway’
bermudagrass during different seasons of the year as it moves through growth and
dormancy cycles. A model system used bermudagrass turf/soil cores obtained from field
plots that were placed in controlled environment chambers and fed solutions containing
40 A% 15N-NO3-. Periodic leaching and sampling of plant tissues and soil over 16 days
revealed that NO3- uptake was, as expected, highest in summer months when plants were
growing rapidly, as ~ 67% was taken into the plant within 3 days and >80% within 10
days. Even though the microbial population was elevated, little 15N could be found in the
soil microbial or organic fractions. The system was very inefficient in winter months
when bermudagrass was dormant, as ~80% to 90% of the NO3- remained in soil for the
duration of the 16-day experiment. The assimilation patterns were very different during
the transition months of May and October. The 15NO3- assimilation efficiency was higher
than expected, with ~80 to 90% assimilated within 1 week, even though little
30
sequestered belowground in rhizomes and roots and also in soil microbial and organic
fractions. The apparent competitiveness of the microbial population was noticeably
higher than that during rapid bermudagrass growth. Although differences in competitive
interactions could be distinguished during various seasons, bermudagrass roots were
consistently more competitive than the microbial population for applied 15NO3-, an
INTRODUCTION
Grass systems have long been utilized for disposal of animal waste in the
southeastern U.S. Traditionally, this has involved applications of effluent generated from
the anaerobic lagoons of farming operations onto nearby pastures (Burns et al., 1990). In
recent years, landscape dispersal of effluent generated from municipal waste treatment
facilities also has become common. The main drivers for this are legislation to protect
water quality and water shortages usually resulting from population growth (refer to
Harivandi, 2004). Applying effluent to the landscape allows filtering of potential
contaminants by the vegetation, and it provides an alternative irrigation source. Because
of the extensive acreages available and a need for irrigation, managed turfgrass systems
are often being used as effluent dispersal sites.
Bermudagrass (Cynodon ssp.) is widely utilized in turfgrass systems that receive
effluent throughout the southern U.S. From observations with other grass and pasture
systems (Dillaha et al., 1989; Magette et al., 1989; Burns et. al, 1990; Lowrance and
Sheridan, 2005), it is known that bermudagrass can efficiently take up (i.e. filter) large
amounts of NO3- and P in applied effluent, which evidently are the primary causes of
water quality degradation (Carpenter et al., 1998). Bermudagrass is a warm season grass,
however, that is adapted to tropical and subtropical climates (Taliafarro, 1995).
Throughout much of its growth range, it enters dormancy as winter approaches and may
remain dormant for up to half of the year. Because bermudagrass cycles between growth
32
considerably. Indeed, variations in leachate NO3- concentrations have been observed
when bermudagrass received fertilizer or effluent during different times of the year
(Snyder et al., 1984; Thomas et al., 2006). Large seasonal variations in NO3- uptake have
frequently been observed with cool season grasses (Brown et al., 1982; Miltner et al.,
1996; Liu et al., 1997; Frank et al., 2006).
The emergence of the effluent application issue highlights the need for
understanding seasonal changes in NO3- uptake by bermudagrass managed as a turfgrass.
The present work was designed for that purpose. A model system was developed that
involved turf/soil cores removed from bermudagrass plots in the field and feeding of a
relatively high level of 15N-NO3-. The approach allowed evaluation of changes in NO3
-uptake efficiency and fate of 15N within different plant and soil fractions during different
growth and dormancy cycles.
Of particular interest were interactions of bermudagrass with the soil microbial
fraction. Past studies with annual grasslands and pasture grasses have indicated that soil
microbes are capable of rapidly acquiring (immobilizing) a large portion of applied
fertilizer nitrogen (Jackson et al., 1989; Kaye and Hart, 1997; Davidson et al., 1990).
Often times, soil microbes release N after several days and weeks, serving as a temporary
reservoir or ‘storage pool’ for N. It is unclear whether this storage pattern exists when
bermudagrass is managed as a turfgrass, but it could have important implications for N
MATERIALS AND METHODS
This study was carried out over two years (August 2004- May 2006). Turf/soil
cores were periodically harvested from a six-year old stand of ‘Tifway’ bermudagrass
(Cynodondactylon (L.) Pers. X C. transvaalensis Burtt Davy) at the Sandhills Research
Station, Jackson Springs, NC. The bermudagrass was growing on a native sand-textured
soil (91% sand, 6% silt, and 3% clay; sandy thermic Arenic Kanhapludult). The plot was
maintained at fairway height (~1.9 cm) and received a granular, complete fertilizer.
Yearly N additions of 147 kg N ha-1 were split into three equal applications at six-week
intervals from mid-May through early September. Organic matter content for the 0-15
cm depth of soil was ~1.5%, soil CEC was 3.9 meq 100 cm-3, and pH was 5.9.
The turf/soil cores were removed from the field plot using a soil-sampling tool
and cylinders (AMS Inc., American Falls, ID), which allowed a 5 cm diameter x 15 cm
deep core to be removed from the field plots with minimal disturbance. Cores were
obtained from the plot periodically during the growth and dormancy cycle: early May,
early August, mid-October, and mid-January (refer to fig. 2). Prior to each core removal
event, irrigation was applied to the turf to prevent wilting during transfer.
Twenty-four turf/soil cores were moved into growth chambers in the Southeast
Plant and Environment Laboratory on the N.C. State University campus at each specified
time during the year. Transfer occurred within 24 hours of removal from the field plots.
Chamber conditions were programmed to simulate existing field conditions at that time
34 Records Database (refer to Table 1).
Experimental Approach
A thin fiberglass filter disk was placed at the bottom end of each core cylinder to
prevent soil loss during leaching. A tight-fitting 5 cm female PVC bushing (Lasco
Fittings, Inc., Brownsville, TN) was fitted onto the cylinder bottom. A ¼” I.D. threaded
coupler was fitted into the bushing opening, providing an air-tight connection between
the core and polypropylene drain tubing. The cores were then set into 5 cm diameter
openings in the top of a 52cm x 30cm x 30cm PVC box, with only the top 1 cm of cores
exposed to light. Thus, bermudagrass shoots and the soil surface were open to the
chamber environment, but light exposure to the below ground portions was blocked. The
drain tubing was connected to a manifold on the box exterior, which in turn was
connected to a vacuum pump. With an inline vacuum gauge, the vacuum pump provided
a tension of 0.15 bars evenly distributed over all cores, which approximates field capacity
for sands. Each core was connected to 125 ml Erlenmeyer flasks by the drain tubing,
allowing collection of leachate from individual cores.
On the first day of a 7 day pretreatment period, the turf/soil cores were watered
heavily, followed by an immediate application of vacuum to bring the soil to field
capacity. Twenty-four hours later, 33 ml of a complete nutrient solution containing 2.5
mg NO3--N was applied to the grass at the top of each core; equivalent to 1.2 g N m-2
applied in 1.5 cm of water. The cores were maintained at or slightly below field capacity
by replacing water lost through ET on a daily basis (based on average water mass loss
flushed with 500 ml (~3 pore volumes) of re-distilled water and drained under vacuum.
This removed residual soil NO3- prior to the start of the experiment. Preliminary
experiments indicated that this volume removed > 95% of the residual soil NO3- from the
soil (data not shown). Water was withheld on day 7 to allow soil moisture to decline
below field capacity in preparation for application of 15N solutions.
15N Pulse-Chase
At the onset of the experimental period, the bermudagrass was clipped and 15NO3
was applied at 9.9 mg N per core (4.9 g N m-2) in 33 ml of solution. Sets of turf/soil cores
were harvested periodically over the next 16 days to determine the fate of the applied 15N.
Sample processing involved first flushing each core with 500 mls of re-distilled
water, aided by the 0.15 bar tension. The tension was applied until leachate ceased to drip
from the turf/soil cores (~10 minutes). The leachate was frozen until further analysis.
Next, bermudagrass shoots were cut at 1.9 cm, with the clippings dried and weighed to
determine growth. The remaining plant and soil material was removed from the core
sleeve. Verdure (remaining above ground biomass) was excised cut at the soil surface
and rinsed with 1.0 mM CaSO4 to remove residual NO3-. Rhizomes and roots were
separated from soil by hand, with root capture enhanced by use of a 2 mm sieve. The
rhizomes and roots were then rinsed in 1.0 mM CaSO4 as before. All plant tissues were
oven dried at 65˚C for 72 hours and weighed. Dried plant samples were then milled to a
fine powder, encapsulated in tin capsules, and analyzed for total N and A% 15N using a
36
Following removal of plant tissues, soil was thoroughly homogenized and
subsampled for analysis of soil inorganic 15N, microbial biomass 15N, dissolved organic
15N, and 15N in the solid fraction of soil organic matter (Fig. 1). Soil NO
3- was extracted
with 0.5 M K2SO4 and determined colorimetrically using a Lachat flow injection
autoanalyzer (Lachat Instruments, Milwaukee, WI). A diffusion method was used to
prepare samples for 15N analysis (Stark and Hart, 1996).
Microbial biomass 15N was determined by the CHCl3 fumigation-extraction
procedure (Brookes el al., 1985). Briefly, 15 g moist soil samples were fumigated with
CHCl3 for 24 hours and extracted with 0.5 M K2SO4. Soluble N was oxidized to NO3
with alkaline persulfate (Cabrera and Beare, 1993). Total NO3-N of the extracts was
determined colorimetrically. All extracts and samples were then analyzed for total N and
% 15N using the diffusion procedure described above. Microbial biomass N was
calculated by dividing the N flush, i.e., the difference between fumigated and
unfumigated samples, by an extraction coefficient of 0.54 (Brookes et al., 1985).
After fumigation-extraction, two additional 0.5 M K2SO4 extractions were
performed on these soil subsamples to thoroughly remove any remaining soil NO3-.
These soil samples were then analyzed for total N and 15Nas described previously. The
N in these samples represented the solid fraction of soil organic nitrogen.
RESULTS
The seasonal growth pattern of bermudagrass was established based on clippings
cores were removed. Acceleration to the most rapid growth coincided with mean soil
temperatures reaching ~ 28 °C (refer also to Lee et al. 2003). On the other extreme,
bermudagrass was completely dormant at the January sampling and no clipping mass
could be collected. In May, a solid green cover was present even though little vertical
growth was detectible with the clipping harvest. The bermudagrass was still green in
October, but vertical shoot growth was even lower than in May. Overall, the sampling
‘windows’ provided cores with bermudagrass in very different growth states.
Seasonal leaching of NO3
-From the amount of applied NO3- recovered in leachate with the August cores, it
was evident that NO3- was efficiently assimilated (Fig. 3). Of the 10.0 mg of NO3
-applied added to the columns, only ~3.0 mg could be recovered with the washout after
one day, < l.0 mg on day 3, and < 0.2 mg after the first week. Assimilation of NO3- was
markedly lower with cores taken in January, with 7.4 to 8.2 mg of NO3- recovered in
leachate throughout the 16 day experiment. The efficiency of NO3- assimilation in cores
from the transition periods in May and October was noticeably lower than that in August
during the first week after NO3- addition. Nonetheless, NO3- was steadily assimilated in
cores taken in May; only very low amounts were detected after the first week. With cores
sampled in October, NO3- in leachate followed a similar pattern. Some nitrate could be
detected in leachate after the first week, but low amounts (~ 1 to 1.5 mg) were washed
38
Rapid Growth - August
At four of the sampling dates, the applied NO3- was labeled with 40 A%15N.
Thus, columns being supplied with 10 mg of N were receiving 4 mg of 15N. As is most
often the case with 15N experiments of this type, the total amount of 15N recovered in
plant, soil, and leachate fractions was variable. Thus, the fate of applied 15N is most
easily seen when data in individual fractions are expressed as a % of the 15N recovered in
the column (cf. Bristow et al. 1987; Jackson et al. 1989; Horgan et al. 2002; Dell and
Rice 2005).
On day 1, about 3023 μg of 15N were recovered in the grass and soil fractions, and
48% of the recovered 15N was in plant and soil fractions other than the inorganic (Table
3, bold). About 42% of the recovered label was in plant tissues, and that percentage
increased steadily to 67% on day 3, 83% on day 10, and 90% on day 16. The proportion
of the recovered 15N in shoots of plants increased as the 15N chase period progressed,
from 15% on day 1 to 49% on day 16. About 20-25% of the recovered 15N was
consistently present in rhizomes. Root 15N tended to increase with time from 6% to
18-20%.
The microbial soil fraction contained about 7 to 8% of the recovered 15N through
day 10, after which the percentage dropped by half. The solid and dissolved soil organic
matter fractions in the soil contained little of the 15N present in the cores, always < 4% of
the label in the system.
Dormancy - January
bermudagrass shoot growth occurring. The 15N distribution patterns were very different
than that in August, as a much smaller amount of 15N was found in plant tissues (Table
4). Most of the plant 15N accumulated in rhizomes, and none was found in shoots over
the course of the experiment. The % of the recovered 15N present in the soil microbial
fraction was always low (< 3%), until the last sample date when the microbial fraction
contained 7% of the 15N label.
Transitions – May and October
The May samples were representative of Spring transition from dormancy to rapid
growth. A substantial amount of recovered 15N (~ 70 to 75%) was present in the
bermudagrass plants after week 1 (Table 5). In contrast to the 15N accumulation patterns
in August, however, a smaller portion of the 15N was found in shoot tissues (<30%),
coinciding with the low clipping yields (cf. Fig. 2). Rhizomes and roots accumulated
about the same portions of recovered 15N as in August, with rhizomes being the main
tissues accumulating 15N, particularly early in the experiment.
The soil microbial fraction contained somewhat greater proportions of recovered
15N than in August and January, with values ranging from 8 to 11% after day 3. 15N in
the solid and dissolved organic matter fractions also were somewhat elevated compared
to the other months.
The October samples represent the seasonal transition from active growth to
dormancy. With the exception of the dormant turf in January, 15N accumulation by
bermudagrass was lowest in October (Table 6). Although 21% of the recovered label
40
This reflected lower 15N accumulations in all the plant parts, compared to the proportions
of 15N recovered in the plant parts in August and May.
The decline in 15N accumulation in bermudagrass in October coincided with
higher accumulations in the soil organic fraction. The microbial fraction 15N was similar
to that in May, containing 8 to 12% of the recovered 15N from days 7 to 16. The 15N in
the solid organic soil fraction was elevated, accounting for 7 to 11 % of recovered 15N.
The result was that the total 15N accumulation in the organic fraction approached 25%,
which was noticeably higher than that at other times of year.
Whole Plant Distributions of 15N
From data presented in Tables 3 – 6, it is apparent that absorbed 15N was
distributed differently within the plants in the different seasons. The main seasonal effect
was a change in the proportion of whole plant 15N that was accumulated in shoot tissues.
Re-calculation of the 15N data from the bermudagrass plant, separate from the soil and
leachate fractions, reveals that the proportion of the whole plant 15N accumulated in the
shoot was greatest during August, when plants were growing rapidly (Fig. 4), and lowest
in January when plants were dormant and almost all of the 15N taken up was retained
below ground in rhizomes and roots. The individual data points for the months of May
and October show, however, that shoot accumulation of 15N was noticeably lower than in
Microbial Activity
As part of the 15N analyses, measurements were made of total microbial biomass
N (14N + 15N; Table 3). It can be assumed that total microbial biomass N is correlated
with microbial population size. The total N measurements indicate that microbial N was
much larger in August than in other months (Fig. 4A). The mean values for all sample
dates for each season were 48 in August, 22 in January, 14 in May, and 13 in October.
Using microbial biomass N as an estimate of the microbial population size, one
can calculate a microbial activity index that reflects how effectively the microbial
population competed for applied 15N with the bermudagrass plants. Microbial
assimilation of 15N first involves accumulation by the microbes themselves and then
release into the soil organic N pools. Thus, the best estimate of 15N assimilation by soil
microbes is the entire organic fraction. Expressing organic 15N per mg of total microbial
N (i.e. microbial population) indicates that the most effective microbial activity was in
the transition months of May and October (Fig. 4). Microbial assimilation of 15N was low
in August, when the population was high, and very little occurred in January when
temperatures were very low.
DISCUSSION
The main purpose of these experiments was to determine seasonal changes in
NO3- uptake efficiency in a bermudagrass system. The leachate analyses and the 15N
42
and January, one period when bermudagrass was growing rapidly and NO3- assimilated
efficiently and the other when bermudagrass was dormant and NO3- capture was low.
One of the most interesting observations was that NO3- uptake and 15N retention by the
system was relatively high in the transition periods of May and October, when vertical
shoot growth of bermudagrass was relatively low. As discussed below, the N fate profiles
during transitions were noticeably different than in other times of year, and also from
each other.
Various studies have indicated that bermudagrass is highly efficient in taking up
NO3- when growing rapidly. That was the case in constructed field plots (Snyder 1984)
and lysimeters in a greenhouse (Bowman et al. 2002), and is implied by the very low
levels of NO3- found beneath bermudagrass in situ on golf course fairways (Lee et al.
2003). The general caveat has been that fertilizer additions must not coincide with excess
rainfall or irrigation, which would increase the likelihood of leaching (Snyder et al.,
1984). As shown in the 15N recoveries in our experiments, the high capture efficiency of
the system reflects, primarily, uptake by the bermudagrass roots and incorporation of N
into shoot tissues. Leachate analyses indicated that little NO3- could be washed out of the
columns after 3 days, and almost 70% of the recovered 15N was in the plant after 3 days
and greater than 90% after 2 weeks. The majority of the remaining 15N was present in
organic fractions. Leaching studies with 15N and cool season turfgrass species have found
similar results. When perennial ryegrass, tall fescue, and creeping bentgrass were
growing under ideal conditions, almost all of the soluble fertilizer N was assimilated by
of 15N-labelled ammonium sulfate to Kentucky bluegrass and perennial ryegrass turf
resulted in minimal nitrogen movement below the root zone (Engelsjord et al., 2004).
Our results indicate that bermudagrass takes up NO3- at a somewhat slower rate
during the transition months, but > 90% of added NO3-N was assimilated after one week
in cores from May, and 80% was assimilated by the end of two weeks with cores from
October. In both cases, there was greater retention of absorbed NO3-in below ground
plant tissues and soil organic fractions compared to that in August.
It is likely that two physiological factors are responsible for the high uptake
efficiency of bermudgrass in August. First is the very high root length density, which
allows full access to water and mobile nutrients within the rhizosphere volume (Bowman
et. al 2002). It has been estimated that a mature turf may possess more than 100,000 roots
and 1 million root hairs per liter of topsoil (Dittmer 1938). The second factor is the high
activity of the NO3- uptake system. Even with fertilizer N additions like that supplied in
our experiments, bermudagrass and other turfgrasses are generally growing far below
their maximal capacities and thus are N deficient (Bowman 1989). Uptake of NO3- per
unit of root is strongly regulated by an internal feedback control system that coordinates
plant growth potential and acquisition (Clarkson 1986; Imsande and Touraine 1994;
Glass 2003). With a sub-optimal N supply, NO3- transporters at root cell membranes
would be expected to be de-repressed and able to rapidly take up NO3- as molecules
approach the root surface. The 15N accumulation pattern during transition months
indicates that bermudagrass had the ability to efficiently take up NO3-, but the
44
vascular tissues was restricted. Cause and effect are always difficult to sort out in this
type of response, but it is known that xylem transport is a sensitive control point in
feedback responses (Pitman 1977; Rufty 1997). It is conceivable that xylem transporters
could be responding to signals originating in the shoot, where vertical shoot growth may
be limited by the number of active nodes in the less than ideal conditions, or they could
be responding to cool temperatures in the root zone, which are known to inhibit
movement of substances upward (Rufty et al. 1981; Engels et al. 1992).
Microbial N Assimilation
Most available evidence indicates that soils beneath turfgrasses contain relatively
high levels of organic matter and high microbial activity (for a recent review, see Shi et
al. 2007). This results from rapid plant growth rates (i.e. high primary productivity),
cycling of clippings (Shi et al. 2006a), and substantial allocation of plant mass to below
ground structures (Kaye et al. 2005). With turfgrasses in general, organic matter (Qian
and Follet 2002; Qian et al. 2003; Bandaranayake et al. 2003) and microbial biomass
(Kaye et al. 2005) increase with age of the turfgrass system; a relationship that clearly
holds with bermudagrass (Shi et al. 2006b).
The changes in microbial biomass N in our experiments indicate that the
microbial population beneath bermudagrass turf varied during the year. Much larger
microbial biomass N levels were present in August cores, presumably reflecting the high
rate of carbon generation in the system. Yet, 15N capture by microbes, estimated by the
and October. The implication is that the microbial population was less competitive for
available 15NO3- than roots and rhizomes during bermudagrass’ rapid growth phase. It
logically follows that higher indices in May and October reflected decreased
bermudagrass competitiveness.
Regardless of the time of year, the proportion of the 15N associated with microbial
activity was noticeably lower than that observed in experiments with other grass systems.
Studies with 15N have not always measured the same soil components, so direct
comparisons are not as precise as one might prefer. Estimates from 15N in the microbial
biomass alone have indicated an initial assimilation of 37% in an established ryegrass
sward (Bristow et al. 1987), 37 to 61% in a native grassland savanna (Jackson et al.
1989), and 35 to 80% in a natural tall grass prairie (Dell and Rice 2005). All were much
higher than the 13% found in our experiments when the microbial fraction is considered
alone, and the 15N proportion was still less than < 20% if the entire organic fraction is
taken into account (with one exception in October). This observation again suggests that
the below ground structures in bermudagrass turf out-compete microbes for available
NO3-. In addition, there was no evidence of a decline in the 15N microbial pool with time,
as has been observed in some other studies. Once assimilated by the microbial system,
15N remained relatively stable in the microbial fraction itself or the downstream soil
organic fraction at least over the time frame of our experiments. Some caution is required
when considering these observations. The bermudagrass stand was relatively young,
having been established for about 6 years at the time the experiment began. It is
46
advance age when soil organic matter and the microbial population would have been
larger (Shi et al. 2007).
Implications for Effluent Dispersal
It is difficult to extent the results of these experiments, quantitatively, to situations
where effluent is being applied in the field. Nonetheless, the evidence does support a
couple of basic observations. The nitrogen load on bermudagrass will reflect N in effluent
and N applied in fertilization (Thomas et al. 2006). The amount added to cores was ~
equivalent to that added during individual fertilizations. Because of the low amount of
assimilation of NO3-, it is clearly inappropriate to apply effluent during dormancy
because of environmental concerns. Although this may seem obvious, few studies of this
type have been conducted previously, and with the year-round generation of effluent, it
can be tempting to disperse effluent year-round as well. From our results, it is also is
evident that substantial amounts of effluent can be applied during transition periods when
bermudagrass growth is slow. Other than during dormancy, the results of our experiments
clearly indicate that bermudagrass has the capability of assimilating large amounts of N
and the ability may well extend into transition months when little vertical shoot growth is
occurring. We cannot know what repeated applications over weeks or months might do to
the bermudagrass uptake efficiency, a question that will require additional
experimentation.
REFERENCES CITED
Bandaranayake, W., Y.L. Qian, W.J. Parton, D.S. Ojima, and R.F. Follett. 2003. Estimation of soil organic carbon changes in turfgrass systems using the CENTURY model. Agron. J. 95: 558-563.
Bowman, D.C., C.T. Cherney, and T.W. Rufty, Jr. 2002. Fate and transport of nitrogen applied to six warm-season turfgrasses. Crop Sci. 42:833-841.
Bowman, D.C., J.L. Paul, W.B. Davis, and S.H. Nelson. 1989. Rapid depletion of nitrogen applied to kentucky bluegrass turf. J. Amer. Soc. Hort. Sci. 114(2):229-233.
Bristow, A.W., J.C. Ryden, and D.C. Whitehead. 1987. The fate at several time intervals of 15N-labelled ammonium NO3- applied to an established grass sward. J. Soil. Sci. 38:245-254.
Brookes. P.C., A. Landman, G. Pruden, and D.S. Jenkinson. 1985. Chloroform fumigation and the release of soil nitrogen: a rapid direct extraction method to measure microbial biomass nitrogen in soil. Soil Biol. Biochem. 17(6): 837-842.
Brown, K.W., J.C. Thomas, and R.L. Duble. 1982. Nitrogen source effect on NO3- and ammonium leaching and runoff losses from greens. Agron. J. 74:947-950.
Burns, J.C., L.D. King, and P.W. Westerman. 1990. Long-term swine lagoon effluent applications on ‘coastal’ bermudagrass: I. yield, quality, and element removal. J. Environ. Qual. 19:749-756.
Cabrera, M.L., and M.H. Beare. 1993. Alkaline persulfate oxidation for determining total nitrogen in microbial biomass extracts. Soil Sci. Soc. Am. J. 57(4):1007-1012.
Carpenter, S.R., N.F. Caraco, D.L. Correll, R.W. Howarth, A.N. Sharpley, and V.H. Smith. 1998. Nonpoint pollution of surface waters with phosphorus and nitrogen. Ecol. App. 8(3): 559-568.
Clarkson, D.T. 1986. Regulation of the absorption and release of nitrate by plant cells: a review of current ideas and methodology. In: Lambers H, Neeteson JJ, Steulen I, eds. Fundamental, ecological and agricultural aspects of nitrogen metabolism in higher plants. Martinus Nijhoff Publishers, 3-27.