ABSTRACT
FRANKOSKY, REBECCA MEGAN. Perceptions of Interactivity - The Roles of User Control and Feedback. (Under the direction of Dr. Douglas Gillan).
The concept of interactivity, or the feeling that interaction creates, has been a topic of
interest in many fields due to its probable importance to create positive and engaging user
experiences, as well as its potential to aid the learning process. Yet, the meaning of
interactivity is conceptually unclear and there is little consensus on exactly what interactivity
entails. Activity theory, a framework recently used within the HCI community, views human
interaction as being mediated by technology and highly dependent on dynamic internal
factors and external contexts. While activity theory is a relevant framework for situating
interaction it does not offer operational definitions of interaction or interactivity. The present
study aimed to contribute to the concept explication of interactivity, through examination
user perceptions of interactivity across different scenario contexts. Specifically, two features
or dimensions, user control and feedback, which are thought to contribute to interactivity
were analyzed. Results show significant positive relationships between both dimensions and
perceived interactivity across all contexts for experimentally manipulated conditions. User
control remained significant for all scenario contexts when using perceptions of user control
as rated by participants. Feedback, when measured as participant perception, was not
significantly associated with interactivity for two of the six contexts. Notably, the strength of
the relationship between user control or feedback in predicting perceived interactivity
depended on the scenario context. In line with activity theory, different scenario contexts
© Copyright 2014 Rebecca Megan Frankosky
Perceptions of Interactivity - The Roles of User Control and Feedback
by
Rebecca Megan Frankosky
A thesis submitted to the Graduate Faculty of North Carolina State University
in partial fulfillment of the requirements for the degree of
Master of Science
Psychology
Raleigh, North Carolina
2014
APPROVED BY:
_______________________________ ______________________________
Dr. Eric Wiebe Dr. Anne McLaughlin
BIOGRAPHY
Megan (Hardy) Frankosky was born in Winston-Salem, North Carolina in 1986. She attended
Forbush High School and graduated in 2005. Megan received undergraduate degrees in
Business and Psychology from North Carolina State University. She has been a North
Carolina State University graduate student in Human Factors & Ergonomics working with
Dr. Douglas Gillan as her academic advisor. Megan has participated in collaborative research
efforts under the supervision of Dr. Eric Wiebe at the Friday Institute of Educational
Innovation. Both her work with Dr. Gillan and Dr. Wiebe allow her to pursue her interest in
ACKNOWLEDGMENTS
I think it is important to recognize that in life, it is not only about the product, but also the
process. This process has been so very crucial to my personal, academic, and professional
growth and I am very lucky to have had this opportunity. Neither the product nor process
would have been possible without the help of a handful of people whom I am very grateful to
have met. First, to my husband, whose unwavering support is why I made it. To my advisor,
Dr. Doug Gillan, without our many conversations this would not have came to fruition, thank
you for taking me in and allowing me to follow the many paths that my mind takes me on. To
my second advisor, Dr. Eric Wiebe, your thoughtful questions are always essential to
planning and implementing my ideas and I greatly appreciate your trust and support in my
abilities. Finally, to Dr. Anne McLaughlin, who allowed me to be a part of her lab as an
undergraduate, the event that started this whole process. Working and talking with you has
TABLE OF CONTENTS
LIST OF TABLES ... vi
LIST OF FIGURES ... vii
PERCEPTIONS OF INTERACTIVITY - THE ROLES OF USER CONTROL AND FEEDBACK ... 1
Introduction ... 1
Interactivity: Does it matter? ... 1
What does it mean to Interact? ... 3
Study Overview... 11
Hypotheses ... 12
Method ... 12
Participants ... 12
Materials ... 14
Design ... 14
Procedure ... 17
Results ... 18
Manipulation Checks... 18
Models Predicting Perceptions of Interactivity ... 23
Discussion ... 39
Implications ... 42
Future Work ... 43
APPENDICES ... 50
Appendix A. Scenario Manipulations of User Control and Feedback ... 51
A.1 Information Visualization / Graphing System ... 51
A.2 Distance Learning Environment ... 52
A.3 Avatar Selection within a Game ... 53
A.4 Virtual Reality – Navigation within a virtual environment ... 54
A.5 Text Messaging System on a Mobile Device ... 55
A.6 Response Device System within a Classroom ... 56
Appendix B. Scenario Context Descriptions and Features of the System ... 57
B.1 Information Visualization / Graphing System ... 57
B.2 Distance Learning Environment ... 59
B.3 Avatar Selection within a Game ... 61
B.4 Virtual Reality – Navigation within a virtual environment ... 63
B.5 Text Messaging System on a Mobile Device ... 64
B.6 Text Messaging System on a Mobile Device ... 66
Appendix C. Study Materials ... 68
C.2 Demographic Survey Items... 70
C.3 Computer Familiarity Survey ... 71
C.4 Context Familiarity Ratings ... 72
LIST OF TABLES
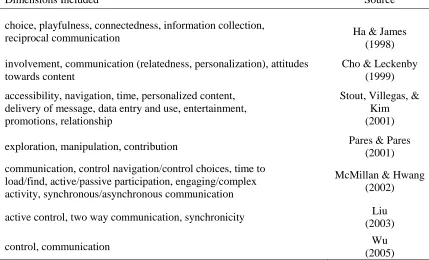
Table 1. Dimensions included in various models of perceived interactivity. ... 9 Table 2. Demographics of Participants ... 13 Table 3. Computer Familiarity & Ability Ratings on a Five-Point Likert Scale. ... 13 Table 4. Effects Summary for Measurement Check ANOVA’s of Perceived User Control and
Feedback for Condition and Scenario Context ... 22 Table 5. Main Effects Summary for the Perceived Interactivity ANOVA’s with Categorical
User Control and Feedback Conditions, and Scenario Context ... 27 Table 6. Effects Summary for Perceived Interactivity ANOVA’s with Categorical User
LIST OF FIGURES
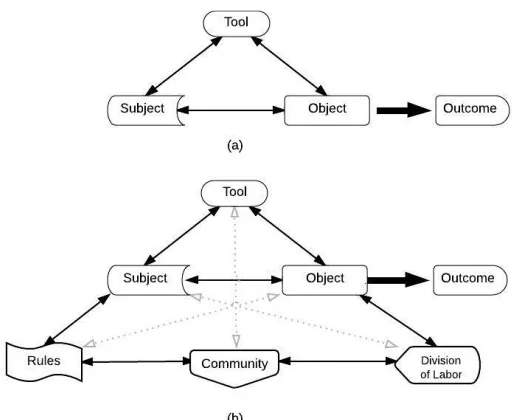
Figure 1. Activity Theory framework. (a) Diagram showing the relationship between the subject and object being mediated by the tool used, and (b) diagram expanded to include the societal context/community, rules, and division of labor ... 4 Figure 2. Example of scenario within the information visualization context. Feedback and
User Control manipulations are included in the “Features of the system”, participants used sliders to rate perceived levels of all variables ... 15 Figure 3. 3 x 3 within subjects design manipulating feedback and control within contexts that
do allow for the absence of feedback (information visualization, distance learning
environment, avatar creation within game) ... 16 Figure 4. 3 x 2 within subjects design manipulating feedback and control within contexts that
do not allow for the absence of feedback (virtual reality navigation, text messaging system, response device within a classroom) ... 16 Figure 5. Complete study design, each participant received randomized levels of feedback
and user control within 6 scenario contexts. Three scenario contexts with no feedback conditions, and three scenario contexts without a no feedback condition ... 17 Figure 6. Significant differences in perceptions of user control across and feedback
conditions for scenario contexts that did not include no feedback conditions (virtual reality, text messaging, and response device) ... 19 Figure 7. Significant differences in perceptions of user control across and feedback
conditions for scenario contexts that included no feedback conditions (information visualization, distance learning, and avatar creation) ... 20 Figure 8. Differences in perceptions of user control and feedback across conditions for each
scenario context ... 21 Figure 9. Significant differences in perceptions of interactivity across user control and
Figure 10. Significant differences in perceptions of interactivity across user control and feedback conditions for scenario contexts that included no feedback conditions
(information visualization, distance learning, and avatar creation) ... 25 Figure 11. Differences in perception of feedback and user control across conditions for each
participant. ... 29 Figure 12. Differences in perception of interactivity for perceptions of user control and
feedback with all scenario contexts considered ... 30 Figure 13. Differences in perception of interactivity for perceptions of user control and
feedback within the avatar creation scenario context ... 33 Figure 14. Differences in perception of interactivity for perceptions of user control and
feedback within the distance learning scenario context ... 34 Figure 15. Differences in perception of interactivity for perceptions of user control and
feedback within the information visualization graphing scenario context ... 35 Figure 16. Differences in perception of interactivity for perceptions of user control and
feedback within the response device scenario context ... 36 Figure 17. Differences in perception of interactivity for perceptions of user control and
feedback within the texting scenario context ... 37 Figure 18. Differences in perception of interactivity for perceptions of user control and
PERCEPTIONS OF INTERACTIVITY - THE ROLES OF USER CONTROL AND FEEDBACK
Introduction
The concepts of interaction and interactivity have been widely used and researched in a variety of academic fields including; human computer interaction, educational psychology, curriculum and instruction, psychology, media studies, marketing, communication, and design (Adiele, 2008; Beauchamp & Kennewell, 2010; Brady, 2004; Burgoon et al., 2002; Evans & Gibbons, 2007; Jensen, 2008; Kiousis, 2002; Moreno & Mayer, 2007; Roussou, 2004). Attention devoted to understanding the underpinnings of the multidimensional concepts of interaction and interactivity arise, in part, from the potential that these concepts have in creating a positive user experience, engaging a user, and aiding the learning process (Beauchamp & Kennewell, 2010; Kettanurak, Ramamurthy, & Haseman, 2001; Park, Lee, & Kim, 2011; D. Richards, 2006; Roussou, Oliver, & Slater, 2007; Roussou, 2004; Sims, 2000; Yamamoto, 2010). Although many researchers agree that interaction and user perceptions of interactivity are important, there is little consensus on exactly what interactivity is (Sims, 1997; Smuts, 2009). What does an interaction entail? Which aspects of an interaction lead to the user perception of interactivity? In what contexts is interactivity more salient and useful? What situational or individual factors might moderate the experience of interactivity? Does interactivity matter?
Interactivity: Does it matter?
interactivity can engage the student or user in an active learning process, encourage an application of knowledge, and promote evaluation of alternative explanations (Cairncross & Mannion, 2001; Schwan & Riempp, 2004). High degrees of interactivity can support
cognitive activities like categorizations and abstractions while processing visual information (Sedig, Parsons, & Babanski, 2012). Brady (2004) indicates that providing opportunities for interaction can increase learning within an educational website. Compared to a
non-interactive version, students who used the non-interactive version of the website had significantly larger learning gains, were more satisfied, and spent more time on the task (Brady, 2004). However, since learners in the interactive group spent more time on the task than the non-interactive group, it is unclear if non-interactive elements were the main contributors to differences in learning between groups, or if time on task was the main contributor. Importantly, interactive technology is only a piece of the picture.
Research suggests that expert implementation of the interactive technology embedded within a teacher’s existing pedagogical strategies is a key factor in producing changes in knowledge (Beauchamp & Kennewell, 2010). Beauchamp & Kenwell (2010) also suggest that integrating interactive technologies generating ‘interactivity’ in a dialogic (collective, reciprocal and supportive) fashion have the greatest potential form improving understanding of material. Interactive environments provide learners with the opportunity to assimilate information and become actively engaged in the material (Domagk, Schwartz, & Plass, 2010; Renkl & Atkinson, 2003). Hart, Sutcliffe, & Angeli (2013) investigated the impact of
interactivity levels (determined both by number of interactive features, and through qualitative analysis of interviews with users) on user perceptions of websites. They found that users held a preference for more interactive websites, and regarded them as well designed. Additionally, affective ratings were more positive for the websites with higher interactivity levels.
Although the results of these studies have shown that the interactivity of a system can influence both the users' cognitive and affective states, there is still the issue that few
What does it mean to Interact?
Interaction Framework: Activity Theory
A field central to the study of interaction between humans and computers, HCI, has been largely void of an acceptable and satisfactory theory of interaction, making it difficult for this interdisciplinary field to focus and direct efforts. In fact, research on the matter falls far behind practice (Kaptelinin, 1996; Kuutti, 1996). However, activity theory, although not strictly a theory, has received recent interest within the HCI community (Kaptelinin, 1996). Activity theory is a framework viewing human interaction as a process highly dependent on dynamic internal factors and external contexts, strongly emphasizing the notion that our experiences and perceptions are shaped by the tools that we use (Kaptelinin, 1996).
At a high level, activity theory provides a framework for situating humans,
message (the object), thus successfully fulfilling their motivation. Furthermore, we know that for this particular activity, the interaction between the user and the tool could be influenced by a myriad of other factors, age, familiarity with the tool, the structure of language used could be influenced by the users background and experiences. In response to this facet of an interaction, activity theory also extends to the social context of the interaction. The
community, a group of people with similar objectives, are governed by certain societal (or other) rules, and can split actions, creating a division of labor (refer to Figure 1b). Indeed, activity theory provides a holistic framework to view interactions, not only framing the relationship between humans and their objects (or goals) as being mediated by the technology that is available, but also including the role of the social factors.
Figure 1. Activity Theory framework. (a) Diagram showing the relationship between the subject and object being mediated by the tool used, and (b) diagram expanded to include the societal
Activity theory may provide a relevant framework to situate types of activities and interactions, particularly those that involve computers as a tool and are encompassed within social contexts, it does not offer a definition of interaction, nor expand upon what aspects of the tool (or technology) are more (or less) conducive to creating an “interactive” environment and contribute to users perceptions of the interactivity of the tool. Several extensive reviews have proposed theoretical conceptualizations of interaction and interactivity (see Bucy & Tao, 2007; Jensen, 1998; Kiousis, 2002; Liu & Shrum, 2002; R. Richards, 2006; Sundar, 2004). Although most researchers agree that interactivity is a multi-dimensional concept (e.g. Ha & James, 1998; Jensen, 1998; Mcmillan, 2002; Heeter, 1989), the operational definition of interactivity varies, if it is provided at all. For example, Brady (2004) defined interactivity as a “form of cognitive engagement influenced by structural aspects of the medium
(computer)” (p. 3), whereas Jensen (1998) defined interactivity as “a measure of a media’s potential ability to let the user exert an influence on the content and/or form of the mediated communication” (p. 201), and Rafaeli (1988) defined interactivity as “a variable
characteristic of communication settings… an expression of the extent that in a given series of communication exchanges, any third (or later) transmission (or message) is related to the degree to which previous exchanges referred to even earlier transmissions” (p. 111). Some researchers agree that interactivity shares basic dimensions, yet theoretical consensus on the concept is largely absent (Kiousis, 2002, p. 357). Disagreement and ambiguity of a definition of interactivity within fields makes it difficult to move inquiry forward and does little to bridge the gap between empirical research being done and the applications of that research within the fields of design and education.
of interactivity. Furthermore aspects of interactivity are often referred to by various names (embodied interaction, computer-mediated interaction, or movement-based interaction) with slightly different contexts. McMillan, (2006) points out that the meaning of interactivity may be dependent on its context. (p. 205). Absence of a consistent operational definition
combined with a range of terms that potentially refer facets to the same concept, and overuse of the term in popular media contributes to an avoidable tautology of a concept that, because of its potential relationship to learning, deserves proper explication. The following literature review serves to identify terms that previous literature point to as being essential to
interactivity. First, perspectives through which many researchers have framed their view of interactivity will be explained. For the purpose of this paper, emphasis will be placed on perceived interactivity. Second, concepts that appear as dimensions that comprise interactivity in multiple definitions or theories will be described.
The lenses through which researchers typically view interactivity present perspectives from each end of the human-computer interaction. On one end, there is the technology; it affords certain opportunities to influence the quality and nature of the interaction. On the other end, there is the user, whose individual experiences, preferences, and current state influence the quality and nature of the interaction. Given that you cannot have an interaction without considering both perspectives, it is common (and sensible) that the technology is developed around the user. For that reason, this paper takes a user-centered approach, focusing on perceived interactivity.
Perspectives of Interactivity
One potential problem with viewing interactivity only through this lens is that technology is constantly evolving. Durlak (1987), in his typology of interactive media, mentions technology such as the telephone, email, “and computers used for communication” (p. 743) as interactive media, whereas, more recent research identifies virtual reality
environment, (Roussou, 2004), and touch screens (Park et al., 2011). Improvements in technology create a moving target for researchers who base their definition of interactivity within the technology itself. Not only do the affordances of evolving technology expand, they can also blur the line between machine and user. Admittedly, Durlak (1987) concedes that "[o]ne of the difficulties in focusing on 'interactivity' is that it is becoming more difficult to find out where, for example, hardware ends and software/tools or people begin" (p. 745).
Another problem with only looking at interactivity from this perspective is that it ignores the cognitive and affective components of the interaction (i.e. the human experience). Most technologies allow for physical interaction, yet “while some type(s) and amount of required physical activity always exists, cognitive and affective activity involved to make sense of the technology, the content, and the overall experience also always exists”
(Reinhard, 2011, p. 354). Contrary to Manovich’s (2001) opinion that all computer-mediated environments are interactive, it is likely that the cognitive and affective experience of the user influence the experience interactivity regardless of the affordances provided by the technology. Additionally, the activity theory framework emphasizes the importance of
viewing tools and technology as mediators, which certainly provide certain affordances to the user but are ultimately only a channel through which the user can achieve an outcome.
Therefore, it is necessary to consider the flip side of the coin – the user, their experiences, perspectives, and opinions related to an interaction.
Perceptually Based Perspective. The level of interactivity influenced by the affordances of the technology and the level of interactivity perceived by users may be different (Heeter, 2000). Technology provides the opportunity or potential for interactivity, yet users must perceive this opportunity for interactivity to exist (Quiring, 2009). For
being interactive, and vice versa (McMillan & Hwang, 2002; Newhagen, Cordes, & Levy, 1995). Adesigner can add ‘interactive’ features, but nothing is gained unless users also perceive this feature as being interactive.
Bucy (2004) proposed that differences in expected interactivity and observed interactivity found in several studies may be due to the location of the phenomena (Rafaeli & Sudweeks, 1998, Stromner-Gallery, 2000). Identifying interactivity as a user experience would be superior to locating the phenomena within the technology itself (Bucy, 2004, p. 347). Similarly, it seems impractical to study the effects of interactive features on user attitudes empirically, or learning outcomes without considering perceptions of interactivity and
possible antecedents to perceived interactivity. In a study evaluating interactivity of websites, Kim, Spielmann, & McMillan (2012) note that the level of web experience that users have may predict the perception of interactivity, however this assumption was not tested. Disparity in interactive features as determined by a researcher or a designer and the user’s perception of interactivity suggest that a user's perception may the best measure of interactivity.
Recently, the perceptual approach to measuring interactivity is increasingly common (Rafaeli & Ariel, 2007).
Dimensions of Interactivity
To answer the question “what is interactivity?”, many researchers identify dimensions that an experience must possess to be considered interactive. Conceptualizations of perceived interactivity include a variety of dimensions ranging from concepts such as playfulness to broad concepts such as communication (see Table 1). Below the dimensions of user control and feedback are described and linked to interactivity. These particular dimensions were selected because they were specifically identified within several models of perceived interactivity and they appear commonly across interactivity literature (Cho & Leckenby, 2999; Ha & James, 1998; Liu, 2003; McMillan & Hwang, 2002; Parés & Parés, 2001; Stout, Villegas, & Kim, 2001; Wu, 2005).
“a measure of a media’s potential ability to let the user exert an influence on the content and/or form of the mediated communication” (Jensen, 1998, p. 201) According to this definition, higher degrees of user control should create a greater perception of interactivity. The addition of user control that allows a user to customize settings or features may increase the level of interactivity as well as provide a better user experience. In learning studies relating to interactivity, researchers vary the control that users have over the system (Mayer & Chandler, 2001). Mayer & Chandler (2001) found that participants who were allowed to control the pace of an animation performed better on transfer tests than participants who were not allowed to control the pace of the animation. However, the relationship between user control and perceptions of interactivity relationship may depend on the context and specific functions of the system.
Table 1. Dimensions included in various models of perceived interactivity.
Dimensions Included Source
choice, playfulness, connectedness, information collection,
reciprocal communication Ha & James
(1998)
involvement, communication (relatedness, personalization), attitudes towards content
Cho & Leckenby (1999)
accessibility, navigation, time, personalized content, delivery of message, data entry and use, entertainment, promotions, relationship
Stout, Villegas, & Kim (2001)
exploration, manipulation, contribution Pares & Pares
(2001) communication, control navigation/control choices, time to
load/find, active/passive participation, engaging/complex activity, synchronous/asynchronous communication
McMillan & Hwang (2002)
active control, two way communication, synchronicity Liu
(2003)
control, communication Wu
Feedback. At the most basic level, any response of a system prompted by user action is considered feedback. This level might also be considered a low level of interactivity prompted by any physical input from the user. At a high level, “feedback is information with which a learner can confirm, add to, overwrite, tune, or restructure information in memory” (Winne and Butler, 1994 p. 5740). Greater quality or more useful levels of feedback may elicit high levels of interaction. Within an interactive environment, users easily receive feedback (Bransford, Brown, & Cocking, 2000). Because of the ease of providing immediate feedback, (combined with the ability of a user to control and fully explore the environment), interactive systems are ideally suited for learning (Domagk et al., 2010).
Interactivity is a widely used term both scholarly and popularly, often without proper explication and inconsistent definitions compared to previous literature (Kiousis, 2002). The use of the term without a proper definition obscures the meaning of interactivity. As a result, it is unclear what ‘interactivity’ means (Jensen, 1998, p. 185). “Interactivity has been
identified as a core concept of new media, yet despite nearly three decades of study and analysis, we scarcely know what interactivity is, let alone what it does” (Bucy, 2004b, p. 373). Concept explication has lagged far behind empirical studies of interactivity.
Some scholars even say that it is futile to refer to computer media as being interactive, because modern human computer interaction is interactive by definition (Manovich, 2001, p. 55). However, one might argue that there are instances involving a computer where a user or learner may not perceive the scenario to be interactive. For
example, a user who has clicked a button one hundred times and got the same feedback each time may perceive this as lacking interactivity, whereas a user who has clicked the button once and received feedback may perceive some level of interactivity. It is shortsighted, and unproductive to consider all modern human-computer interactions as interactive by
Work has been done to consolidate literature on interactivity into a framework
specifying different perspectives of interactivity (Cho & Leckenby, 1999; Ha & James, 1998; Liu & Shrum, 2002; McMillan & Hwang, 2002). However, no consensus on a set of
dimensions that contribute to a model that defines interactivity has been reached. “Despite its obvious value, there has been very limited research that empirically examines interactivity dimensions…” (Chen & Yen, 2004, p. 218). Although, many different conceptualizations of interactivity exist, little or no empirical research has been done to test these
conceptualizations (Bucy, 2004). Literature on user-centered approaches of interactivity is sparse. Particularly, perceptions of interactivity and its potential dimensions and moderating factors have not been investigated in depth.
Study Overview
Without a clear understanding of how and under what circumstances users perceive interactivity, technologies that rely on this mechanism to engage users will continue to operate on ‘intuition’, without evidence that their strategies are actually effective. This study aims to quantify perceived interactivity in terms of the relationship between the dimensions of user control and feedback in order to contribute to the development of a user centered operational definition of interactivity. In order to provide a necessary understanding about these relationships this study had three goals.
The first goal of this study was to examine how two key features, or dimensions, of an interface – user control and feedback – contribute to perceptions of interactivity. The second goal was to determine if these two dimensions contribute to perceptions of
In order to reach goal three, six different scenario contexts ranging across a broad spectrum of technological system interactions were developed. The scenario contexts included (1) an information visualization and graphing system, (2) a distance learning
environment, (3) avatar creation within a game, (4) virtual reality navigation, (4) mobile text messaging system, and (6) response devices used within a classroom. Level of feedback and user control provided by the system were manipulated within each scenario context.
Considering all 6 scenario contexts as a whole the following hypotheses were made.
Hypotheses
H1: User control will have a positive main effect on perceived interactivity. H2: Feedback will have a positive main effect on perceived interactivity.
H3: Individual and joint effects of user control and feedback will generalize across all scenario contexts.
Method Participants
participants. After the elimination of data from these participants, the remaining 49 participants were included in the following analyses (See Table 2 for demographics). Of these 49 participants, ages ranged from 23 to 67 (M = 39.84, SD=11.82). Participants’ self-reported comfort and ability with using computers, the internet and electronic devices in general are included in Table 3.
Table 2. Demographics of Participants
Characteristic N %
Gender
Male 24 48.98%
Female 25 51.02%
Education
High school or equiv. 5 10.20%
Vocational or technical school 3 6.12%
Some college 14 28.57%
Bachelor’s degree 19 38.78%
Master’s degree 7 14.29%
Doctoral degree 1 2.04%
Country of Residence
United States 40 81.63%
Asia 7 14.29%
Europe 1 2.04%
Mexico 1 2.04%
Table 3. Computer Familiarity & Ability Ratings on a Five-Point Likert Scale.
Question Text M SD
How comfortable are you with*:
Using a computer 4.74 0.60
Using the Internet 4.74 0.60
Using Electronic Devices 4.35 1.00
How would you rate your ability with**:
Using a computer 4.49 0.61
Using the Internet 4.53 0.61
Using Electronic Devices 4.04 0.83
*Ratings were on 5 point likert scale ranging from 1 = not at all comfortable to to 5 = very comfortable.
Materials
To investigate the impact that the individual dimensions of feedback and user control have on perceptions of interactivity, 45 scenarios designed to include varying levels of each dimension (see Appendix A for a complete list of scenario context manipulations). By design, scenarios involve real world elements that could be understood easily through textual delivery. Scenarios designed within six different scenario contexts including; an information visualization and graphing system, a distance learning environment, avatar creation within a game, virtual reality navigation, mobile text messaging systems, and response devices used within a classroom. These six contexts were chosen because they represent a wide range of contexts in which interactivity can be measured. Additionally, based on the nature of the system or environment, the contexts of information visualization and graphing system, distance learning environment, and avatar creation within a game allow for scenarios that provide no feedback. With these scenario contexts, the system can still be considered functional even though it provides no feedback. In contrast, the remaining three contexts of virtual reality navigation, text messaging systems, and response devices used within a classroom, cannot be considered functional when they do not provide any feedback. Thus, These contexts do not allow for scenarios that provide no feedback. Each scenario was paired with a representative picture of its respective context (see Figure 2). Levels of feedback and user control were manipulated in a consistent manner across all scenario contexts and were presented to the user in a bulleted list labeled “System Features” (refer to Appendix B to see how each scenario context was presented to participants).
Design
control (no user control, low user control, high user control), and feedback (no feedback, low feedback, high feedback). The outcome variable was perceived interactivity.
Scenarios were presented in a randomized block fashion. Each participant received all 6 scenario contexts in the same order, but conditions manipulating feedback and user control were presented in a randomized order within each scenario context for a total of 45 scenarios (see Figure 5 for the complete study design with 27 total scenarios for no feedback contexts
and 18 total scenarios for no feedback contexts). All participants were asked to rate their perceived levels of the predictor variables, user control and feedback, as well as for the criterion variable, interactivity, in each of the 45 scenarios. Participants indicated the level of interactivity, user control and feedback they believed the features of the system within the scenario provided on a scale of 0 to 100, with 0 being the lowest level and 100 being the highest level (refer to Figure 2 for rating scale example).
Level of Feedback (FB)
None Low High
Level of Control
(UC)
None NUC, NFB NUC, LFB NUC, HFB
Low LUC, NFB LUC, LFB LUC, HFB
High HUC, NFB HUC, HFB HUC, HFB
Figure 3. 3 x 3 within subjects design manipulating feedback and control within contexts that do allow for the absence of feedback (information visualization, distance learning environment, avatar creation within game).
Level of Feedback (FB)
Low High
Level of Control
(UC)
None NUC, LFB NUC, HFB
Low LUC, LFB LUC, HFB
High HUC, HFB HUC, HFB
Procedure
The study was conducted online and took participants an average of 20 minutes to complete (SD = 9 minutes). Participants read and digitally signed an electronic version of the informed consent document (see Appendix C). They then completed a demographic survey including ratings with comfort and ability using computers, the internet, and electronic
devices in general, as well as familiarity ratings for each of the six scenario contexts (see Appendix D). Before beginning the main part of the study, participants were presented with a practice question that explained directions for how to rate the system features they would see in the following scenarios and let them practice moving the sliders. After the practice
question, participants proceeded to rate 45 scenarios for levels of interactivity, user control, and feedback within each of the six scenario contexts. At the end of the study, participants were debriefed and approved for payment through the Mechanical Turk Website.
Results
Manipulation Checks
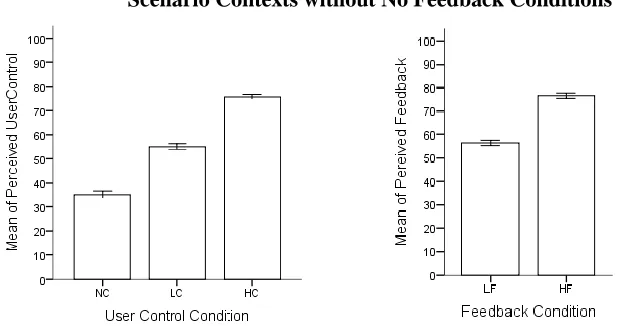
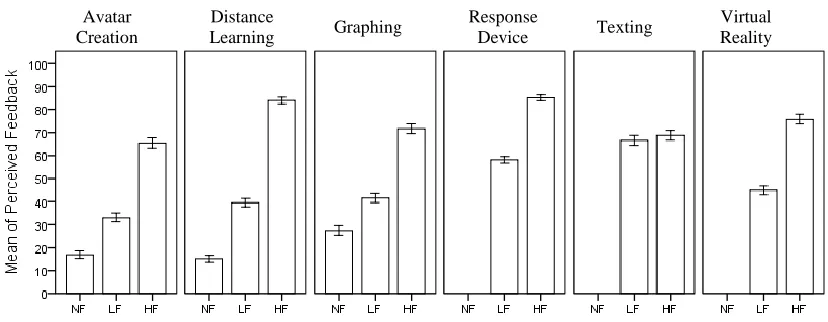
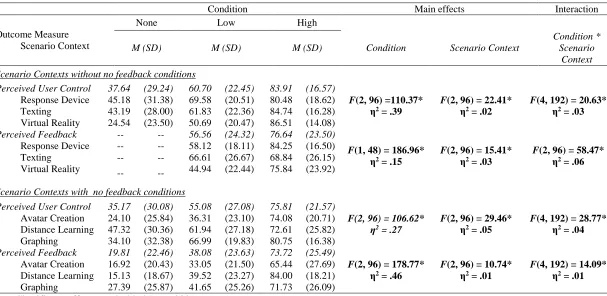
To ensure that that the experimental manipulations across the no user control or feedback, low user control or feedback, and high user control or feedback conditions actually produced measureable and expected changes in the users’ perception of user control and feedback, these perceptions across condition were analyzed using analyses of variance. Additionally, scenario context, was included in the model to access whether differences in perceptions of user control or feedback per each condition were consistent across scenario context. As Figures 6 and 7 show, results from ANOVA’s show that the experimental manipulations for user control and feedback conditions affected the participants’ perceptions of user control and feedback as expected within each group of scenario contexts (those that did not allow for no feedback conditions, and those that did allow for feedback conditions). The model effects, summarized in Table 4, indicate that there was a main effect of both user control and feedback for each grouping of scenario contexts. In other words, there were significant differences in perception of both user control and feedback per each condition (no, low, and high) within each scenario group. However, the perceived differences in both user control and feedback across condition did depend on the scenario context (as illustrated by the significant interaction effects). As Figure 8 shows, it should be noted that for both user control and feedback the rate of change between conditions was not the same for each
Scenario Contexts without No Feedback Conditions
Figure 6. Significant differences in perceptions of user control across and feedback conditions for scenario contexts that did not include no feedback conditions (virtual reality, text messaging, and response device). Error bars represent +/-1 standard error.
Scenario Contexts without No Feedback Conditions
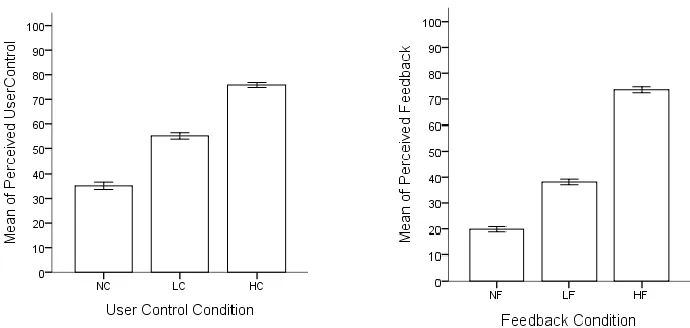
Scenario Contexts with No Feedback Conditions
Figure 7. Significant differences in perceptions of user control across and feedback conditions for scenario contexts that included no feedback conditions (information visualization, distance learning, and avatar creation). Error bars represent +/-1 standard error.
Scenario Contexts with No Feedback Conditions
Perceptions of User Control by Scenario Context and User Control Condition
Avatar Creation
Distance
Learning Graphing
Response
Device Texting
Virtual Reality
Perceptions of Feedback by Scenario Context and Feedback Condition
Avatar Creation
Distance
Learning Graphing
Response
Device Texting
Virtual Reality
Table 4. Effects Summary for Measurement Check ANOVA’s of Perceived User Control and Feedback for Condition and Scenario Context
Condition Main effects Interaction
Outcome Measure Scenario Context
None Low High
M (SD) M (SD) M (SD) Condition Scenario Context
Condition * Scenario
Context
Scenario Contexts without no feedback conditions
Perceived User Control 37.64 (29.24) 60.70 (22.45) 83.91 (16.57)
F(2, 96) =110.37* η2 = .39
F(2, 96) = 22.41* η2 = .02
F(4, 192) = 20.63* η2 = .03
Response Device 45.18 (31.38) 69.58 (20.51) 80.48 (18.62) Texting 43.19 (28.00) 61.83 (22.36) 84.74 (16.28) Virtual Reality 24.54 (23.50) 50.69 (20.47) 86.51 (14.08) Perceived Feedback -- -- 56.56 (24.32) 76.64 (23.50)
F(1, 48) = 186.96* η2 = .15
F(2, 96) = 15.41* η2 = .03
F(2, 96) = 58.47* η2 = .06
Response Device -- -- 58.12 (18.11) 84.25 (16.50) Texting -- -- 66.61 (26.67) 68.84 (26.15) Virtual Reality -- -- 44.94 (22.44) 75.84 (23.92)
Scenario Contexts with no feedback conditions
Perceived User Control 35.17 (30.08) 55.08 (27.08) 75.81 (21.57)
F(2, 96) = 106.62* η2 = .27
F(2, 96) = 29.46* η2 = .05
F(4, 192) = 28.77* η2 = .04
Avatar Creation 24.10 (25.84) 36.31 (23.10) 74.08 (20.71) Distance Learning 47.32 (30.36) 61.94 (27.18) 72.61 (25.82) Graphing 34.10 (32.38) 66.99 (19.83) 80.75 (16.38) Perceived Feedback 19.81 (22.46) 38.08 (23.63) 73.72 (25.49)
F(2, 96) = 178.77* η2 = .46
F(2, 96) = 10.74* η2 = .01
F(4, 192) = 14.09* η2 = .01
Models Predicting Perceptions of Interactivity
Categorical Predictor Variables
The goal of these models was to determine if the experimental manipulations of user control and feedback had an impact on perceptions of interactivity. Did increasing levels of user control and feedback produce increasing perceptions of interactivity? To answer this question for each group of scenario contexts, two models were ran; one for scenario contexts without no feedback conditions, and one for scenario contexts with no feedback conditions. Based on the possible importance of context, as indicated through the measurement check analyses, the role of scenario context was investigated in predicting interactivity as well. As Figures 9 and 10 show, results from ANOVA’s indicate that there were differences in perceptions of interactivity across user control and feedback conditions. The model effects, summarized in Tables 5 and 6, indicate that there were significant positive main effects of user control condition and feedback condition in both scenario context groups.
Interactivity in Scenario Contexts without No Feedback Conditions
Scenario Contexts without No Feedback Conditions
Interactivity in Scenario Contexts with No Feedback Conditions
Figure 10. Significant differences in perceptions of interactivity across user control and feedback conditions for scenario contexts that included no feedback conditions (information visualization, distance learning, and avatar creation). Error bars represent +/-1 standard error.
Scenario Contexts with No Feedback Conditions
Results for these contexts showed significant and positive main effects for user control condition, feedback condition, and scenario context. In other words, when controlling all other effects in the model, there were unique effects of all of the fixed factors, and there were significant differences between perceptions of interactivity across user control
Table 5. Main Effects Summary for the Perceived Interactivity ANOVA’s with Categorical User Control and Feedback Conditions, and Scenario Context
Feedback Condition Main effects
Outcome Measure UC Condition
NF LF HF
M (SD) M (SD) M (SD) UC Condition FB Condition Scenario Context
Scenario Contexts without no feedback conditions Perceived Interactivity
No control -- -- 46.14 (27.48) 50.63 (28.75) F(2, 96) =83.25** η2 = .26
F(1, 48) = 27.75** η2 = .01
F(2, 96) = 23.70** η2 = .04
Low control -- -- 66.24 (19.49) 70.14 (21.45) High Control -- -- 78.78 (18.04) 84.44 (19.14)
Scenario Contexts with no feedback conditions Perceived Interactivity
No control 35.14 (30.02) 43.21 (30.63) 48.76 (32.92) F(2, 96) = 82.02** η2 = .18
F(2, 96) = 66.12** η2 = .04
F(2, 96) = 17.07** η2 = .04
Table 6. Effects Summary for Perceived Interactivity ANOVA’s with Categorical User Control and Feedback Conditions, and Scenario Context
Outcome Measure Scenario Context UC Condition
Feedback Condition Two and Three Way Interactions
NF LF HF
UC Condition * FB Condition
UC Condition * Scenario Context
FB Condition*
Scenario Context
UC Condition * FB Condition* Scenario Context
M (SD) M (SD) M (SD)
Scenario Contexts without no feedback conditions
Perceived Interactivity Response Device
No control -- -- 53.71 (26.61) 57.96 (28.63) F(2, 96) = .49
p = .61
F(4, 96) =18.92** η2 = .03
F(2, 96) = 7.11* η2 = .01
F(4, 192) = 1.14
p = .33 Low control -- -- 68.59 (18.74) 75.82 (20.77)
High Control -- -- 77.63 (16.98) 81.20 (21.67) Texting
No control -- -- 54.98 (25.46) 56.59 (26.92) Low control -- -- 74.10 (19.20) 72.61 (19.20) High Control -- -- 80.78 (20.51) 82.98 (19.76) Virtual Reality -- --
No control -- -- 29.73 (22.98) 37.33 (26.41) Low control -- -- 56.02 (18.21) 61.98 (22.18) High Control 77.94 (16.57) 89.12 (14.79)
Scenario Contexts with no feedback conditions
Perceived Interactivity Avatar
No control 25.31 (27.53) 32.61 (26.27) 36.16 (29.77) F(4, 192) = 1.05
p = .38
F(4, 192) = 37.83** η2 = .06
F(4, 192) = 61.96** η2 = .01
F(8, 384) = .90
p = .51 Low control 44.51 (25.33) 49.10 (21.07) 52.84 (24.81)
High Control 66.35 (23.22) 71.59 (20.30) 80.67 (18.66) Distance Learning
No control 49.04 (26.85) 66.19 (25.21) 75.90 (21.23) Low control 46.18 (28.00) 59.73 (26.72) 75.96 (19.80) High Control 51.67 (26.59) 72.96 (23.15) 79.41 (20.43) Graphing
Figure 11.Differences in perception of feedback and user control across conditions for each participant.
Continuous Predictor Variables
In previous analyses the grouping of scenario contexts without the no feedback conditions and the grouping of scenario contexts with the no feedback conditions look relatively similar in terms of the relationship between the experimental manipulations of user control and feedback. They also show that the relationship between perceptions of
interactivity and user control or feedback condition depend on the scenario context. The interaction between user control condition and feedback condition when predicting perceived interactivity is non-significant for both groups. Examining the trend lines for each individual participant on the predictor measures of perceived user control and feedback (see Figure 11) shows that, overall, the slopes of each participants’ ratings is positive, i.e. each participant showed an increase in perceptions of user control and feedback as would be expected by the changing experimental condition (and per previous results). However, participants vary widely on their perceptions for user control and feedback within each experimental
scenarios contexts were looked at within one model. Also, for examining all scenario contexts, the choice to center the data to each participant’s mean ratings was made (see Jaccard, & Turrisi, 2003 for an overview on mean centering). Each rating given by a participant on the outcome variables were subtracted from the mean of their respective ratings on the outcome variable. Centering is used here to make the intercept the expected value of perceived interactivity for a participant whose perceived feedback or perceived user control is the mean of their ratings on feedback or user control, respectively. Therefore, all interpretations of intercepts will be framed as how each person’s perception of interactivity varies as a function of departures from their mean ratings on perceived feedback and perceived user control.
All Scenario Contexts
All Scenario Contexts
To examine the effect of participant perceptions of user control and feedback on perceptions of interactivity, each individuals’ ratings of perceptions of user control and feedback, as well as scenario context were used as predictor variables in a regression. As Figure 12 shows, for all scenario contexts considered together, as perceptions of user control and feedback increased, perceptions of interactivity also significantly increased. Within Figure 12 (and for interaction plots after this), the resulting regression equation was used to plot point estimates for low levels of perceived feedback (1 SD below the mean) and high levels of perceived feedback (1 SD above the mean). User control explained 35% of the variance in interactivity (r2=.35, F(1, 48) = 127.90, p < .0001) , while feedback explained 3% of the variance (r 2=.03, F(1, 48) = 22.29, p <.0001). Further, perceptions of user control significantly predicted perceptions of interactivity (B = .64, SE=.01, p < .001), as did perceptions of feedback (B = .12, SE=.01, p < .001). The interaction between user control and feedback was not significant. However, the relationship between user control or feedback and perceptions of interactivity was different based on the scenario context. This was
exhibited by significant interactions between user control and scenario context (r 2=.01, F(5, 240) = 2.37, p < .05) and feedback and scenario context were significant (r 2=.01, F(5, 239) = 3.83, p < .01). The three way interaction between user control, feedback, and scenario
context was not significant. Nevertheless, based on these significant two way interactions, a detailed look at the relationship between perceptions of user control, feedback and
Each Scenario Context
Avatar Scenario Context
Figure 13.Differences in perception of interactivity for perceptions of user control and feedback within the avatar creation scenario context. Error bars represent +/-1 standard error.
Distance Learning Scenario Context
Figure 14. Differences in perception of interactivity for perceptions of user control and feedback within the distance learning scenario context. Error bars represent +/-1 standard error.
Distance Learning. As Figure 14 illustrates, within the distance learning scenario context there was also positive relationship between perceptions of user control and feedback and perceptions of interactivity. Both variables explained a significant amount of variance in perceived interactivity. User control and feedback explained almost equal amounts of
variance; user control explained 9%, (r 2=.09, F(1, 47) = 11.22, p < .0001), and perceived feedback explained 8% of the variance (r 2=.08, F(1, 47) = 8.83, p < .01). Perceptions of user control significantly predicted perceptions of interactivity (B = .39, p < .0001), as did
Graphing Scenario Context
Figure 15.Differences in perception of interactivity for perceptions of user control and feedback within the information visualization graphing scenario context. Error bars represent +/-1 standard error.
Graphing / Information Visualization. As Figure 15 illustrates, within the graphing scenario context there was a positive relationship between perceptions of user control and perceptions of interactivity, however there were not significant differences in interactivity based on feedback. Perceptions of feedback did not seem to influence perceptions of interactivity within this scenario context. User control explained a significant portion of the variance (37%), (r 2=.37, F(1, 47) = 31.69, p < .0001), but perceived feedback did not (F(1, 47) = .61, p = .44). Perceptions of user control significantly predicted perceptions of
Response Device Scenario Context
Figure 16.Differences in perception of interactivity for perceptions of user control and feedback within the response device scenario context. Error bars represent +/-1 standard error.
Texting Scenario Context
Figure 17. Differences in perception of interactivity for perceptions of user control and feedback within the texting scenario context. Error bars represent +/-1 standard error.
Texting. As Figure 17 illustrates, within the texting scenario context there was a positive relationship between perceptions of user control and feedback and perceptions of interactivity. Most interestingly, the interaction between use control and feedback was significant (F(1, 47) = 10.31, p < .05). The relationship between perceived user control and perceived interactivity depended on perceived feedback. Simple slopes for the association between perceived user control and interactivity were tested for low (-1 SD below the mean), and high (+1 SD above the mean) levels of perceived feedback. Each of the simple slope tests revealed a significant positive association between perceived feedback and interactivity but perceived user control was more strongly related to interactivity for low levels of
Virtual Reality Scenario Context
Figure 18.Differences in perception of interactivity for perceptions of user control and feedback within the virtual reality scenario context. Error bars represent +/-1 standard error.
Discussion
The added dimension of interactivity gives computer-based interactions “enhanced appeal” and is considered to be a desirable feature of technology (Waterworth, 1992). Yet, consensus on exactly what interactivity is has not been reached. An understanding of the relationship specific features of a technological system and perceptions of interactivity will aid in the effort to understand, operationalize, and define the concept of interactivity in terms of user perceptions. The main goal of this study was to quantify perceived interactivity in terms of the relationship between two dimensions frequently cited as contributing to a feeling or perception of interactivity: user control and feedback.
To meet this goal multiple analyses were carried out to answer there main questions: (1) What impact does increasing user control have on perceptions of interactivity?, (2) What impact does increasing feedback have on perceptions of interactivity?, and (3) Do these relationships generalize across a wide variety of scenario contexts? To answer these questions, respectively, three hypotheses were made about the direction of the relationship between these dimensions and perceived interactivity were made.
Hypothesis 1 (H1), which stated that as user control increased perceptions of interactivity would also increase, was supported by all analyses. Added amounts of user control (as defined by the experimental controls and the individual perceptions of user
control did have a positive effect on perceptions of interactivity, this was true in aggregate, as well as within each scenario context. Thus, it is reasonable to conclude that user control is an important and relatively stable dimension when predicting perceptions of interactivity. The more user control provided (or perceived) the more interactive the user felt the system was. This was true for all of the broad range of six scenario contexts used within this study when considered as a whole, as well as when considered individually.
interactivity. However, when using individuals’ perceptual ratings of feedback, two exceptions for this significant positive relationship surfaced. Perceived feedback was not a significant predictor of perceived interactivity in the graphing and response device scenario contexts. It is not clear why feedback does not significantly influence perceptions of interactivity within these specific contexts, but activity theory, where the influences of features of the technology or other external factors on an interaction are along the path towards a specific goal, may provide some insight.
Within the response device and graphing scenario context, where feedback was not significantly associated with interactivity, the written features of the system provided to the user may not have provided a highly specific goal. Within the graphing system, the user control feature indicated data sets could be chosen to graph, providing various amounts of feedback about this data set, but the goal of graphing a data set was not clear. Similarly, within the response device scenario, user control features indicated that poll questions were made or given, and feedback indicated that responses were displayed (or not), but a clear goal for collecting poll responses was not given. These fuzzy goal contrasts with the seemingly more distinct goal given within the distance learning scenario context, where feedback was highly significant, and explained a good percentage of the variance in
perceived interactivity. The goal within the distance learning scenario is both evident through the features, stating that grades are given, and various amounts of feedback about these grades was provided, and familiar to a vast amount of people. Interpreting results from these two scenario contexts in this manner could suggest that feedback provided by the system may impact perceptions of interactivity variably depending on whether a well-defined goal exists or not. The idea that the impact of user control and feedback on interactivity is dependent on other factors, although not investigated in terms of user goals, was looked at in terms of scenario context.
control and scenario context, and feedback and scenario context were significant when looking at all scenario contexts together (both by perceptual ratings, and by the experimental conditions). Signifying that the strength of the relationship between either user control or feedback was different depending on the scenario context. This dependence is also present when looking at each individual’s perceptual ratings. Further, the analyses for each
individual scenario context reveal that user control and feedback explain different amounts of variance between scenario contexts. These results indicate that generalizations about how people perceive interactivity cannot necessarily be made across a broad set of contexts. Additionally, while no multiplicative relationship was found between user control and feedback for the avatar creation, distance learning, graphing, response device, and virtual reality scenario contexts, there was one instance, the texting scenario context, where there was a multiplicative relationship. Within this context the interaction between user control and interactivity (when defined by individual perceptions) was dependent on the perceived
feedback. With each increase in perceived user control, increases in perceived feedback mattered less in terms of predicting perceived interactivity. Said another way, as long as user control was perceived as high, additional amounts of feedback no longer influenced
perceptions of interactivity. Again, relating these results to the activity theory framework, it helps situate the perceptions of the interaction within the various contexts presented.
Interestingly, one rationalization of these results could lie in a specific aspect of the stated user control features. One listed feature for user control was that when user control was considered ‘high’ the text messaging system allowed the user to enter words into a dictionary so that they were no longer considered misspelled. It makes sense that this feature would render feedback no longer impactful on interactivity, as over time, the feedback would no longer occur, if this user control feature was utilized the text messaging system would eventually have all previously corrected words in the dictionary.
ultimately impact perceptions of interactivity as they relate to perceptions of user control and feedback. So, do user control and feedback constitute as defining dimensions of interactivity? Results from this body of work show that answer is: “yes, but it depends.” This study shows that user control and feedback are important considerations in creating a feeling of
interactivity with technology. However, readers beware, while user control and feedback are mostly predictive of interactivity, these effects are not completely generalizable across the scenario contexts examined here. For predicting perceived interactivity, the context around which a user is interacting with technology does matter.
Implications
Future Work
This body of work, while a good representation of interactions, is not equivalent to the real thing. Interactivity may be more precisely measured when users are actually asked to
perform the task (as opposed to being asking to imagine a scenario from a list of written scenario features). Additional research involving participant interaction with an actual device or tool would be a nice supplement to the work presented in this study, as this type of
investigation would allow for an understanding of how different aspects of a task contribute to the perception of interactivity. Related to activity theory, providing users with varying levels of specificity in a goal to be reached by interacting with the technology may be another insightful avenue of investigation. Furthermore, further inquiry into the relationship between the societal facet of activity theory (i.e. rules, community, and division of labor) and user control, feedback, and perceptions of interactivity may be of use. Additionally, the long term and evolving processes between the user and the technology, along with the users perceptions of the technology is not represented in this work. It is likely, that the concept of interactivity will evolve through time. A look at what Bannon (1991b) refers to as considering the human factors, along with the human actors embodies the need to consider the long-term reciprocal evolution between users and their interactions with technology. As wide open as the future of the technology is, future work could be designed to investigate how interactions and
REFERENCES
Adiele, C. (2008). Modeling interactivity in a b2b web-based community. In In Digital Information Management (pp. 417–422). IEEE. doi:10.1109/ICDIM.2008.4746785
Beauchamp, G., & Kennewell, S. (2010). Interactivity in the classroom and its impact on learning. Computers & Education, 54(3), 759–766. doi:10.1016/j.compedu.2009.09.033
Brady, L. (2004). The role of interactivity in web-based educational material. Usability News, 6(2).
Bransford, J., Brown, A., & Cocking, R. (2000). How people learn. Washington, D.C.: National Academy Press. Retrieved from http://www.csun.edu/~SB4310/How People Learn.pdf
Bucy, E. P., & Tao, C. C. (2007). The mediated moderation model of interactivity. Media Psychology, 9(3), 647–672. doi:10.1080/15213260701283269
Burgoon, J. K., Bonito, J. a., Ramirez, A., Dunbar, N. E., Kam, K., & Fischer, J. (2002). Testing the Interactivity Principle: Effects of Mediation, Propinquity, and Verbal and Nonverbal Modalities in Interpersonal Interaction. Journal of Communication, 52(3), 657–677. doi:10.1111/j.1460-2466.2002.tb02567.x
Cairncross, S., & Mannion, M. (2001). Interactive multimedia and learning: realizing the benefits. Innovations in Education and Teaching International, 38(2), 156–164. doi:10.1080/14703290110035428
Chen, K., & Yen, D. C. (2004). Improving the quality of online presence through interactivity. Information & Management, 42(1), 217–226.
doi:10.1016/j.im.2004.01.005
Cho, C. H., & Leckenby, J. D. (1999). Interactivity as a measure of advertising effectiveness.
In Proceedings of the American Academy of Advertising (pp. 162-179). Gainesville:
University of Florida.
Domagk, S., Schwartz, R. N., & Plass, J. L. (2010). Interactivity in multimedia learning: An integrated model. Computers in Human Behavior, 26(5), 1024–1033.
doi:10.1016/j.chb.2010.03.003
Finneran, C. M., & Zhang, P. (2003). A person–artefact–task (PAT) model of flow antecedents in computer-mediated environments. International Journal of Human-Computer Studies, 59(4), 475–496. doi:10.1016/S1071-5819(03)00112-5
Ha, L., & James, E. L. (1998). Interactivity reexamined: A baseline analysis of early business web sites. Journal of Broadcasting & Electronic Media, 42(4), 457–474.
doi:10.1080/08838159809364462
Hart, J., Sutcliffe, A. G., & Angeli, A. De. (2013). Love it or Hate it ! Interactivity and User Types, 2059–2068.
Heeter, C. (2000). Interactivity in the context of designed experiences. Journal of Interactive Advertising, 1(1), 4–15.
Jaccard, J., & Turrisi, R. (Eds.). (2003). Interaction effects in multiple regression (Vol. 72). Sage.
Jensen, J. (1998). Interactivity: Tracking a new concept in media and communication studies. Nordicom Review, 185–204.
Jensen, J. F. (2008). The concept of interactivity -- revisited. In Proceeding of the 1st international conference on Designing interactive user experiences for TV and video (pp. 129–132). New York, New York, USA: ACM Press.
doi:10.1145/1453805.1453831
Jumisko-Pyykkö, S., Weitzel, M., & Rakkolainen, I. (2009). Biting, Whirling, Crawling– Children’s Embodied Interaction with Walk-through Displays. In Human Computer Interaction - INTERACT 2009 (pp. 123–136). Springer Berlin Heidelberg.
Kaptelinin, V. (1996). Activity theory: implications for human-computer interaction. Context
and consciousness: Activity theory and human-computer interaction, 103-116.
Kettanurak, V. (Nui), Ramamurthy, K., & Haseman, W. D. (2001). User attitude as a mediator of learning performance improvement in an interactive multimedia environment: an empirical investigation of the degree of interactivity and learning styles. International Journal of Human-Computer Studies, 54(4), 541–583. doi:10.1006/ijhc.2001.0457
Kim, J., Spielmann, N., & McMillan, S. J. (2012). Experience effects on interactivity: Functions, processes, and perceptions. Journal of Business Research, 65(11), 1543– 1550. doi:10.1016/j.jbusres.2011.02.038
Kuuti K (1996) Activity theory as a potential framework for human–computer interaction research. In: B.A. Nardi (ed) Context and consciousness: activity theory and human– computer interaction. MIT Press, Cambridge, pp 17–44.
Lim, Y., Lee, S.-S., & Lee, K. (2009). Interactivity attributes. In Proceedings of the 27th international conference on Human factors in computing systems - CHI 09 (p. 105). New York, New York, USA: ACM Press. doi:10.1145/1518701.1518719
Liu, Y. (2003). Developing a Scale to Measure the Interactivity of Websites. Journal of Advertising Research, 42(2), 207–216. doi:10.1017/S0021849903030204
Liu, Y., & Shrum, L. (2002). What is interactivity and is it always such a good thing ? Implications of definition, person, and situation for the influence of interactivity on advertising effectiveness. Journal of Advertising, 31(4), 53–64.
Manovich, L. (2001). The language of new media. Postmodern Culture. MIT Press. Retrieved from
http://muse.jhu.edu/journals/postmodern_culture/v013/13.3swiss_shaw.html
Mayer, R. E., & Chandler, P. (2001). When learning is just a click away: Does simple user interaction foster deeper understanding of multimedia messages? Journal of
Educational Psychology, 93(2), 390–397. doi:10.1037//0022-0663.93.2.390
Mcmillan, S. J. (2002). A four-part model of cyber-interactivity: Some cyber-places are more interactive than others. New Media & Society, 4(2), 271–291.
doi:10.1177/146144480200400208
McMillan, S. J., & Hwang, J.-S. (2002). Measures of perceived interactivity: an exploration of the role of direction of communication, user control, and time in shaping perceptions of interactivity. Journal of Advertising, 31(3), 29–42.
Moreno, R., & Mayer, R. (2007). Interactive Multimodal Learning Environments. Educational Psychology Review, 19(3), 309–326. doi:10.1007/s10648-007-9047-2
Newhagen, J. E., Cordes, J. W., & Levy, M. R. (1995). [email protected]: audience scope and the perception of interactivity in viewer mail on the internet. Journal of
Communication, 45(3), 164–175. doi:10.1111/j.1460-2466.1995.tb00748.x
Parés, N., & Parés, R. (2001). Interaction-Driven Virtual Reality Application Design (A Particular Case: El Ball del Fanalet or Lightpools). PRESENCE: Teleoperators and Virtual Environments, 10(2), 236–245. Retrieved from