* Corresponding author: layth.a.khalil@gmail.com
The effect of total noise on two-dimension OCDMA codes
Layth A. Khalil Al Dulaimi 1, R.Badlishah Ahmed 2, Naimah Yaakob3 , Syed A. Aljunid 4, Rima Matem5
1, 3 Embedded Networking and Advance Computing Cluster, School of Computer & Communication Engineering, Universiti Malaysia Perlis (UniMAP) Tingkat 1, Kampus Tetap Pauh, Putra 02600 Arau, Perlis.
2 Faculty of Informatics and Computing, Universiti Sultan Zainal Abidin, 21300 Kuala Terengganu, Terengganu, Malaysia. 4,5 Center of Excellent Advanced Communication Engineering, School of Computer & Communication Engineering, Universiti Malaysia Perlis (UniMAP), 01000 kangar, Perlis.
Abstract. In this research, we evaluate the performance of total noise effect on two dimension
(2-D) optical code-division multiple access (OCDMA) performance systems using 2-D Modified Double Weight MDW under various link parameters. The impact of the multi-access interference (MAI) and other noise effect on the system performance. The 2-D MDW is compared mathematically with other codes which use similar techniques. We analyzed and optimized the data rate and effective receive power. The performance and optimization of MDW code in OCDMA system are reported, the bit error rate (BER) can be significantly improved when the 2-D MDW code desired parameters are selected especially the cross correlation properties. It reduces the MAI in the system compensate BER and phase-induced intensity noise (PIIN) in incoherent OCDMA The analysis permits a thorough understanding of PIIN, shot and thermal noises impact on 2-D MDW OCDMA system performance. PIIN is the main noise factor in the OCDMA network.
.
1 Introduction
The major technical challenge for today’s
communication network systems is to take high bandwidth since the volume of information produced increases rapidly. Optical code division multiplexing access (OCDMA) is one technique of such promising technology that takes advantage of excess bandwidth in single mode optical fiber with low information rate into high rate optical sequences followed by optical transmitter to obtain random, asynchronous access without centralized control among users [1].
The important to an effective CDMA system is the choice of efficient statement code sequences with high autocorrelation and zero or fix cross-correlation properties for encoding and decoding of the source bits [2].
The autocorrelation amplitude must be very high and the cross correlation and cross correlation amplitude between two users must remain as low as possible. High autocorrelation amplitude enables the detection of the orginal signal and low cross-correlation amplitude supports in reducing interference from users [3,4]. Wide research has been made to discover the impact optical or codes for non-coherent optical CDMA systems.
2 Performance Analysis of 2-D MDW
Code
2.1 Signal to Noise Ratio Equation
The 2-D W/T MDW code is W/T OCDMA code which was developed in 2013 by Arief et al [7]. This code has a good cross-correlation property, optimizing data transmission rate, capable of suppressing PIIN, eliminating MAI and enhancing system performance of the OCDMA system architecture. The code also has the advantage of high cardinality and low effective transmitted power. The 2-D W/T MDW OCDMA code is derived from the 1-D MDW OCDMA [8,9]. The serious requirement in minimizing interference which is non-exclusive to all code groupings is the low cross-correlation and high auto-cross-correlation with low side flaps. These are important parameters which will be changed so the effect on the framework execution can be understood; the synchronous number of clients, the number of Hamming weight, the bit rate, the effective transmitted power and the noise power [10].
In this section, signal to noise ratio (SNR) and bit error rate (BER) performance for incoherent SAC optical CDMA has been studied for 2-D MDW code design. MAI is mainly due to thermal noise, shot noise and phase-induced intensity noise. The effect of dark current for photodiodes has been neglected here. As mention before there are three types of noise that are taken into consideration in the performance analysis. The effect of the dark current is neglected [4] because it is so small. The BER calculation is based on the Gaussian approximation. The photo-diode, which is used to detect thermal lights, produces the photodiode noise that can be expressed as follows [9]:
L n b c KRT B
B I eIB
i2 2 4
(1)
The Power Spectral Density (PSD) of the received optical signal is written as [9]:
) 2 2 ( 2 0 ) 2 ( 2 0 1 0 10 ( )
1 ( )
2 ) ( i M M f f f u i M M f f f u M i N j aij w W
w d w fk sr P f r (2) where Psr is the effective power of a broadband source at the receiver, f is the bandwidth of the source, k2 is the code weight of the time-chip code sequence. Wis the
number of simultaneously active users, d(w) is the data
bit of the
w
thuser which can either be ‘’1’’ or ‘’0’’. M isthe code length of a spectra code sequence, Nis the code length of the spatial code or time sequence, aijis an
element of the
w
th user’s code word [7].The modulated 2-D W/T MDW code carries data to the decoder. The u (f) represents the unit step function that can be expressed as [9]:
0 , 0 , 1 ) ( f o f fu (3)
PSD that exists at the PD0, PD1, PD2 and PD3 of the receiver by using the cross-correlation between the code-word
A
00d,
A
g,his calculated. The PSDs for a single bit period of the optical signals at PD0, PD1, PD2 and PD3 of the receiver are represented by Arief et al.[9]: 1 0 10 ( ) 0 2 ( 2) 0 2 ( 2 )2 )0
( 1 ( ) 2 )
(0 Mi
N
j M M i
f f f u i M M f f f u w ij a ij a W
k dw fk sr P f G (4) 1 0 1
0 () 0 2 ( 2) 0 2 ( 2 )2 )1
( 1 () 2 ) ( 1 M i N
j M M i
f f f u i M M f f f u w ij a ij a W
k dw fk sr P f G (5) 1 0 1
0 () 0 2 ( 2) 0 2 ( 2 )2 )2
( 1() 2 )1 1 ( ) (
2 Mi
N
j M M i
f f f u i M M f f f u w ij a ij a W k dw fk k sr P f G (6) 1 0 1
0 () 0 2 ( 2) 0 2 ( 2 )2 )3
( 1() 2 )1 1 ( ) ( 3 M i N
j M M i
f f f u i M M f f f u w ij a ij a W k dw fk k sr P f G (7) 1
k
is the code weight of a spectra code sequence. For a worst scenario analysis, we setd
(
w
)
1
. The)
(
0f
G
,
G
1(
f
)
,
G
2(
f
)
and G3(f) are used to obtain output current from each arm of the detector. Average output currents PD0, PD1, PD2 and PD3 from the receiver are written as [ 8,9]:
0 0( ) )
(
0 f G f df
I )1 ( )1 )( 1 )( 1 ( )1 ( )1 )( 1 ( 2 )1 ( )1 )( 1 ( 1 2 1 2 MN N M W MN M W k MN N W k k k Mk sr P (8)
0 ( )1
(9)
0 2( ) )
(
2 f G f df
I
) 1 ( ) 1 )( 1 )( 1 ( ) 1 ( ) 1 )( 1 ( 2 2 MN N M W MN M W k Mk sr P (10)
) 1 ( ) 1 )( 1 )( 1 ( 2 0 3( )) ( 3 MN N M W Mk sr P df f G f
I (11)
Whereis the response of the photodiode,e/hf0,
is the quantum efficiency of the PD, h is thePlank’s constant and
f
0 is the central frequency of the incident light. The average photocurrent output from the receiver is defined as the average output current of (PD0-PD1) minus (PD2-PD3) of the receiver and was expressed as [8,9]:M k sr P I I I I
rI (0 1) (2 3) 1
(12)
Mixing an incoherent light field’s incident which causes
intensity noise at PD output, PIIN is the result of phase different between users. The power of PIIN that exists in a photocurrent of the receiver can be written as:
2 ) 1 ( 2 2 2 ) 1 )( 1 ( 2 2 ) 1 ( 2 1 2 2 2 2 MN fk M M W k MN k k sr P r B r r I r B PIINI (13)
The shot noises are coming from the receiver, the average output currents of the receiver are independent of each other. The power of shot noise current can be represented by:
)1 )( 1 )( 1 ( 4 )1 )( 1 ( 2 2 )1 )( 1 ( 1 2 )1 ( 2 1 )1 ( 2 2 ) 3 2 1 0 ( 2 2 N M W M W k N W k MN k k MN Mk sr P r eB I I I I r eB shot I (14) Noise power thermal noise; the variance of thermal noise power is defined as:L R r B n T b K thermal
I2 4 (15)
From equation 12 the total photocurrent output from the receiver
I
r is given by:2 1 2
M k sr P rI (16)
2-D W/T MDW code SNR function was developed from (13),(14),(15) and (16) as:
2 2 2 2 thermal I shot I PIIN I r I SNR
(17)
BER can be expressed in terms of the signal-to-noise ratio (SNR) as:
8
SNR
(18)The photodiode is used to detect thermal lights produces the photocurrent noise. .PIIN, shot noise and thermal noise are considered in performance analysis. BER calculation is based on Gaussian approximation.
2.2 Results and Discussion
In the theoretical calculation, the link parameter of the Equation 18 that has been used is shown in Table 4.1. These parameters are the same as used in [8].
The 2-D W/T MDW OCDMA code sequence uses the notation of (M,N,a,c)to denote M as the number of
wavelengths, N is temporal code length,
aand
c are auto-correlation and cross-correlation values.Table 1. Parameters Used in Numerical Calculation [8].
Parameters Used in Numerical Calculation PD quantum efficiency
broadband light source Spectral width
Operational wavelength Electrical bandwidth Data transmission rate Receiver noise temperature
Receiver load resistor
Boltzmann’s constant Electron charge Light velocity ɳ=0.75 Δλ=30nm(Δλ=3.75THz) λ˳=1.55μm B=311 MHz
Rb =622 Mbps, 1 Gbps,
1.5 Gbps, 2 Gbps Tn =300K
RL=1030Ω
Kb=1.38×10^-23
W/K/Hz e=1.60217646×10^-19 coulomb 8
10
3
C
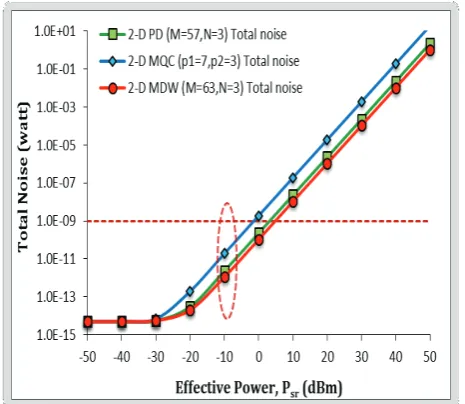
m/sFig. 1. Total noise BER versus effective power (Psr) for 2-D MDW (M=63,N=3), 2-D PDC(M=57,N=3), 2-D MQC(p1=7,p2=3).
Fig. 2. BER as a function of effective power for 2-D PDC(M=57, N=3) and 2-D MDW(M=63, N=3).
Fig. 2 shows the effect of 2-D MDW (M=63, N=3 ) BER curves of PIIN combine with shot noise, PIIN + thermal noise and finally combine of the three noises for the Psr
starts from -40 to -5 dBm on the effective power slop.
Table 2. 2-D MDW OCDMA PIIN, Shot and Thermal noise versus effective power.
Code Psr(dBm) Lost(dBm)
2-DMDW (M=63,N=3)PIIN,
Shot & Thermal noise -17.5 -
2-DMDW (M=63,N=3)PIIN
& Shot noise -18.5 1.0
2-DMDW (M=63,N=3)PIIN
& Thermal noise -18.3 0.8
2-DMDW (M=63,N=3) Shot
& Thermal noise -20.3 2.8
2-DPDC (M=57,N=3)PIIN,
Shot &Thermal noise - -
From Table 2, PIIN noise alone causes -2.8 dBm power penalty lost; 16% lost. Whereas shot and thermal noise contribute -1 dBm and -0.8 dBm towards power penalty lost 5.7% and 4.6% respectively. The 2- D PDC (M=57, N=3) code sequence does not fulfil the 10-9 BER error
floor. OCDMA Asynchronous nature causes overlapped pulses results in PIIN increases. Performance is sensitive to PIIN in comparison to Shot and Thermal noise. PIIN is the main contributor towards system degradation. 2-D MDW OCDMA is designed with the property of PIIN suppression .
3 Conclusion
PIIN is main limitation factor to the system performance as compare to the shot noise and thermal noise. When Psr is low, thermal noise source becomes the main factor that limits the system performance. Shot noise always low and negligible above -30dBm. The lower total noises power results in high SNR and low BER. It is also been observed that thermal noise is much more influential than shot noise. 2-D MDW code achieves low optical transmission requirement (Psr) at -17.5 dBm in comparison to 2-D PDC and 2-D MQC code.
References
1. R. Kadhim, H. Fadhil , S. Aljunid, M. Razalli. ICCSCE. pp. 90-94 (2014).
2. N. Keraf , S. Aljunid, P. Ehkan, A. Safar. Journal of Theoretical & Applied Information Technology. 15. 94(1) (2016).
3. G. Kaur, & S. Singh. Review on Optical Code Division Multiple Access Systems, (2016).
4. I. Ahmed, S. Aljunid., C. Rashidi, & L. Al Dulaimi. ECIT'16, 3(1). 73-76 (2016).
6. Briley, B. E. An introduction to fiber optics system design. Elsevier. ISBN 9781483293868, 1-352, (2016).
7. I. Ahmed, S. Aljunid, C. Rashidi, L. Al dulaimi. Australian Journal of Basic and Applied Sciences. 11 (1), 83-90 (2017).
8.
A. Arief, S. Aljunid, M. Anuar, R. Ahmad, M. Junita, M. Rashidi. In Key Engineering Materials Trans Tech Publications. 594. 1052-1058(2014). 9. A. Arief, S. AlJunid , M. Anuar , Junita M. , R.Ahmad, F. Ghani. ICP. 1. 275-279 (2012).
![Table 1. Parameters Used in Numerical Calculation [8].](https://thumb-us.123doks.com/thumbv2/123dok_us/8124743.1353786/3.595.56.286.85.213/table-parameters-used-in-numerical-calculation.webp)