Study of QCD-dynamics in
η
and
η
production and decays
ReinhardBeck1,and UlrichWiedner2,
1Helmholtz-Institut für Strahlen- und Kernphysik, Rheinische Friedrich-Wilhelms-Universität Bonn, Nußallee 14-16, 53115 Bonn 2Institut für Experimentalphysik I Ruhr-Universität Bochum Universitätsstraße 150, 44780 Bochum
Abstract.One aim of this project lies in studying QCD dynamics using photoproduction ofηandηmesons with the CBELSA/TAPS experiment at the accelerator facility ELSA. Hadronic decay modes ofηandηare analyzed that allow the study of symmetry breaking effects in QCD. Furthermore, excitedη-states produced with a photon beam are studied within the scope of this project. Of special interest is hereby the nature of the
η(1405). The high data samples forη- andη-photoproduction offthe proton allow in addition the determination of polarization observables.
1 Introduction
The scientific goal of this project is the study of QCD dy-namics in the photoproduction of pseudoscalar and vector mesons and their subsequent decay pattern. Especially in focus are the ground-stateηandηmesons and excitedη states. Various decays of theηandηare forbidden by con-servation laws. For example, the hadronic decay modes η → 3π only occur due to the isospin-violating quark-mass differencemu−mdor due to electromagnetic effects, and the decaysη,η→ππγare sensitive to the QCD box anomaly. A systematic study of such decays offers a way to investigate symmetries and symmetry breaking effects in QCD (see project B.3). The second goal within the project is related to the question of the production cross-section of excitedη-states with a photon beam. In partic-ular, the nature of theη(1405), discovered in antiproton-proton annihilation, has been discussed extensively and controversially in the literature. It is considered as a good candidate for the pseudoscalar glueball, even though its mass is significantly lower than lattice calculations predict. Recent studies ofη(1405) decays did lead to unexpected results, thus adding to the ambiguity in the interpretation of its nature. More light on the nature of theη(1405) can be shed by studying the processes that lead to its produc-tion. While theη(1405) is clearly produced in gluon-rich processes like radiative J/Ψdecays or antiproton-proton annihilation, the production cross section with a photon beam is unclear. Data from the CBELSA/TAPS experi-ment give only a very weak signal for the production of theη(1405) – perhaps an indication for a gluonic nature of the particle, because glue is not expected to be produced copiously by photon beams. However, the statistical evi-dence does not allow any decisive conclusion. In addition, we are carrying out analyses of the production ofη(1405)
e-mail: [email protected] e-mail: [email protected]
in radiativeJ/ψandψdecays measured with the BES III detector in Beijing and in antiproton-proton annihilation at different momenta. The latter data were taken with the Crystal Barrel detector at the LEAR accelerator at CERN.
2 Project Results
2.1 Determination of the Dalitz plot parameterα and precise measurement of theηmass
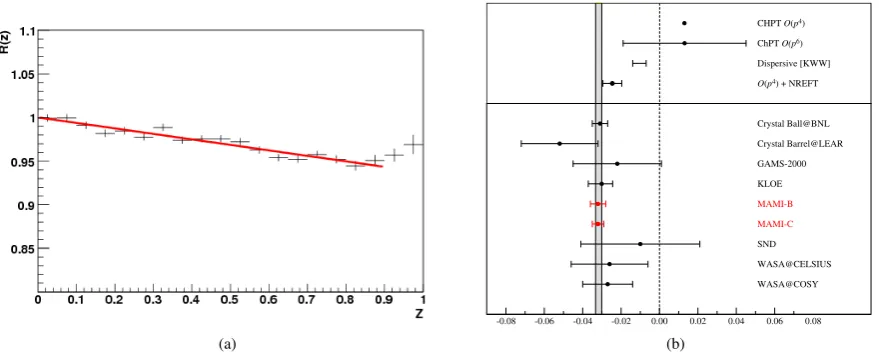
The Dalitz plot parameter α for the η → 3π0 decay was precisely measured, see the PhD-thesis of M. Un-verzagt [1] and [2, 3]. The experiment was performed with the Crystal Ball and TAPS large acceptance pho-ton detectors at the tagged phopho-ton beam facility of the MAMI-B electron accelerator in Mainz. High statistics of 1.8·106 η→ 3π0 events were obtained, giving the result α=−0.032±0.002stat.±0.002syst.which is presented in Fig. 1(a). The most recent values for the slope parame-ter are: α=−0.044±0.004 [5],α =−0.025±0.004[6], α=−0.0302±0.0011[7].
(a)
-0.08 -0.06 -0.04 -0.02 0.00 0.02 0.04 0.06 0.08 CHPTO(p4) ChPTO(p6)
Dispersive [KWW]
Crystal Ball@BNL Crystal Barrel@LEAR GAMS-2000 KLOE MAMI-B MAMI-C SND WASA@CELSIUS WASA@COSY O(p4) + NREFT
(b)
Figure 1. (a) Ratio R(z) of the simulated and the measured z distributions. The Dalitz plot parameter,α, was obtained directly from the fit of the functionc(1+2αz) (red line). (b) World data and prediction for the slope parameterα(PDG 2010 value shaded gray) [4] and the new preciseαvalues from MAMI-B [2] and MAMI-C [3].
For the first time the tagger focal-plane microscope de-tector [16] was used to improve the tagged photon energy resolution. The microscope detector was placed in front of the main focal-plane spectrometer (see Fig. 2(a)), so that it covered the region around the η production threshold (Ethr≈707 MeV) fromEγ =674 MeV toEγ =730 MeV at an electron beam energy E0 = 883 MeV. Made of 96 scintillator strips overlapping to one third, it provided 191 tagging channels with a higher energy resolution of about 0.29 MeV per channel compared to approximately 1.8 MeV available from the main focal-plane detector. The 4.76 cm long liquid hydrogen target was located at the center of the Crystal Ball photon spectrometer. The Crys-tal Ball [17, 18], covering polar angles betweenθ = 20◦ andθ=160◦, consisted of 672 NaI(Tl) crystals (see Fig. 2(b)) and had two openings for the beam in forward and backward directions. Each NaI(Tl) crystal had the form of a truncated 41 cm long pyramid and was equipped with an individual photomultiplier. In order to distinguish between neutral and charged particles detected by the Crystal Ball, the system was equipped with a particle identification de-tector (PID) [19]. The PID was a cylindrical dede-tector, con-sisting of 24 plastic scintillator strips of 2 mm thickness, arranged parallel to the photon beam axis.
The forward wall detector, TAPS [20], had 510 BaF2 hexagonally shaped crystals, each equipped with a 5 mm thick plastic scintillator for identifying charged particles. A single BaF2 crystal was 25 cm long and had an inner diameter of 5.9 cm. The TAPS detector, intended for de-tecting particles in the forward direction (θ = 4◦−20◦), was located at a distance of 173 cm from the Crystal Ball center, making it possible to use a time-of-flight analysis for the particle identification.
The experimental trigger comprised two levels. In the first level, the total energy deposited in the Crystal Ball was checked. If the sum of all photomultiplier analog signals exceeded a threshold corresponding to about 390 MeV, the event was accepted. The second-level trigger included a
condition on the Crystal Ball sector multiplicity. The 672 crystals of the spectrometer were grouped into 45 sectors of up to 16 crystals each. If at least one of the 16 sig-nals exceeded a threshold of 20 to 40 MeV, depending on the relative energy calibration of the photomultiplier sig-nals, the sector contributed to the multiplicity. All events with multiplicity M≥3 and every third event with M≥2 were recorded for further analysis. The latter condition was used for the detection of theη→2γdecay, while the first enhanced events from the six-photon decay.
The tagger microscope has a higher energy resolution than the standard tagging spectrometer and, hence, al-lowed an improvement in the accuracy compared to the previousηmass measurement at MAMI-B (see Fig. 3(a)). The resultmη = (547.851±0.031stat.±0.062syst.) MeV agrees very well with the precise values of the NA48, KLOE and CLEO collaborations and deviates by about 5σ from the smaller, but also very precise value obtained by the GEM collaboration at COSY. A comparison of all cur-rent measurements is given in Fig. 3(b).
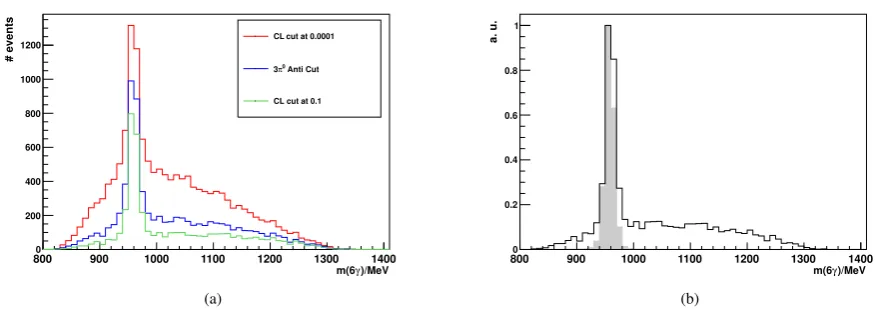
There were significant improvements in the η event selection for the CBELSA/TAPS experiment, which is de-scribed in project A.1, especially concerning the η → π0π0η channel, see the Diploma thesis of P. Nuhn [21]. This was achieved by implementing a kinematic fit and improvements in the background description. For every event, the kinematic fit returns a confidence level for the event hypothesis (in this case π0π0η). Rejecting events with a confidence level lower than 0.0001 eliminates a lot of background (cf. 5(a) red line). Without this cut the η-peak would not be visible. The still considerable
(a) (b)
Figure 2. (a) Plan view of the tagging bremsstrahlung facility [14, 15] and the Crystal Ball detector (not to scale) at Mainz. The tagger microscope detector [16], giving improved resolution, was installed in the focal plane in front of the main detector at the position indicated. The inset shows the geometry of the microscope scintillators. (b) The Crystal Ball photon spectrometer and TAPS. The individual photomultipliers attached to the crystals are not shown; however, those supporting steel structures that were included in the Monte Carlo simulations are shown. Taken from [9].
(a) (b)
Figure 3. (a) Final resultsγp→pηin the threshold region. (b) Overview of previousηmass measurements in comparison to the world average reported by the Particle Data Group in 2006 and 2008 (dashed lines) and the result of the new analysis [9].
side band subtraction or by determining the background contribution in each bin using a suitable fit function.
2.2 The double polarization observable E inη photoproduction
Apart from the η → π0π0η decay mode, the
CBELSA/TAPS detector setup can be used to study the η →γγdecay mode with a branching ratio of only 2.2%
as well. Both decay modes were analyzed in the Master thesis of F. N. Afzal [22, 23] with the aim to study baryon resonances by determining the double polarization observ-able E. Unlike the unpolarized cross section, polarization observables are sensitive to interference terms of multi-poles and hence are sensitive to weakly contributing res-onances, see project A.1. Theηmeson has an isospin of
I=0, thus N∗resonances with isospinI=1/2 become ex-clusively accessible;Δresonances can not contribute. Fur-thermore it is possible to investigate the high mass region (mN∗>1890 MeV) of the nucleon excitation spectrum due to the high mass of theηmeson (958 MeV). In this region many predicted but so far not observed N∗ states should
)/MeV γ m(6
800 900 1000 1100 1200 1300 1400
# events
0 200 400 600 800 1000
1200 CL cut at 0.0001
Anti Cut 0 π 3
CL cut at 0.1
(a)
)/MeV γ m(6
800 900 1000 1100 1200 1300 1400
a. u.
0 0.2 0.4 0.6 0.8 1
(b)
Figure 4.(a) Cuts to improveηevent selection for 6γfinal states (b) Comparison between Monte Carlo simulations (gray) and measuredηevents.
[MeV]
γ
E 1500 1600 1700 1800 1900 2000 2100 2200 2300
E
-1 -0.8 -0.6 -0.4 -0.2 0 0.2 0.4 0.6 0.8 1
W [MeV] 1900 1950 2000 2050 2100 2150 2200 2250
'-MAID
η
Huang CLAS Huang CB
re
e
l
l
i
i
m
m
m
i
i
nary
(a)
[MeV]
γ
E 1500 1600 1700 1800 1900 2000 2100 2200 2300
b]
μ
[
σ
0 0.2 0.4 0.6 0.8 1 1.2 1.4 1.6 1.8 2 2.2
W [MeV] 1900 1950 2000 2050 2100 2150 2200 2250
0,CB
σ
2 1/2,Huang
σ
3/2,Huang
σ
prel
l
i
i
m
m
m
m
i
i
nary
yy
(b)
Figure 5.(a)The double polarization observable E inηphotoproduction was determined in Master thesis of F.N. Afzal and is shown here as a function of the beam energyEγand the center of mass energy W. The data (black points) are compared to partial wave analysis predictions [27, 28].(b) The helicity dependent cross sectionσ1/2andσ3/2together with the fit to the unpolarized cross sectionσ0=12(σ1/2+σ3/2) data by [27]. Taken from [23].
2.3 Measurement of the beam asymmetry inη- and
η-photoproduction
From July to October 2013 the so far largest data sam-ple forη- andη-photoproduction offthe proton with the CBELSA/TAPS experiment at ELSA was taken. An elec-tron beam of 3.2 GeV from ELSA was incident on a thin diamond radiator. Linearly polarized photons were pro-duced through coherent bremsstrahlung. The diamond ra-diator was oriented relative to the beam so that the coher-ent edge was located at 1750 MeV or at 1850 MeV, giving a maximum beam polarization degree ofpγ =40% or 35% at 1750 MeV or 1850 MeV, respectively. As target a liquid hydrogen target of 10 cm thickness was chosen.
This beamtime can be used for several purposes, e.g. the determination of the beam asymmetryΣinηandη -photoproduction which is subject of an ongoing analy-sis. Within the energy range of 1100 MeV−1800 MeV, 8.3 ·106 π0 and 8.2·105 η events in the decay modes π0 →γγandη →γγwere selected [36] using kinematic cuts on the data. These events were used to determine the beam asymmetryΣby fitting theφ-asymmetriesΔN(φ) for
each energy and angular bin:
ΔN(φ)= N−45◦−N+45◦
N−45◦+N+45◦ =pγΣsin(2φ), (1)
where N−45◦ and N+45◦ are the yields obtained with the polarization plane being at ±45◦ relative to the reaction plane, respectively andφbeing the azimuthal angle of the selected meson in the final state. The preliminary results of the beam asymmetryΣinη-photoproduction are shown in Fig. 6 for selected energy bins as a function of cosθ, where θis the polar angle of theη meson in the center of mass system. The data are in good agreement with existing data from CB-ELSA [29] and GRAAL [30] (see Fig. 6(a) and 6(b)). Furthermore the different partial wave analyses (solutionsBnGa2014-01, BnGa2014-02 [35], the SAID-GE09 [34] and the JüBo2015 fit B [32]) agree well with the data since the existing data have been included in all solutions. Above 1500 MeV no data exist until now. Here our new data offer new input that will constrain the different partial wave analysis solutions which differ im-mensely at 1670 MeV (see Fig. 6(d)).
for photon energies of 1461 MeV and 1480 MeV reported by the GRAAL collaboration [37]. These results show a zero crossing from positive to negative from forward to backward angles for both energy bins. This is surprising since near theηthreshold, no such zero crossing was ob-served. This could indicate that the dynamics of η and ηphotoproduction processes are different near threshold.
With our collected data we will be able to extend the mea-sured energy range for the beam asymmetry to 1800 MeV and investigate the dynamics ofηandηmesons further. Another aim of this beamtime is the analysis of rareηand ηdecays which will be done in future analyses. In
addi-tion it is possible to look for excitedη states such as the η(1405) using this and future beamtimes.
2.4 η-mesons and the quest for glueballs
The self-interaction of gluons that is central to QCD leads to a flux tube of gluons exchanged between the quarks that are bound by them. In consequence, quarks cannot be separated infinitely and are subject to confinement. It is a fact that individual free quarks have never been ob-served experimentally to date. The self-interaction in phe-nomenological models and in lattice gauge theory calcula-tions clearly points to the existence of bound states of pure glue, known as glueballs.
Glueballs pose a very interesting facet of nature. The glu-ons are the mediator particles of the strong interaction and themselves massless. However, they do carry color, i.e., the charges of the strong interaction. It is generally be-lieved that there is an attractive interaction between glu-ons leading for example in lattice calculatiglu-ons based on the QCD Lagrangian to a flux tube of gluons between the quark and the antiquark in a meson. The mutual gluon at-traction should also allow for the formation of meson-like bound states of gluons, even if no quarks are present. Lat-tice calculations predict a whole spectrum of bound gluon states, the glueballs.
While the Higgs mechanism might be responsible for the masses of the elementary particles, the mass-creation mechanism for hadrons is quite different. Only a few per-cent of the mass of the proton is due to the Higgs mecha-nism. The rest is created, in a to date not very well deter-mined way, by the strong interaction. In particular, glue-balls themselves would be massless without the strong in-teraction and their predicted masses arise solely from the strong interaction. Glueballs thus offer a unique way to study the mass creation of strongly interacting particles. How can the unknown structure of glueballs and their properties be addressed and studied? First of all, it would be important to identify and study their behavior as de-tailed as possible. What criteria do we have to identify glueballs? The experience from previous searches for the scalar glueball tells us that their decay pattern might not be decisive. The scalar glueball with the quantum num-bersJPC =0++is predicted by lattice calculation around at a mass ≈ 1.6 GeV/c2. In the mass region, however, many mesons are present with the same quantum numbers. Mixing between overlapping resonances might occur and
destroy a distinctive decay pattern, so the interpretation as glueball is complicated by the mixing of the glueball with the broad light-quark states. But we should have other cri-teria.
A glueball does not fit into the normal meson nonet with identical quantum numbers, it should be surplus. Glue-balls should be produced in so-called gluon-rich reactions like the antinucleon-nucleon annihilation process. The an-nihilations of the antiquarks with quarks leads to a gluon-rich environment favoring the formation of gluonic de-grees of freedom. The central region of a high energetic hadron-hadron scattering process should favor the produc-tion of glueballs since it is neither populated by target nor by beam quarks. The radiative decay of quarkonium states and here especially the radiative decay of J/ψorψ mesons should be a prime searching ground for glueballs. Glueballs should not be produced in two photon collisions since gluons do not carry electric charge, which also would suppress their production in a photon beam. The best can-didate for the scalar glueball is nowadays the f0(1500), be-cause it fulfills all of the above criteria.
A consequence of the above mentioned model for glue-balls, with the structure of a closed loop of gluonic flux, is the existence of a mass-degenerate glueball state with opposite parity, i.e. a pseudoscalar glueball JPC = 0−+. Indeed, the experimental data provide evidence for such a glueball. The particle usually noted asη(1440) may indeed be two particles, which are called η(1405) and η(1475). Especially theη(1405) has a strong affinity to glue [38]. We should now see, if theη(1405) fulfills our criteria for being a glueball in a similar way as the f0(1500). Provided that the η(1295) does exist, only one of the two states, η(1405) andη(1475), could be the first radial excitation of theη. The strong coupling to kaons make theη(1475) the prime candidate for being the strangonium member of the nonet. This would leave theη(1405) surplus. The key question to answer is the existence of theη(1295). In the past years we have studied the reaction
γp→p(π0π0η)→ p(6γ) (2)
with the Crystal Barrel detector. All appropriate available beam times were analyzed. The resulting invariant mass spectrum is shown in Fig. 7(a):
A hint for a structure at 1405 MeV/c2is visible. Also a structure around≈ 1300 MeV/c2 is present. Selecting mainlya0(980)π0 events by a mass cut of theηπsystem between 900−1100 MeV/c2makes the structure at 1405 MeV/c2 more evident (Fig. 7(b)). Recent results from PhD theses of Tobias Triffterer and Cathrina Sowa [42, 43] support the assumption, that the η(1405) is produced in γp. Using the data acquired by the CBELSA/TAPS ex-periment with a liquid hydrogen target in 2013, a rela-tive cross section for the production ofη(1405) candidates can be calculated to 0.16±0.05 by comparing the data to the η (see Fig. 11)). To determine if the signal around 1300 MeV/c2 is theη(1295) or the well-known f
-1 -0.5 0 0.5 1 -1
-0.5 0 0.5 1
30 MeV
=1250 MeV
E
θ
cos (a)
-1 -0.5 0 0.5 1
-1 -0.5 0 0.5 1
30 MeV
=1430 MeV
E
θ
cos
(b)
-1 -0.5 0 0.5 1
-1 -0.5 0 0.5 1
30 MeV ± =1550 MeV
γ
E
θ cos
(c)
-1 -0.5 0 0.5 1
-1 -0.5 0 0.5 1
30 MeV
=1670 MeV
E
θ
cos
(d)
Figure 6.(a)-(d) The beam asymmetryΣinη-photoproduction is shown for four different energy bins as a function of cosθC MS(blue points) [26]. The
data is compared to CB-ELSA data [29] (green squares) and GRAAL data [30] (black triangles) and to the following partial wave analysis solutions: BnGa2014-01 (black dotted line), BnGa2014-02 [35] (red solid line), SAID-GE09 [34] (blue dashed line) and JüBo2015 fit B [32] (green dash-dotted line). (a), (b) and (d) taken from [36].
The recent analysis of theηπ+π− final state collected by the CLAS collaboration [44] comes to the conclusion, that the mass, width, and an amplitude analysis of the Dalitz distribution are consistent with the axial-vector f1(1285) identity, rather than the pseudoscalarη(1295). The pro-duction mechanism is more consistent with s-channel de-cay of a high-massN∗state and not with t-channel meson exchange.
For the future, after the successful trigger upgrade of the Crystal Barrel calorimeter (see project D.3) , it is planned to take a dedicated beam time, which will increase the statistics up to two orders of magnitude. This will be suf-ficient to determine if theη(1405) is produced at a cross section comparable to ordinary mesons or with a reduced production cross section, as expected for a glueball. Also, a partial wave analysis will tell us about the existence of theη(1295) in the photoproduction process on protons. While a non-observation, or an observation with sup-pressed production cross section, in the photoproduction process might serve as indication for the gluonic nature of theη(1405), gluon-rich reactions should contain a signifi-cant number ofη(1405) if it has a strong gluonic compo-nent. We have studied therefore in the past years in paral-lel the production ofη(1405) andη(1295) in
antiproton-proton annihilations at different energies and radiative charmonia decays.
The BESIII experiment in Beijing has taken in recent years several hundred million J/ψand ψ data on reso-nance. We have looked at gluon-rich radiative decay chan-nels:
J/ψ→γ(ππη) and ψ→γ(π+π−η) (3)
The invariant mass spectra (Fig. 8(a) and 8(b)) show a signal around 1400 MeV/c2, which contains in case of the
J/ψdecays much more events than the signal at≈ 1300 MeV/c2. This is in sharp contrast to our observations with the photoproduction data. Why theψdata look different in the relative ratios between 1405 and 1300 is currently not understood, but certainly worth investigating further. A partial wave analysis of the BESIII data to determine the spin composition of the particles at the respective masses is underway.
(a)
]
2
m [MeV/c
1000 1100 1200 1300 1400 1500 1600
0 50 100 150 200 250 300 350 400 450
(b)
Figure 7.(a) Theπ0π0ηinvariant mass spectrum in photon-nucleon reactions forE
C M−mp>1450 MeV with Crystal Barrel at ELSA. (b) Theπ0π0η
invariant mass spectrum in photon-nucleon reactions with Crystal Barrel at ELSA requiring that theπ0ηmass is in thea0(980) (900 MeV<m(π0η)<
1100 MeV) mass region.
) [GeV]
η -π + π
m(
1 1.2 1.4 1.6 1.8 2 2.2 2.4 2.6 2.8 3 3.2
events
/5
MeV
0 100 200 300 400 500 600 700 800 900
η
-π
+
π γ → ψ J/
(a)
]
2
) [GeV/c
η -π + π
m(
1 1.1 1.2 1.3 1.4 1.5 1.6 1.7
2
events
/2
0
MeV/c
0 2 4 6 8 10 12 14 16 18 20
) η
-π
+
π ( γ → (2S) ψ
(b)
Figure 8.(a) Theπ+π−ηinvariant mass in radiativeJ/ψdecays measured with the BESIII experiment. (b) Theπ+π−ηinvariant mass in radiativeψ decays measured with the BESIII experiment.
at rest there is clear evidence that both states,η(1405) and η(1475), are produced [40, 41]. The η(1405) has decay channels both into up and down quark mesons and into strange quark mesons, as expected from a glueball, while the η(1475) decays mainly into open strange mesons. These were data at rest and we have now started to look for excitedη states in Crystal Barrel data at LEAR from annihilations at 900 and 1800 MeV/c antiproton momen-tum to study any dependence on the participating initial waves.
The statistics is again rather low, as could be seen in the invariant mass spectra. Nevertheless indications for the presence of signals round 1300 and 1405 MeV/c2are there (Fig. 9 and Fig. 10).
To summarize: The comparison between the pho-toproduction process, radiative charmonia decays and antiproton-proton annihilations shows that the signals at ≈ 1300 MeV/c2 and≈ 1400 MeV/c2 are produced with very different ratios. The≈ 1400 MeV/c2 signal in the photoproduction process still needs confirmation in the up-coming years by new data. Partial wave analyses will show if theη(1295) is present in the≈ 1300 MeV/c2 signal or if it is due to the f1(1285). Such a partial wave analysis, crucial for the interpretation of the data, is currently only
possible in the radiative charmonia decays but becomes feasible with higher statistics in the photonuclear reaction with Crystal Barrel experiment.
Figure 11. The π0π0η invariant mass measured with the
]
2
) [MeV/c
η -π + π
m(
800 1000 1200 1400 1600 1800 2000
2
Ereignisse/17.1429
MeV/c
0 20 40 60 80 100 120 140 160 180 200
]
2
) [MeV/c
η -π + π
m(
800 1000 1200 1400 1600 1800 2000
2
Ereignisse/17.1429
MeV/c
0 20 40 60 80 100 120 140 160
Figure 9.Theπ+π−ηinvariant mass in antiproton-proton annihilations measured with Crystal Barrel at LEAR. The left side shows data from antiproton momenta of 900 MeV/c and the right side of antiproton momenta of 1642 MeV/c. The non-resonant background calculated by Monte Carlo is shown in yellow and the difference between data and Monte Carlo is shown in blue. Cuts on the invariantπηmass requiring the events to be within ana0(980)
mass window are applied.
]
2
) [MeV/c
η 0 π 0 π
m(
800 1000 1200 1400 1600 1800 2000
2
Ereignisse/17.1429
MeV/c
0 20 40 60 80 100 120 140 160 180 200
]
2
) [MeV/c
η 0 π 0 π
m(
800 1000 1200 1400 1600 1800 2000
2
Ereignisse/17.1429
MeV/c
0 20 40 60 80 100
Figure 10. Theπ0π0ηinvariant mass in antiproton-proton annihilations measured with Crystal Barrel at LEAR. The left side shows data from antiproton momenta of 900 MeV/c and the right side of antiproton momenta of 1642 MeV/c. The non-resonant background calculated by Monte Carlo is shown in yellow and the difference between data and Monte Carlo is shown in blue. Cuts on the invariantπηmass requiring the events to be within ana0(980) mass window are applied.
3 Outlook
After the successful trigger upgrade of the Crystal Barrel calorimeter (see project D.3), we plan to have a dedicated beam time with the ELSA tagged photon beam at the high-est energies to produce a largeηevent sample, to study the ηdecays and theη(1405) excitation. The cross section for
the reactionγp → pη lies in the vicinity of 1 μb. The Crystal Barrel is a calorimeter with a wide range in energy and delivers in combination with the TAPS forward wall a solid angle coverage of up toΩ =εΩ·4πsr withεΩ=0.98.
The photon beam is produced via the bremsstrahlung pro-cess on a thin iron radiator of typical 50μm thickness. For the reactionγp → pηwe intend to measure in a photon energy interval from 1.4 GeV to 3.0 GeV expecting an av-erage cross section ofσT =1μb. By increasing the beam current of the accelerator ELSA and by disabling tagger channels outside the energy range of interest, the integral flux of photons can be increased by a factor of 3 so that the
photon flux in the energy range (Δω) between 1400 MeV and 3000 MeV yields ˙Nγ(Δω)=6·106γ/s.
As target, we intend to use liquid hydrogen in a cylindri-cal capton container of a length ofl=10.2 cm. The target density can be calculated using
NT =ρHlNA/A, (4)
whereNTrepresents the target density,ρH=0.0708 g/cm3 as the specific density of liquid hydrogen, NA = 6.022· 1023 mol−1as the Avogadro number and the atomic mass
A=1.00794 g/mol. This yieldsNT =4.315·10231/cm2. The total rate of producedηfor this set up can be calcu-lated according to
˙
Nη=N˙γ·NT·ση. (5)
cross section. This results in a total rate ofηper hour
˙
Nη=9 320events
h , (6)
According to the branching ratios forηdecays published by the PDG we expect for the six most dominant modes:
Mode Fraction Nhη Nη
103h
π+π−η 43.2±0.7 % 4 026 4 026 240
ρ0γ 29.3±0.5 % 2 730 2 730 760
π0π0η 21.7±0.8 % 2 022 2 022 440
ωγ 2.75±0.22 % 256 256 300
γγ 2.22±0.08 % 206 206 904
Total 99.17 % 9 240 9 242 644
The first column of Tab. 1 shows the decay branch, the second column gives the branching ratio, the third col-umn represents the rate of theηper hour and the fourth column represents the number ofηthat can be produced in 1 000 hours of beam time. The sum of "rare" η de-cay modes starting with theπ0π0ηcontribute 26.7% to the total. Already with the current acceptance of the Crystal Barrel setup, which is∼60 % for theγγand∼17 % for the π0π0ηdecay mode, we expect 467 events/h.
The work reported here would not have been possible without the enduring enthusiasm of many bachelor, master, and PhD stu-dents and the continuous technical support from staffmembers of the participating Universities. The support of the ELSA staff members and the polarized target group is gratefully recognized. We would like to thank F. Afzal for contributions to this report. We appreciate the support of the Schweizerischer Nationalfonds, the US National Science Foundation, and the Russian Founda-tion for Basic Research, in particular the generous support from the Deutsche Forschungsgemeinschaft (SFB/TR16).
References
[1] M. Unverzagt, PhD thesis HISKP, University Bonn (2008).
[2] M. Unverzagt et al., Eur. Phys. J. A39, 169 (2009). [3] S. Prakhov et al., Phys. Rev. C79, 035204 (2009). [4] S. P. Schneider, B. Kubis and C. Ditsche, JHEP1102,
028 (2011).
[5] K. Kampf, M. Knecht, J. Novotny and M. Zdrahal, Phys. Rev. D84, 114015 (2011).
[6] P. Guo, I. V. Danilkin, C. Fernández-Ramírez, V. Mathieu and A. P. Szczepaniak, arXiv:1608.01447 [hep-ph].
[7] G. Colangelo, S. Lanz, H. Leutwyler and E. Passemar, arXiv:1610.03494 [hep-ph].
[8] A. Nikolaev, PhD thesis HISKP, University Bonn (2011).
[9] A. Nikolaev et al., Eur. Phys. J. A50, 58 (2014). [10] H. Herminghaus et al., Nucl. Inst. Meth. A 138, 1
(1976).
[11] Th. Walcher, Prog. Part. Nucl. Phys.24, 189 (1990). [12] A. Jankowiak,Compilation of: Measurement of the electron beam energy at the Mainz Microtron, MAMI Internal Report 03/2006, Institut für Kernphysik, Mainz (2006).
[13] A. Jankowiak, Eur. Phys. J. A28, 149 (2006). [14] I. Anthony et al., Nucl. Inst. Meth. A 301, 230
(1991).
[15] S. J. Hall et al., Nucl. Inst. Meth. A368, 698 (1996). [16] A. Reiter et al., Eur. Phys. J. A30, 461 (2006). [17] M. Oreglia et al., Phys. Rev. D25, 2259 (1982). [18] A. Starostin et al., Phys. Rev. C64, 055205 (2001). [19] D. Watts,Calorimetry in Particle Physics:
Proceed-ings of the 11th International Conference, Perugia, Italy, 2004, edited by C. Cecchi, P. Lubrano, M. Pepe (World Scientific, Singapore), 560 (2005).
[20] R. Novotny, IEEE Trans. on Nucl. Sc. 38, 392 (1991).
[21] P. Nuhn, Diploma thesis HISKP, University Bonn (2012).
[22] F. N. Afzal, Master thesis HISKP, University of Bonn (2012).
[23] F. N. Afzal, EPJ Web of Conferences 73, 04005 (2014).
[24] V. Crede et al., Phys.Rev. C80, 055202 (2009). [25] M. Dugger et al., Phys.Rev.Lett.96, 062001 (2006). [26] F. N. Afzal, PhD thesis HISKP, University of Bonn
(2017).
[27] F. Huang et al., arXiv:1208.2279v1. [28] L. Tiator, Int.J.Mod.Phys. A22, 297 (2007). [29] D. Elsner et al., Eur. Phys. J. A33, 147 (2007). [30] O. Bartalini et al., Eur. Phys. J. A33, 169 (2007). [31] A. V. Anisovich et al., arXiv:1503.05774 [nucl-ex]. [32] D. Rönchen et al., Eur. Phys. J. A51, 70 (2015). [33] R. L. Workman, M. W. Paris, W. J. Briscoe, I. I.
Strakovsky, Phys. Rev. C86, 015202 (2012). [34] SAID: http://gwdac.phys.gwu.edu/
[35] E. Gutz et al., Eur. Phys. J. A50, 74 (2014). [36] F. N. Afzal, JPS Conf. Proc.10, 032006 (2016). [37] P. Levi Sandri et al., Eur.Phys.J. A51, no.7,77 (2015). [38] M. Bargiotti et al., Phys. Rev. D65, 012001 (2002). [39] M. Ablikim et al., Phys. Rev. Lett. 108, 182001
(2012).
[40] C. Amsler et al., Phys. Rev. D66, 058101 (2002). [41] C. Amsler et al., Phys. Lett. B358, 389 (1995). [42] T. Triffterer, PhD thesis, University of Bochum
(2016).
[43] C. Sowa, PhD thesis, University of Bochum (2016). [44] R. Dickson, R. A. Schumacher et al., Phys. Rev. C
93, 065202 (2016). Table 1.The branching ratios and number ofηper hour or 1000 h are
![Figure 2. (a) Plan view of the tagging bremsstrahlung facility [14, 15] and the Crystal Ball detector (not to scale) at Mainz](https://thumb-us.123doks.com/thumbv2/123dok_us/8150411.1359109/3.595.87.512.312.466/figure-plan-tagging-bremsstrahlung-facility-crystal-detector-mainz.webp)
![Figure 6. (a)-(d) The beam asymmetry Σ in η-photoproduction is shown for four different energy bins as a function of cos θCMS (blue points) [26]](https://thumb-us.123doks.com/thumbv2/123dok_us/8150411.1359109/6.595.84.508.93.423/figure-asymmetry-photoproduction-shown-dierent-energy-function-points.webp)


